

The Creeping Creatinine in a Growing Child With a Kidney Transplant: Distinguishing Progressive Graft Dysfunction From Normal Growth in Pediatric Kidney Transplant Recipients
- PMID: 39725645
- PMCID: PMC11671341
- DOI: 10.1111/petr.14883
The Creeping Creatinine in a Growing Child With a Kidney Transplant: Distinguishing Progressive Graft Dysfunction From Normal Growth in Pediatric Kidney Transplant Recipients
Abstract
Background: Pediatric kidney transplant recipients experience creeping creatinine, which is a slow increase in serum creatinine over time. Distinguishing between normal growth-related changes and possible allograft dysfunction becomes challenging when interpreting the increase in serum creatinine. We hypothesized that changes in BSA-indexed measured glomerular filtration rate (mGFR) or creatinine-estimated GFR (eGFR) might not be a true reflection of the renal function post-transplant and that for longitudinal follow-up a stable absolute mGFR is better.
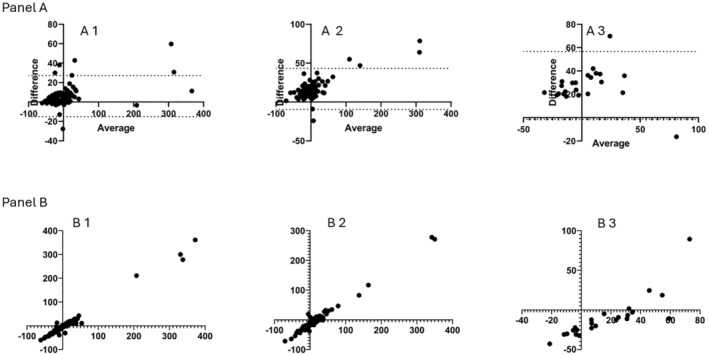
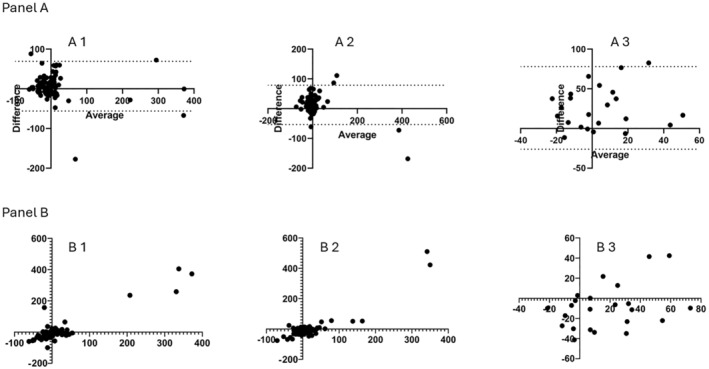
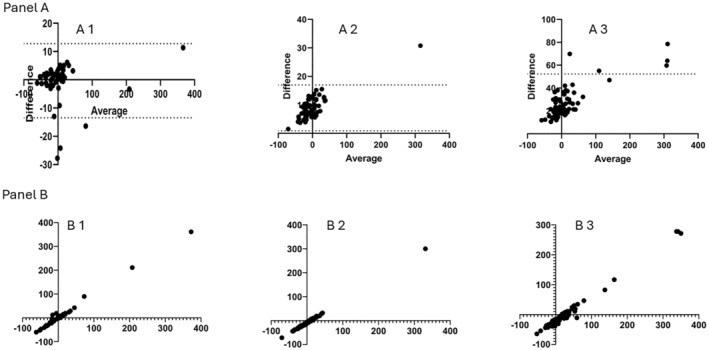
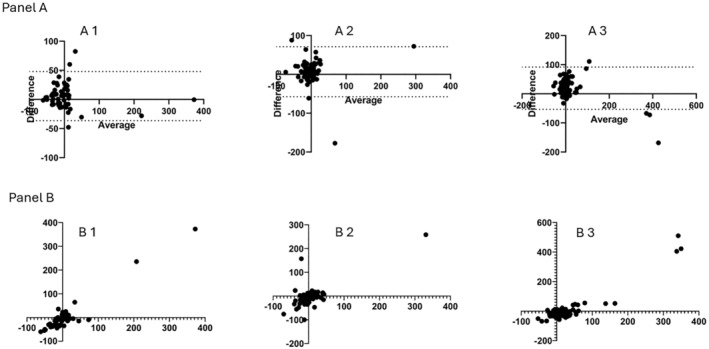
Methods: In total, 115 pediatric kidney transplant recipients transplanted between 2000 and 2021, with 319 measured GFR values (each subject had at least 2 values) were enrolled in this retrospective study. We analyzed after stratifying based on the height and BSA changes (< 5% change, 5%-14.9% change, and > 15% change in height and BSA) between measured GFR tests. The agreement between absolute mGFR and both BSA-indexed mGFR or eGFR was analyzed by Bland and Altman analysis and nonparametric Spearman's rank order correlation analysis.
Results: The bias between absolute mGFR and either BSA-indexed mGFR or eGFR increased as the % change in height and the BSA increased. Spearman's rank order correlation showed a strong correlation when the BSA and height changes were < 5% and the correlation weakened as the % changes increased.
Conclusions: In children who grew more, the BSA-indexed mGFR dropped more than the absolute mGFR. We propose that a stable absolute mGFR can be used to infer stable allograft function in the presence of height growth.
Keywords: glomerular filtration rate; growth; pediatrics; renal transplant.
© 2024 The Author(s). Pediatric Transplantation published by Wiley Periodicals LLC.
Conflict of interest statement
The authors have nothing to report.
The authors declare no conflicts of interest.
Figures
References
-
- Paul L. C., “Chronic Allograft Nephropathy: An Update,” Kidney International 56, no. 3 (1999): 783–793. - PubMed
-
- Fine R. N., “Growth Following Solid‐Organ Transplantation,” Pediatric Transplantation 6, no. 1 (2002): 47–52. - PubMed
-
- Tejani A., Fine R., Alexander S., Harmon W., and Stablein D., “Factors Predictive of Sustained Growth in Children After Renal Transplantation. The North American Pediatric Renal Transplant Cooperative Study,” Journal of Pediatrics 122, no. 3 (1993): 397–402. - PubMed
-
- Fine R. N., “Commentary on Long‐Term Growth Following Renal Transplantation in Children,” Transplantation 104, no. 1 (2020): 10–12. - PubMed
MeSH terms
Substances
LinkOut - more resources
Full Text Sources
Medical
Research Materials
Miscellaneous
