. 2024 Dec;12(24):e70091.
doi: 10.14814/phy2.70091.

Serum proteome profiling of plateau acclimatization in men using Olink proteomics approach

Affiliations

Serum proteome profiling of plateau acclimatization in men using Olink proteomics approach

Jingyu Pan et al. Physiol Rep. 2024 Dec.

Abstract

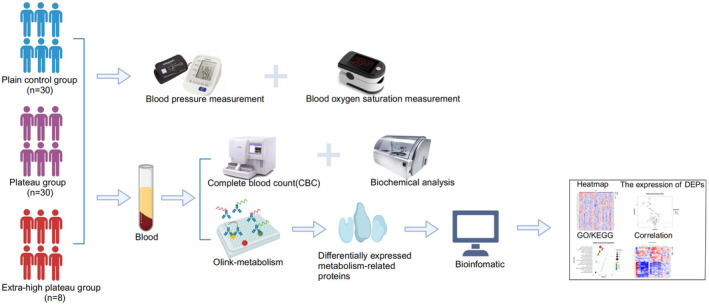
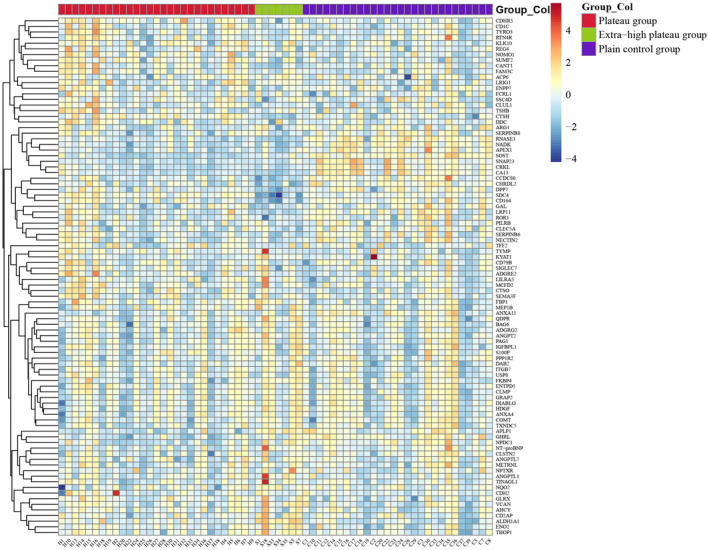
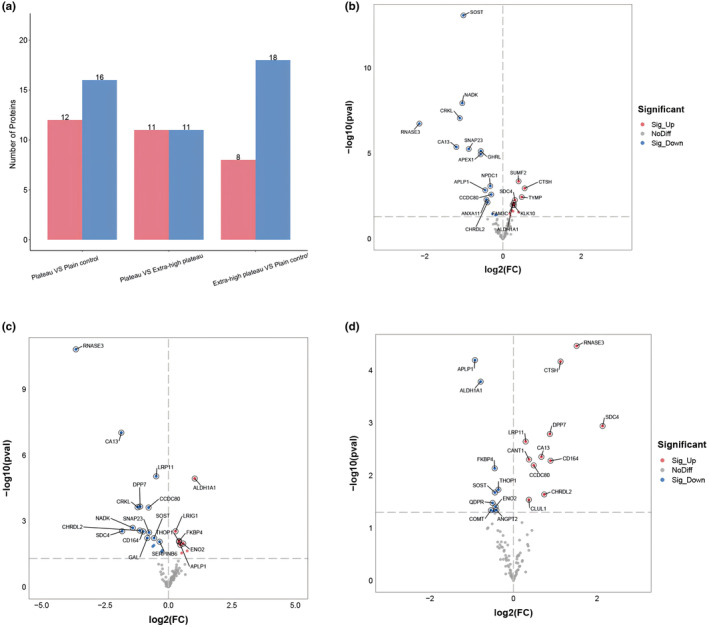
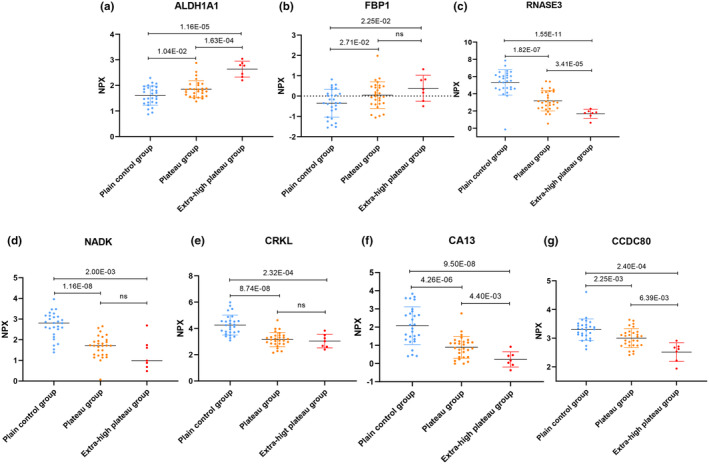
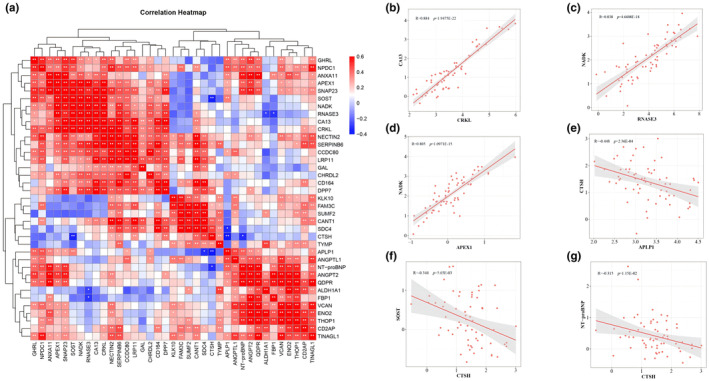
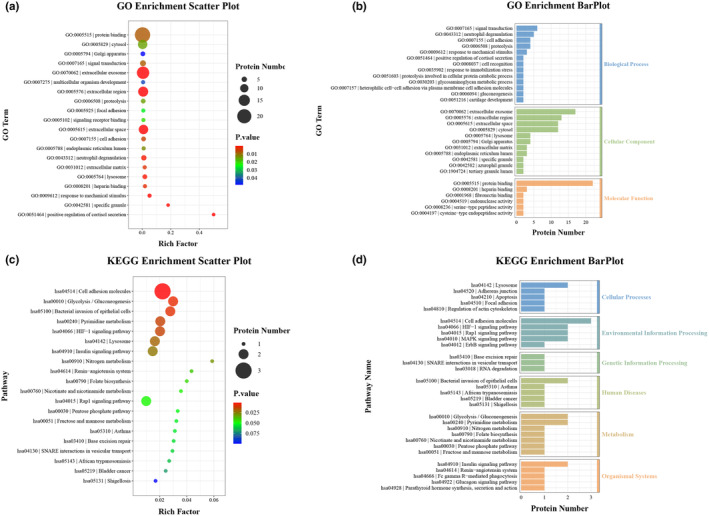
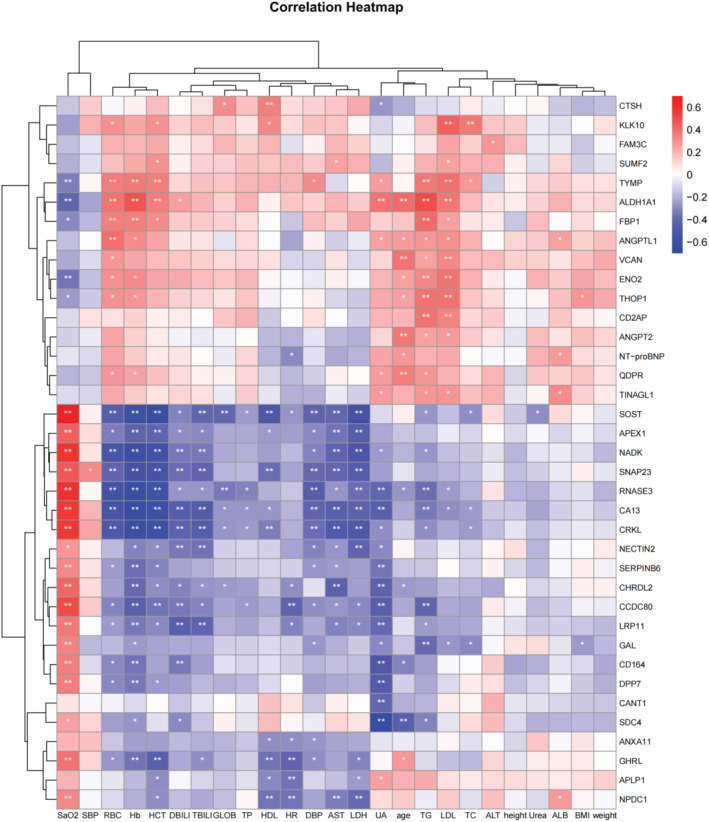
Plateau acclimatization involves adaptive changes in the body's neurohumoral regulation and metabolic processes due to hypoxic conditions at high altitudes. This study utilizes Olink targeted proteomics to analyze serum protein expression differences in Han Chinese individuals acclimatized for 6 months-1 year at 4500 and 5300 m altitudes, compared to those residing at sea level. The objective is to elucidate the proteins' roles in tissue and cellular adaptation to hypoxia. We identified 54 metabolism-related differentially expressed proteins (DEPs) in the serum of the high-altitude group versus the sea-level group, comprising 20 significantly upregulated and 34 downregulated proteins. Notably, 2 proteins were upregulated and 11 downregulated at both 4500 and 5300 m altitudes. The top three protein correlations among DEPs included CRKL with CA13, RNASE3 with NADK, and NADK with APEX1, alongside APLP1 with CTSH, CTSH with SOST, and CTSH with NT-proBNP in inverse correlations. KEGG enrichment analysis indicated significant DEP involvement in various metabolic pathways, particularly those associated with hypoxic cellular metabolism like glycolysis/gluconeogenesis and the HIF-1 signaling pathway. Correlation with clinical phenotypes showed positive associations of SOST, RNASE3, CA13, NADK, and CRKL with SaO2 and negative correlations with Hemoglobin and Hematocrit; ALDH1A1 positively correlated with Triglyceride; and SDC4 inversely correlated with Uric acid levels. This study provides insights into specific DEPs linked to metabolic adaptations in high-altitude acclimatized individuals, offering a foundation for understanding acclimatization mechanisms and potential therapeutic targets.

Keywords: Olink; hypoxia; metabolism; plateau acclimatization; proteomics.


Conflict of interest statement

The authors declare that the research was conducted in the absence of any commercial or financial relationships that could be construed as a potential conflict of interest.

Figures

FIGURE 1
FIGURE 1
Serum olink‐targeted proteomics study strategy and schematic. Recruitment of subjects from high altitude group, extra‐high altitude group, and plain control group. Parameters measured include blood pressure, heart rate, and fingertip arterial SaO2. Venous blood samples collected for complete blood count (CBC) and biochemical analysis. Application of Olink‐targeted proteomics for detection of serum differentially expressed proteins (DEPs) associated with cellular metabolism, accompanied by bioinformatics analysis.
FIGURE 2
FIGURE 2
Analysis of differential expression of 92 metabolism‐related target proteins in serum from plateau, extra‐high plateau, and plain control groups. Heatmap depicting clustering analysis of serum differentially expressed proteins (DEPs) in subjects from plateau, extra‐high plateau, and plain control groups.
FIGURE 3
FIGURE 3
Analysis of differential expression of 92 metabolism‐related target proteins in serum from plateau, extra‐high plateau, and plain control groups. (a) Comparative analysis between plateau, extra‐high plateau, and plain control groups, with a histogram indicating the count of DEPs. (b) Volcano plot illustrating the distribution of DEPs in the plateau group versus the plain control group. (c) Volcano plot showing DEP distribution when comparing the plateau group with the plain control group. (d) Volcano plot representing DEP distribution in the plateau group compared with the extra‐high plateau group. In the heatmap, each x‐axis coordinate represents a sample, each y‐axis coordinate signifies a target protein, and the color bar's gradient from blue to red indicates expression levels; darker blue signifies lower expression, darker red indicates higher expression. In the volcano plots, the horizontal axis represents the fold change in expressed proteins between the two serum groups [log2 (FC) value], and the vertical axis signifies the statistical significance of the target proteins' differential expression [−log10 (p‐value)]. Scattered dots represent different target proteins; gray for proteins with no significant difference, red for upregulated proteins, and blue for downregulated proteins.
FIGURE 4
FIGURE 4
Top 5 DEPs Upregulated or Downregulated with Increasing Altitude and Exhibiting the Smallest p‐values in the Serum of Plateau, Extra‐High Plateau, and Plains Control Groups. (a) Upregulation of Retinal Dehydrogenase 1 (ALDH1A1). (b) Upregulation of Fructose‐1,6‐Bisphosphatase 1 (FBP1). (c) Downregulation of Eosinophil Cationic Protein (RNASE3). (d) Downregulation of NAD Kinase (NADK). (e) Downregulation of Crk‐Like Protein (CRKL). (f) Downregulation of Carbonic Anhydrase 13 (CA13). (g) Downregulation of Coiled‐Coil Domain‐Containing Protein 80 (CCDC80). Expression levels normalized to NPX (normalized protein expression).
FIGURE 5
FIGURE 5
Correlation Analysis of Differentially expressed proteins (DEPs) in the Serum of Plateau, Extra‐High Plateau, and Plains Control Groups. (a) Heatmap representing two‐by‐two comparative correlation analysis of DEPs across the three groups. (b) Positive correlation observed between Crk‐Like Protein (CRKL) and Carbonic Anhydrase 13 (CA13). (c) Positive correlation identified between Eosinophil Cationic Protein (RNASE3) and NAD Kinase (NADK). (d) APEX Nuclease 1 (APEX1) demonstrated positive correlation with NADK. (e) Amyloid Beta Precursor‐Like Protein 1 (APLP1) showed negative correlation with Cathepsin H (CTSH). (f) CTSH exhibited negative correlation with Sclerostin (SOST). (g) Negative correlation between CTSH and N‐terminal pro‐B‐type Natriuretic Peptide (NT‐proBNP) identified. Correlation heatmap denotes positive correlation in red, negative correlation in blue, and absence of correlation in white. ‘R’ represents Pearson's correlation coefficient. Significance levels are indicated as * for p < 0.05, ** for p < 0.01 and *** for p < 0.001.
FIGURE 6
FIGURE 6
Gene Ontology (GO) and Kyoto Encyclopedia of Genes and Genomes (KEGG) Enrichment Analysis of Differentially Expressed Proteins (DEPs) in the Serum of Plateau, Extra‐High Plateau, and Plains Control Groups. A total of 37 DEPs were analyzed using GO and KEGG enrichment methods. (a) GO enrichment analysis bubble plot illustrating the TOP20 GO terms, selected based on the significance of enrichment (p‐value) and the number of enriched proteins. (b) GO enrichment analysis histogram displaying the distribution of DEPs across biological process, cellular component, and molecular function categories based on the number of GO terms enriched. (c) KEGG enrichment analysis bubble plot representing the top 20 pathways, chosen according to the significance of enrichment (p‐value) and the number of enriched proteins. (d) KEGG enrichment analysis hierarchical histogram showing the distribution of DEPs across various pathways. In the bubble plots, the Rich factor on the horizontal axis indicates the proportion of DEPs in a specific GO Term relative to the total number of proteins in that term. A higher Rich Factor signifies greater enrichment. The size of the dots corresponds to the number of enriched proteins, and the color denotes the p‐value, indicating the significance of the enrichment.
FIGURE 7
FIGURE 7
Heatmap of Correlation Analysis Between DEPs in Serum and Clinical Characteristics of Subjects in Plateau, Extra‐High Plateau, and Plain Control Groups. This analysis involved 37 DEPs and their correlation with 4 physiological and 17 blood indices. In the heatmap, the horizontal axis represents clinical characteristic indices, while the vertical axis corresponds to the DEPs. A positive correlation is indicated by red color, a negative correlation by blue color, and no correlation is shown in white. Significance levels are indicated as * for p < 0.05, ** for p < 0.01 and *** for p < 0.001.

Similar articles

References

    1. Addi, C. , Presle, A. , Frémont, S. , Cuvelier, F. , Rocancourt, M. , Milin, F. , Schmutz, S. , Chamot‐Rooke, J. , Douché, T. , Duchateau, M. , Giai Gianetto, Q. , Salles, A. , Ménager, H. , Matondo, M. , Zimmermann, P. , Gupta‐Rossi, N. , & Echard, A. (2020). The Flemmingsome reveals an Escrt‐to‐membrane coupling via Alix/Syntenin/Syndecan‐4 required for completion of cytokinesis. Nature Communications, 11, 1941. - PMC - PubMed
    1. Agledal, L. , Niere, M. , & Ziegler, M. (2010). The phosphate makes a difference: Cellular functions of Nadp. Redox Report, 15, 2–10. - PMC - PubMed
    1. Alterio, V. , Vitale, R. M. , Monti, S. M. , Pedone, C. , Scozzafava, A. , Cecchi, A. , de Simone, G. , & Supuran, C. T. (2006). Carbonic anhydrase inhibitors: X‐ray and Molecular modeling study for the interaction of a fluorescent antitumor sulfonamide with isozyme ii and ix. Journal of the American Chemical Society, 128, 8329–8335. - PubMed
    1. Burtscher, J. , Mallet, R. T. , Pialoux, V. , Millet, G. P. , & Burtscher, M. (2022). Adaptive responses to hypoxia and/or hyperoxia in humans. Antioxidants & Redox Signaling, 37, 887–912. - PubMed
    1. Burtscher, M. , Hefti, U. , & Hefti, J. P. (2021). High‐altitude illnesses: Old stories and new insights into the pathophysiology, treatment and prevention. Sports Medicine and Health Science, 3, 59–69. - PMC - PubMed

LinkOut - more resources