. 2024 Dec 26;7(1):1701.
doi: 10.1038/s42003-024-07425-6.

Therapeutic potential of microglial SMEK1 in regulating H3K9 lactylation in cerebral ischemia-reperfusion

Affiliations

Therapeutic potential of microglial SMEK1 in regulating H3K9 lactylation in cerebral ischemia-reperfusion

Wei-Yue Si et al. Commun Biol. .

Abstract

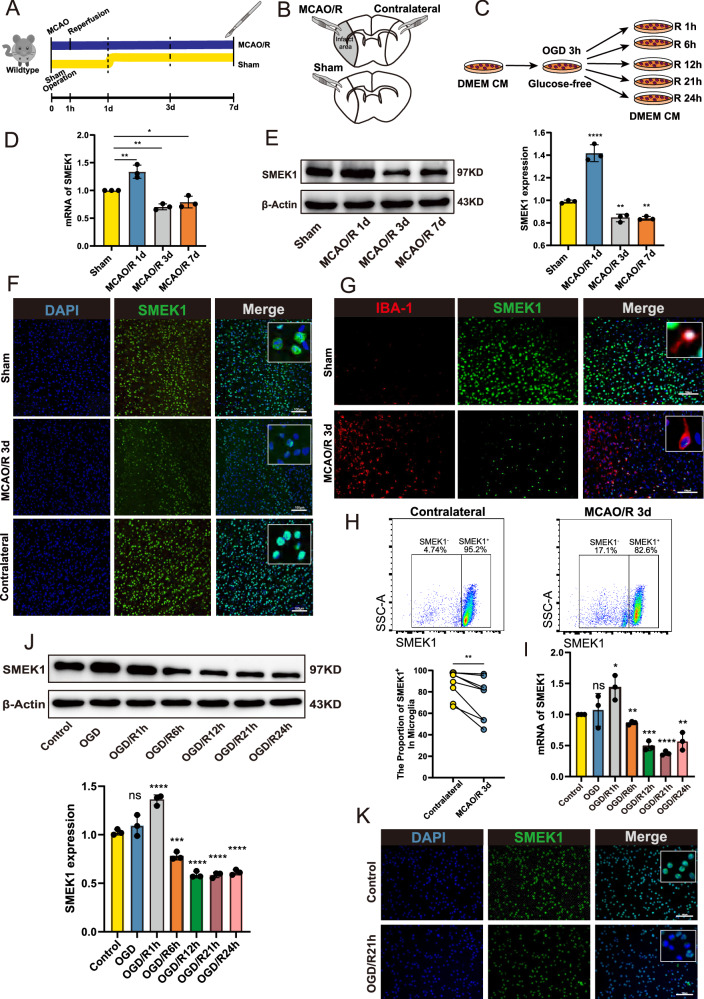
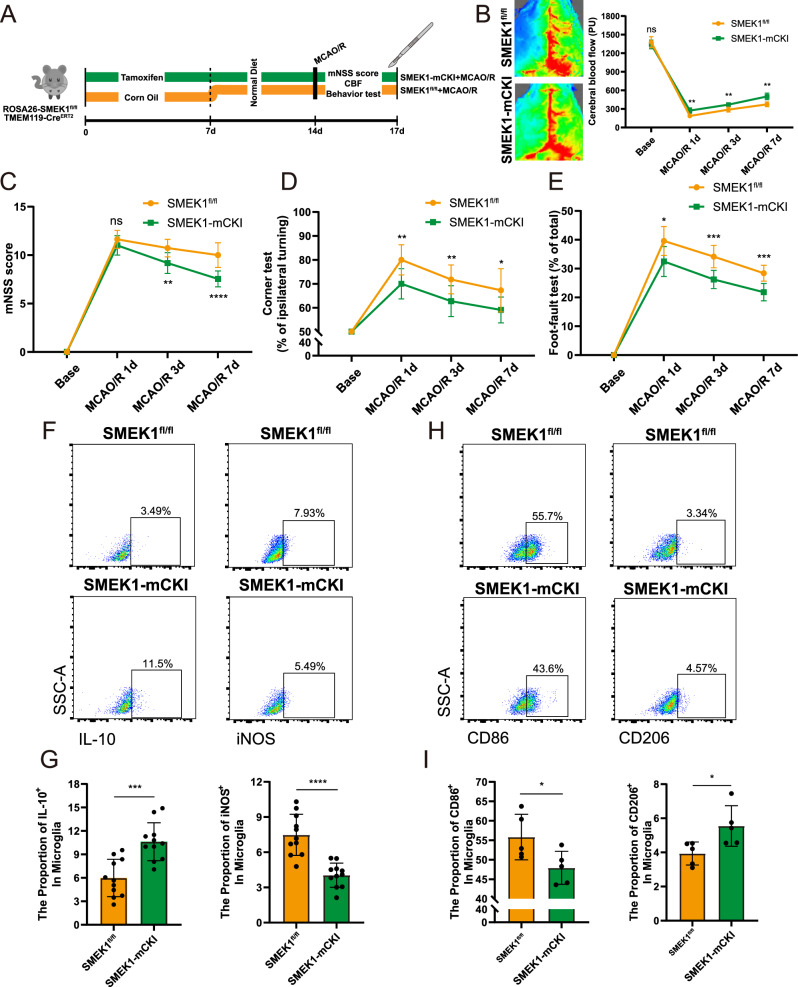
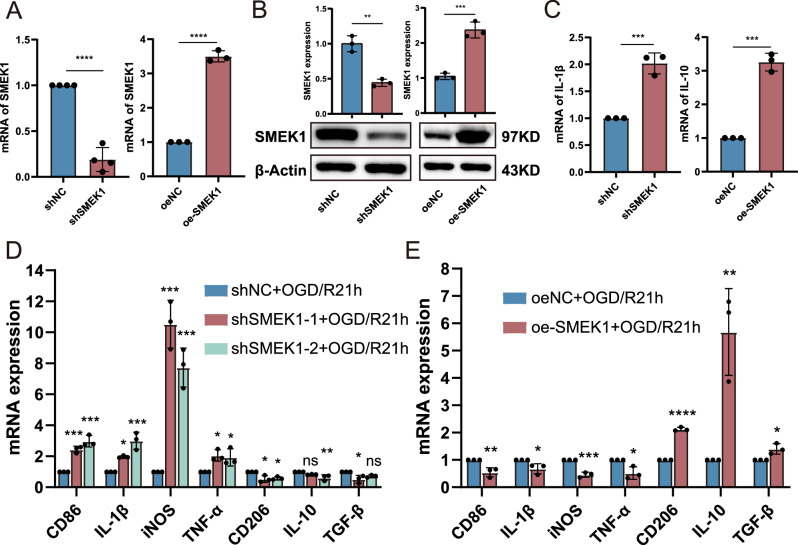
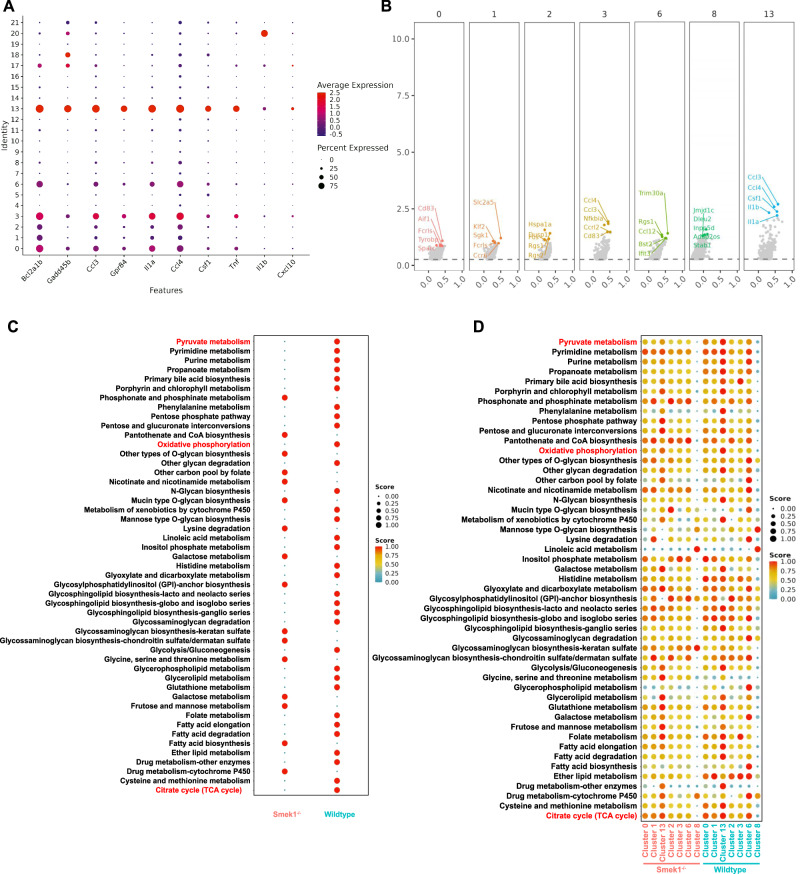
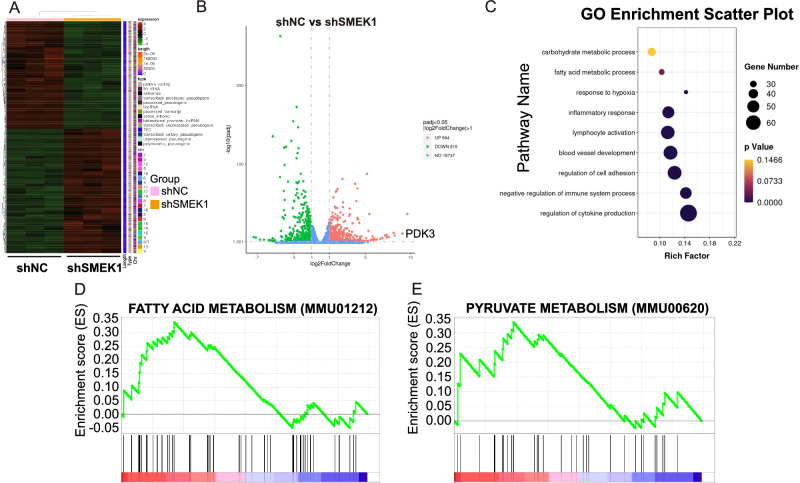
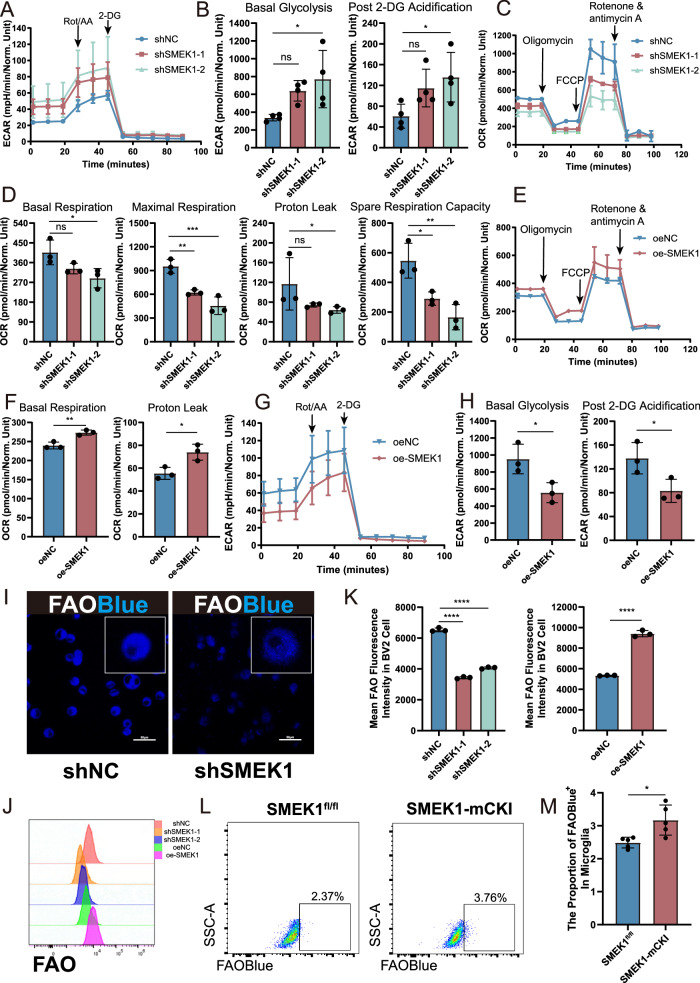
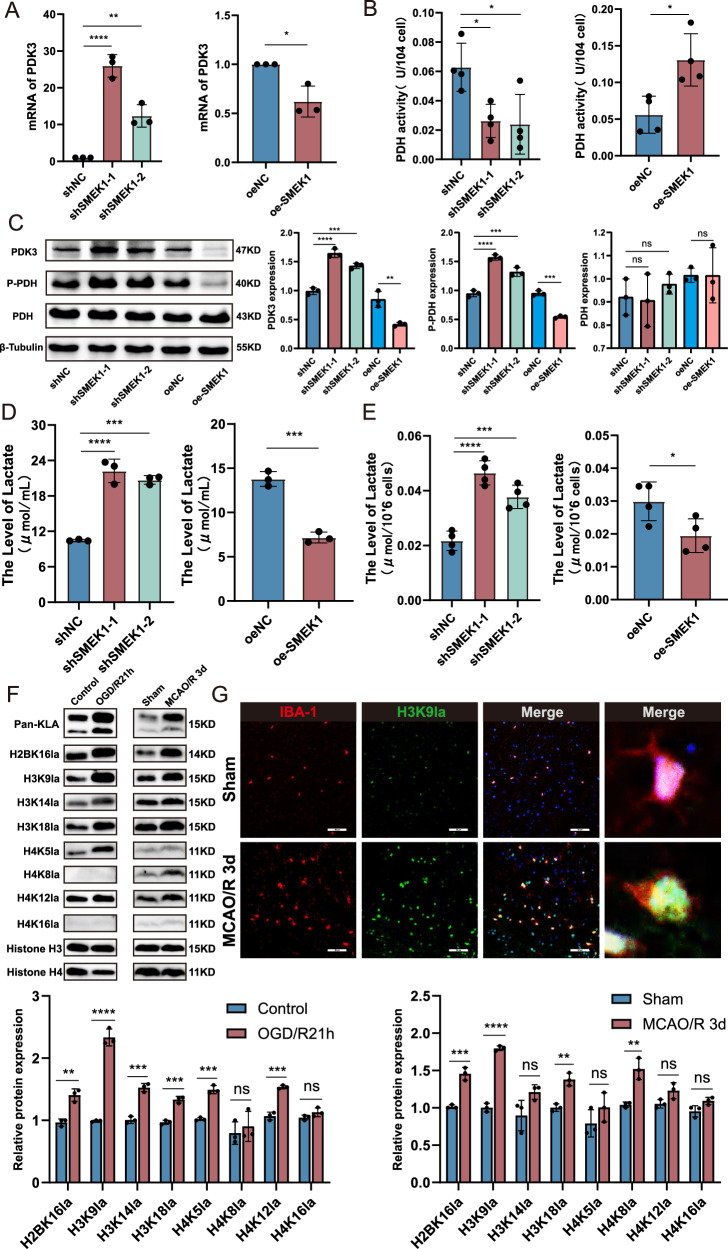
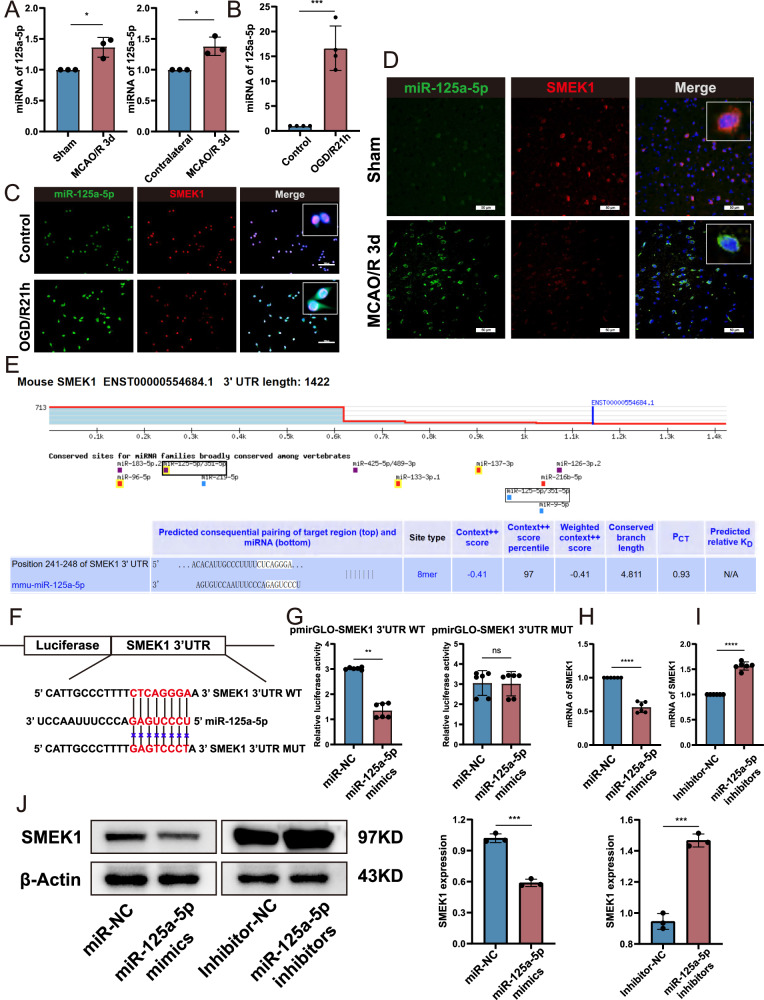
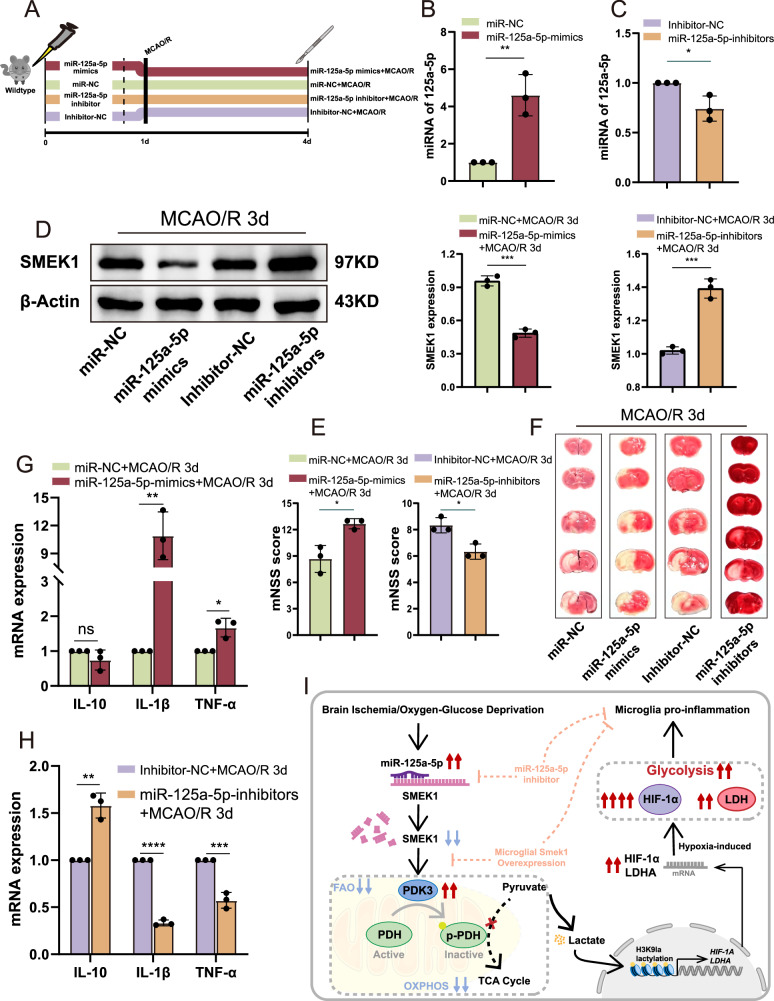
Acute ischemic stroke (AIS) triggers immune responses and neuroinflammation, contributing to brain injury. Histone lactylation, a metabolic stress-related histone modification, plays a critical role in various diseases, but its involvement in cerebral ischemia remains unclear. This study utilized a transient middle cerebral artery occlusion/reperfusion (MCAO/R) model and an oxygen-glucose deprivation/reoxygenation (OGD/R) model to investigate the role of microglial histone lactylation in ischemia-reperfusion injury. Lactate overload post-AIS increased histone lactylation, while reduced SMEK1 expression in microglia correlated with elevated lactate and neuroinflammation. Microglia-specific SMEK1 deficiency enhanced lactate production by inhibiting the pyruvate dehydrogenase kinase 3-pyruvate dehydrogenase (PDK3-PDH) pathway, increasing H3 lysine 9 lactylation (H3K9la), activating Ldha and Hif-1α transcription, and promoting glycolysis. SMEK1 overexpression improved neurological recovery in ischemic mice. This study highlights SMEK1 as a novel regulator of histone lactylation and a potential therapeutic target for mitigating neuroinflammation and enhancing recovery after AIS.


Conflict of interest statement

Competing interests: The authors declare no competing interests.

Figures

Fig. 1
Fig. 1. Microglial SMEK1 expression fluctuated with time after MCAO/R and OGD/R.
A Schematic diagram of the mouse experimental design. B Schematic diagram of the sampling sites. C Schematic diagram of the experimental design for BV2 cells. Determination of SMEK1 mRNA (D) and protein (E) expression in the Sham and MCAO/R 1 d, 3 d and 7 d groups. n = 3 per group. F Representative photos of SMEK1+ cells in the Sham, MCAO/R 3 d and Contralateral groups, scale bar: 100 μm. G Representative photos of SMEK1+ microglia in the Sham and MCAO/R 3 d groups, scale bar: 100 μm. H Gating strategy for SMEK1+ microglia isolated from the brain after MCAO/R and the proportion of SMEK1+ microglia in the MCAO/R 3 d and Contralateral groups. n = 8 per group. SMEK1 mRNA (I) and protein (J) expression in BV2 cells subjected to OGD for 3 h followed by exposure to a normal oxygen concentration for 0, 1, 6, 12, 21 or 24 h. n = 3 per group. K Representative photos of SMEK1+ BV2 cells in the control and OGD/R21h groups, scale bar: 100 μm. *p < 0.05; **p < 0.01; ***p < 0.001; ****p < 0.0001 vs. Sham or Control group. ns not significant.
Fig. 2
Fig. 2. Neuroinflammation was reduced after MCAO/R in SMEK1-mCKI mice.
A Schematic diagram of the experimental design for the SMEK1-mCKI mice. B Representative photographs of laser speckle contrast images and quantitative analyses of cortical CBF. n = 5 per group. Neurobehavioral function was evaluated by the mNSS (C), corner test (D) and foot-fault test (E). F Gating strategy for IL-10+, iNOS+ microglia in the brains of control and SMEK1-mCKI mice after MCAO/R 3 d. G Flow cytometry analysis of IL-10, iNOS expression in microglia from the brains of control and SMEK1-mCKI mice after MCAO/R 3 d. C-G, n = 11 for each group. H Gating strategy for CD86+ and CD206+ microglia in the brains of control and SMEK1-mCKI mice after MCAO/R 3 d. I Flow cytometry analysis of CD86 and CD206 expression in microglia from the brains of control and SMEK1-mCKI mice after MCAO/R 3 d. H, I n = 5 per group. *p < 0.05; **p < 0.01; ***p < 0.001; ****p < 0.0001 vs. Base or SMEK1fl/fl group. ns not significant.
Fig. 3
Fig. 3. Microglial SMEK1 deficiency promotes neuroinflammation.
The expression of SMEK1 mRNA (A) and protein (B) in shNC, shSMEK1 (n = 4 per group), oeNC and oe-SMEK1 (n = 3 per group) BV2 cells was assessed using qPCR and WB. C The expression of IL-1β mRNA in shNC and shSMEK1 BV2 cells and the expression of IL-10 mRNA in oeNC and oe-SMEK1 BV2 cells were assessed using qPCR. D The expression of CD86, IL-1β, iNOS, TNF-α, CD206, IL-10 and TGF-β mRNA in shNC- and shSMEK1-treated BV2 cells subjected to OGD for 3 h/R21 h was assessed using qPCR. E CD86, IL-1β, iNOS, TNF-α, CD206, IL-10 and TGF-β mRNA levels in oeNC and oe-SMEK1 BV2 cells subjected to OGD for 3 h/R for 21 h were assessed using qPCR. CE n = 3 for each group. *p < 0.05; **p < 0.01; ***p < 0.001; ****p < 0.0001 vs. shNC or oeNC or shNC+OGD/R21h or oeNC+OGD/R21h group. ns not significant.
Fig. 4
Fig. 4. Integrated scRNA-seq and bulk RNA-seq analysis revealed that microglial SMEK1 deficiency suppresses mitochondrial oxidative phosphorylation.
A Dot plots of microglia-related genes expressed among cell clusters. B Volcano map of marker genes in different microglial clusters. C Dot plots showing differences in metabolic characteristics between SMEK1−/− and wild-type mice. D Dot plots showing metabolic characteristics of seven microglial clusters between SMEK1−/− and wild-type mice.
Fig. 5
Fig. 5. Integrated scRNA-seq and bulk RNA-seq analysis revealed that microglial SMEK1 deficiency suppresses mitochondrial oxidative phosphorylation.
A Heatmap from RNA sequencing analysis depicting genes differentially expressed between shNC-treated and shSMEK1-treated BV2 cells. B A total of 594 upregulated and 515 downregulated genes were identified using RNA sequencing analysis of shNC and shSMEK1 BV2 cells, and the expression of PDK3 was upregulated in shSMEK1 BV2 cells. C A number of cytokine-related biological processes and several biological processes related to lipid synthesis were enriched according to the GOBP analysis. GSEA of enriched fatty acid metabolism (D) and pyruvate metabolism (E).
Fig. 6
Fig. 6. Loss of SMEK1 causes metabolic reprogramming in microglia.
A, G The extracellular acidification rate (ECAR) of BV2 cells was measured using a Seahorse XF24 Extracellular Flux Analyzer. B, H Bar graphs demonstrating basal glycolysis and post-2-DG acidification. A and B, n = 4 per group; G and H, n = 3 per group. C, E Representative oxidative phosphorylation (OCR) Seahorse bioenergetics profiles before and after injections of oligomycin (1 μM), FCCP (1 μM), and rotenone/antimycin A (0.5 μM). D, F Bar graphs demonstrating basal respiration, maximal respiration, proton leakage and spare respiratory capacity. n = 3 per group. I Representative photos of FAO levels in shNC and shSEMK1 BV2 cells, scale bar: 50 μm. J, K Flow cytometry analysis of FAO levels in shNC, shSMEK1, oeNC and oe-SMEK1 BV2 cells. n = 3 per group. L Gating strategy for FAOBlue+ microglia in the brains of control and SMEK1-mCKI mice after MCAO/R 3 d. M Flow cytometry analysis of FAO levels in microglia from the brains of control and SMEK1-mCKI mice after MCAO/R 3 d. n = 5 per group. *p < 0.05; **p < 0.01; ***p < 0.001; ****p < 0.0001 vs. shNC or oeNC or SMEK1fl/fl group. ns not significant.
Fig. 7
Fig. 7. Microglial SMEK1 deficiency promotes histone lactylation via the PDK3-PDH signaling pathway.
A Determination of PDK3 mRNA expression in shNC, shSMEK1, oeNC and oe-SMEK1 BV2 cells. n = 3 for each group. B PDH activity of shNC, shSEMK1, oeNC and oe-SMEK1 BV2 cells. n = 4 per group. C The protein expression of PDK3, PDH and P-PDH in shNC, shSMEK1, oeNC and oe-SMEK1 BV2 cells was assessed using WB. Extracellular (D) (n = 3 per group) and intracellular (E) (n = 4 per group) LA levels in shNC, shSMEK1, oeNC and oe-SMEK1 BV2 cells. F Determination of Pan-Kla, H2BK16la, H3K9la, H3K14la, H3K18la, H4K5la, H4K8la, H4K12la and H4K16la protein expression in control, OGD/R21h BV2 cells and Sham, MCAO/R 3 d mice. n = 3 for each group. G Representative photos of H3K9la+ microglia in the Sham and MCAO/R 3 d groups, scale bar: 50 μm. *p < 0.05; **p < 0.01; ***p < 0.001; ****p < 0.0001 vs. shNC or oeNC or Control or Sham group. ns not significant.
Fig. 8
Fig. 8. H3K9la stimulates Ldha and Hif-1α gene transcription.
A BV2 cells were subjected to OGD/R21h, and ChIP assays were performed with antibodies against H3K9la. B Determination of Ldha and Hif-1α mRNA expression in control and OGD/R21h BV2 cells. n = 3 for each group. C Determination of Pan-Kla, H2BK16la, H3K9la, H3K14la, H3K18la, H4K5la, H4K8la, H4K12la and H4K16la protein expression in shNC, shSMEK1, oeNC, and oe-SMEK1 BV2 cells after OGD/R21h and in SMEK1fl/fl and SMEK1-mCKI mice after MCAO/R 3 d. n = 3 for each group. D Representative photos of H3K9la+ microglia in SMEK1fl/fl and SMEK1-mCKI mice, scale bar: 50 μm. E Determination of Ldha mRNA expression in shNC, shSMEK1, oeNC and oe-SMEK1 BV2 cells after OGD/R21h. n = 3 for each group. F LDH activity of shNC, shSEMK1 (n = 3 per group), oeNC and oe-SMEK1 (n = 4 per group) BV2 cells. Determination of Hif-1α mRNA (G) and protein (H) expression in shNC, shSMEK1 (n = 3 per group), oeNC and oe-SMEK1 (n = 4 per group) BV2 cells subjected to OGD/R21h. *p < 0.05; **p < 0.01; ***p < 0.001; ****p < 0.0001 vs. Control or shNC+OGD/R21h or oeNC+OGD/R21h or shNC or oeNC group. ns not significant.
Fig. 9
Fig. 9. MiR-125a-5p regulates the expression of microglial SMEK1.
A RT-qPCR analysis of the expression of miR-125a-5p in brain tissue from the Sham, Contralateral and MCAO/R 3 d groups. n = 3 per group. B The expression of miR-125a-5p in BV2 cells subjected to OGD/R21h was assessed using qPCR. n = 4 per group. Fluorescence in situ hybridization (FISH) was used to detect the location of miR-125a-5p and SMEK1 in BV2 cells (C) subjected to OGD/R21h and in the brains (D) of MCAO/R 3 d mice, scale bar: 100 and 50 μm. E The binding position and complementary sequence of miR-125a-5p in the 3’UTR of SMEK1, as predicted by TargetScan. F Construction of wild-type (WT) and mutant (MUT) luciferase reporter vectors based on the predicted binding site of miR-125a-5p in the 3’UTR of SMEK1. G BV2 cells were cotransfected with the reporter vectors and miR-NC or miR-125a-5p. Luciferase activity was assessed 48 h after transfection. n = 6 per group. Determination of SMEK1 mRNA (H, I) and protein (J) expression in BV2 cells transfected with miR-NC, miR-125a-5p mimics, inhibitor-NC and miR-125a-5p inhibitors. n = 6 per group. *p < 0.05; **p < 0.01; ***p < 0.001; ****p < 0.0001 vs. Sham or Contralateral or Control or miR-NC or Inhibitor-NC group. ns not significant.
Fig. 10
Fig. 10. miR-125a-5p inhibitors improved the symptoms of MCAO/R mice.
A The timeline of the experimental protocol. B, C The expression of miR-125a-5p in the brains of MCAO/R 3 d mice after nasal delivery was assessed using qPCR. D Determination of SMEK1 protein expression in the brains of MCAO/R 3 d mice after nasal delivery. E Neurological function was evaluated by the mNSS test. F Representative photographs of TTC staining. G, H The expression of IL-10, IL-1β and TNF-α in the brains of MCAO/R 3 d mice after nasal delivery was assessed using qPCR. I Schematic diagram showing the mechanism of SMEK1 in ischemic stroke. n = 3 for each group. *p < 0.05; **p < 0.01; ***p < 0.001; ****p < 0.0001 vs. miR-NC or Inhibitor-NC or miR-NC + MCAO/R 3 d or Inhibitor-NC + MCAO/R 3 d group. ns not significant.

References

    1. Owolabi, M. O. et al. Primary stroke prevention worldwide: translating evidence into action. Lancet Public Health7, e74–e85 (2022). - PMC - PubMed
    1. Sun, Q. et al. Healthy lifestyle and life expectancy at age 30 years in the Chinese population: an observational study. Lancet Public Health7, e994–e1004 (2022). - PMC - PubMed
    1. Liu, C. et al. EphA4 regulates white matter remyelination after ischemic stroke through Ephexin-1/RhoA/ROCK signaling pathway. Glia70, 1971–1991 (2022). - PubMed
    1. Fisher, M. & Saver, J. L. Future directions of acute ischaemic stroke therapy. Lancet Neurol.14, 758–767 (2015). - PubMed
    1. Fu, Y., Liu, Q., Anrather, J. & Shi, F. D. Immune interventions in stroke. Nat. Rev. Neurol.11, 524–535 (2015). - PMC - PubMed