. 2024 Dec 26;7(1):380.
doi: 10.1038/s41746-024-01370-8.

Fast and accurate prediction of drug induced proarrhythmic risk with sex specific cardiac emulators

Affiliations

Fast and accurate prediction of drug induced proarrhythmic risk with sex specific cardiac emulators

Paula Dominguez-Gomez et al. NPJ Digit Med. .

Abstract

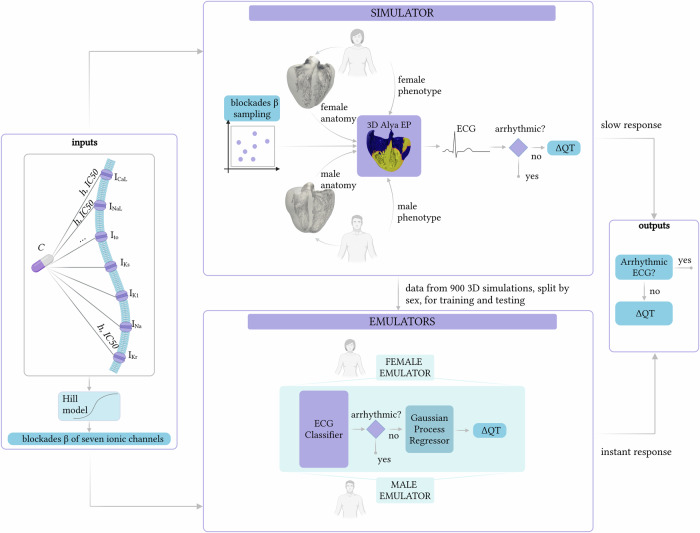
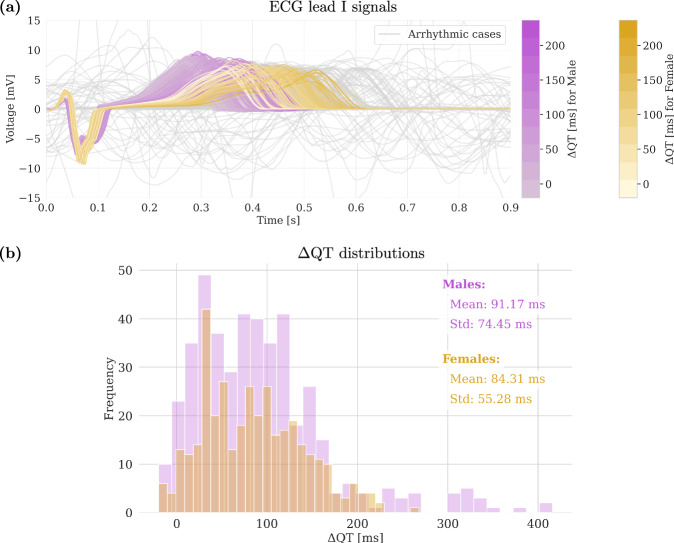
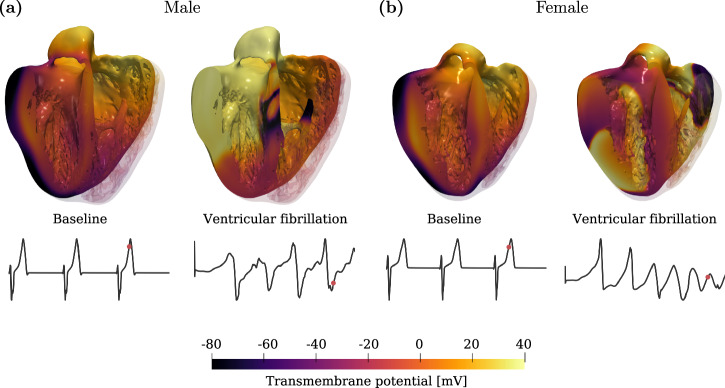
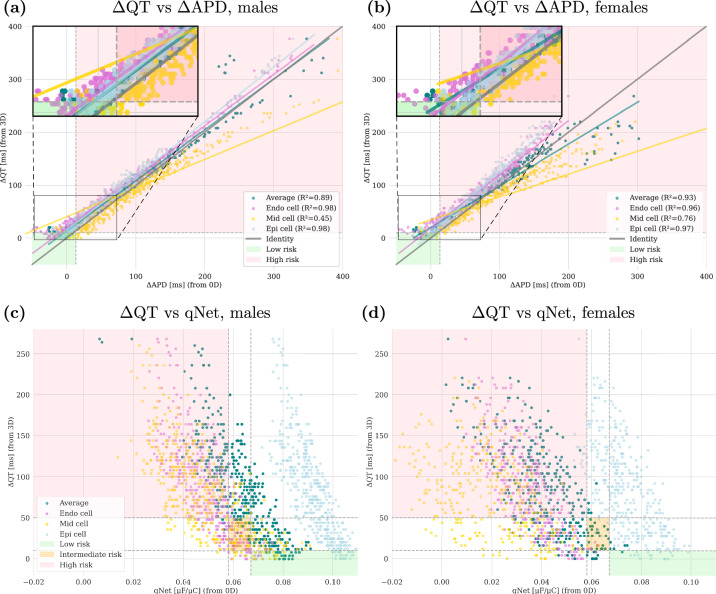
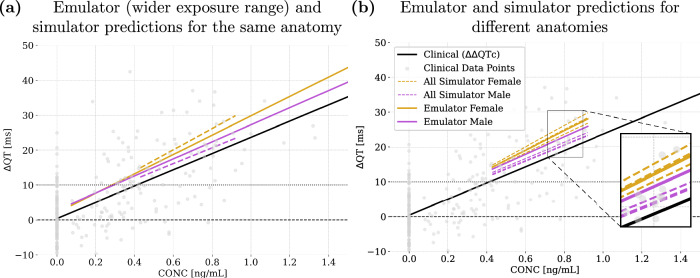
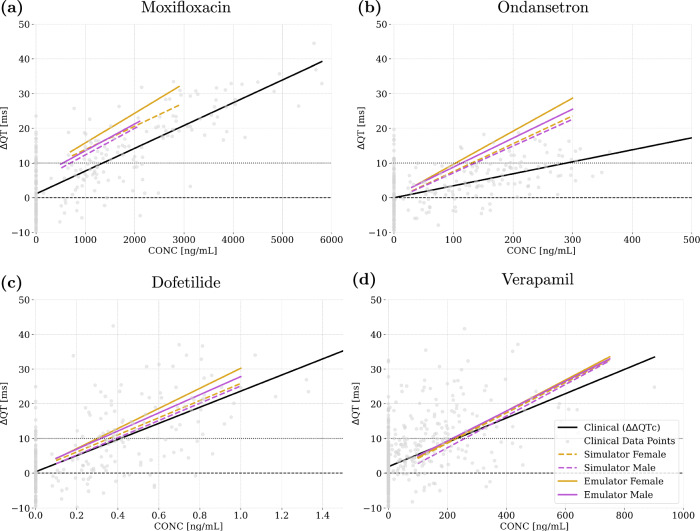
In silico trials for drug safety assessment require many high-fidelity 3D cardiac simulations to predict drug-induced QT interval prolongation, which is often computationally prohibitive. To streamline this process, we developed sex-specific emulators for a fast prediction of QT interval, trained on a dataset of 900 simulations. Our results show significant differences between 3D and 0D single-cell models as risk levels increase, underscoring the ability of 3D modeling to capture more complex cardiac responses. The emulators demonstrated an average error of 4% compared to simulations, allowing for efficient global sensitivity analysis and fast replication of in silico clinical trials. This approach enables rapid, multi-dose drug testing on standard hardware, addressing critical industry challenges around trial design, assay variability, and cost-effective safety evaluations. By integrating these emulators into drug development, we can improve preclinical reliability and advance the practical application of digital twins in biomedicine.


Conflict of interest statement

Competing interests: P.D., A.Z., L.B., C.B., B.D. and J.A. declare no competing interests. M.V. is CTO and co-founder of ELEM Biotech and C.M. is CEO and co-founder of ELEM Biotech.

Figures

Fig. 1
Fig. 1. Overview of the methodology employed to build the ΔQT emulators.
This methodology uses a simulator and sex-specific emulators to predict QT prolongations based on blockade levels of seven ionic channels, derived from the Hill model. The simulator performs 3D cardiac electrophysiological simulations for male and female anatomies, generating ECG data to classify arrhythmia and producing ΔQT outputs for training the emulators. The emulators consist of an ECG classifier followed by a Gaussian Process Regression model for fast ΔQT predictions.
Fig. 2
Fig. 2. ECG signals and ΔQT distributions computed with the simulator.
a ECG lead I signals for male and female subjects, with grey signals representing arrhythmic cases. b ΔQT distributions for male and female subjects.
Fig. 3
Fig. 3. Examples of 3D electrophysiological simulations obtained with detailed biventricular anatomies.
Both for the male (a) and female (b) anatomies, we report on the left the baseline simulation (without drug), and on the right the simulation in ventricular fibrillation conditions (due to drug). The signals represent the computed ECG lead I for each simulation and the red point on the ECG curve denotes the time in which the 3D images are taken.
Fig. 4
Fig. 4. Comparison of biomarkers from 3D and 0D simulations to assess proarrhythmic risk.
The top panels show a comparison of ΔQT and ΔAPD for males (a) and females (b). The bottom panels illustrate the relationship between ΔQT and qNet for males (c) and females (d). Data points are colored according to the cellular type: endocardial (Endo cell), mid-myocardial (Mid cell) and epicardial (Epi cell) types. Average represents the average of the three cellular types. Linear regression lines for each cell type indicate the general trend, and corresponding R2 scores are reported in the legends. The shaded areas mark the low, intermediate, and high-risk regions.
Fig. 5
Fig. 5. Comparison of two cases with similar action potentials leading to different ECG outcomes.
These cases correspond to the following choices of the input parameters (see Eq. (1)): x = [1.00, 0.44, 1.00, 1.00, 0.45, 0.55, 1.00] and x = [0.94, 0.42, 0.90, 0.44, 0.63, 0.42, 0.91], for Case 1 and Case 2, respectively. Action potentials in (a, b) with abnormal behavior of the mid cell, are obtained from the last 3 beats of the 0D model (serving as initialization of the 3D simulation). However, the ECGs show different responses: (c) presents QT prolongation (170 ms) and ST elevation, while (d) manifests ventricular fibrillation. This illustrates that very similar cellular-level events can produce different effects on overall cardiac electrophysiological function.
Fig. 6
Fig. 6. Confusion matrices of classifiers.
Plots (a, b) show the results for males and females, respectively. True positives (negatives) represent the number of correctly predicted positive (negative) cases. False positives (negatives) indicate the number of incorrect positive (negative) predictions.
Fig. 7
Fig. 7. Comparison of ΔQT predictions between the simulator and emulators.
Both for males (a) and females (b), the x-axis represents the ΔQT values computed with the simulator and the y-axis the corresponding predictions from the emulator. The close alignment along the diagonal indicates strong agreement between the simulator and emulator predictions.
Fig. 8
Fig. 8. First (S1) and total (ST) Sobol’ indices from the GSA on the influence of ionic channel blockades on ΔQT predictions.
The top plots show the influence on the predicted ΔQT for males (a) and females (b). The bottom plots illustrate the influence in determining if the QT prolongation is of high-risk level for males (c) and females (d). Each bar represents the impact of a specific ionic channel blockade, highlighting channels that most affect QT prolongation and high-risk outcomes.
Fig. 9
Fig. 9. Application of the emulators to predict C-ΔQT response for dofetilide.
Results in (a) are obtained from the same anatomy used to train the emulators, while different anatomies are considered in (b). ΔΔQTc clinical, ΔQT simulated and ΔQT emulated as a function of plasma concentration. The grey dots denote the observed ΔΔQTc with respect to plasma concentration for each measurement taken in the clinical trial extracted from Darpo et al. (2015). The magnified region in plot (b) highlights six dashed lines, three per sex, corresponding to the three distinct anatomies considered.
Fig. 10
Fig. 10. Comparison of ΔΔQTc clinical, ΔQT simulated and ΔQT emulated as a function of plasma concentration for different drugs.
Plot (a) shows the results for moxifloxacin, plot (b) for ondansetron, plot (c) for dofetilide, and plot (d) for verapamil. The grey dots denote the observed ΔΔQTc with respect to plasma concentration for each measurement taken in the clinical trial extracted from Darpo et al. (2015) and Vicente et al. (2019).
Fig. 11
Fig. 11. Application of the emulators to predict C-ΔQT response for verapamil with input data from three different sources,,.
The emulated ΔQT values are shown as a function of plasma concentration.

References

    1. National Health Service. Arrhythmia (2021). https://www.nhs.uk/conditions/arrhythmia/. Accessed July 31, 2024.
    1. Cubeddu, L. QT Prolongation and Fatal Arrhythmias: A Review of Clinical Implications and Effects of Drugs. American journal of therapeutics10, 452–7 (2003). - PubMed
    1. Sager, P. T., Gintant, G., Turner, J. R., Pettit, S. & Stockbridge, N. Rechanneling the cardiac proarrhythmia safety paradigm: A meeting report from the cardiac safety research consortium. American Heart Journal167, 292–300 (2014). - PubMed
    1. Gintant, G., Sager, P. T. & Stockbridge, N. Evolution of strategies to improve preclinical cardiac safety testing. Nature Reviews Drug Discovery15, 457–471 (2016). - PubMed
    1. Kaye, G. & Lemery, R.Fast Facts: Cardiac Arrhythmias (S. Karger AG, 2018).

LinkOut - more resources