

Entropy of difference works similarly to permutation entropy for the assessment of anesthesia and sleep EEG despite the lower computational effort
- PMID: 39725813
- PMCID: PMC12304019
- DOI: 10.1007/s10877-024-01258-8
Entropy of difference works similarly to permutation entropy for the assessment of anesthesia and sleep EEG despite the lower computational effort
Abstract
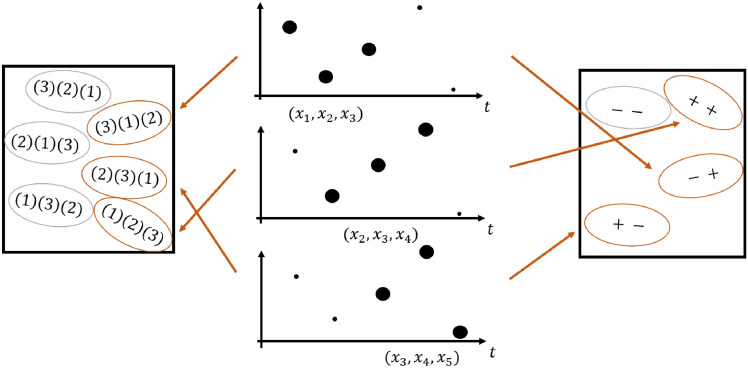
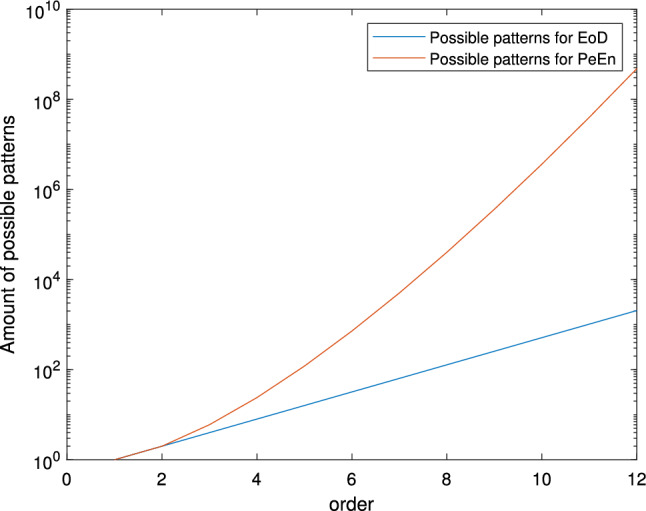
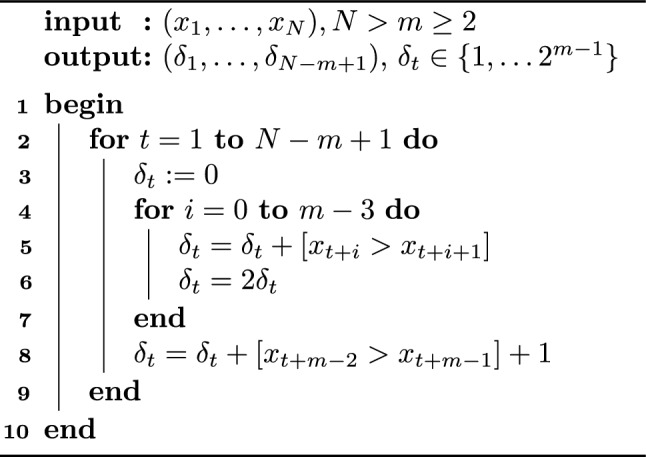
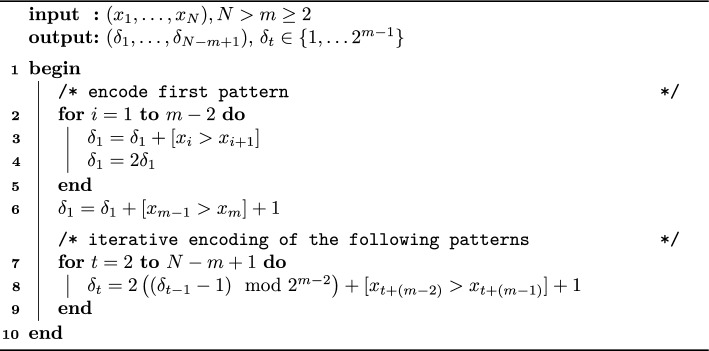
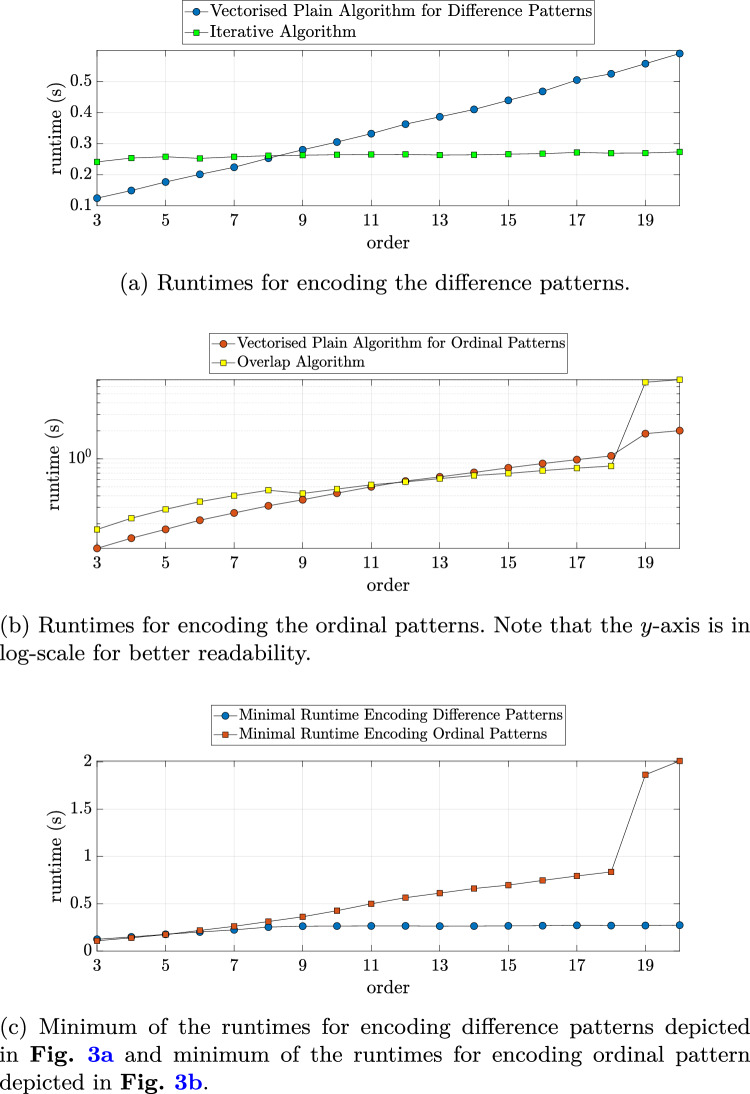
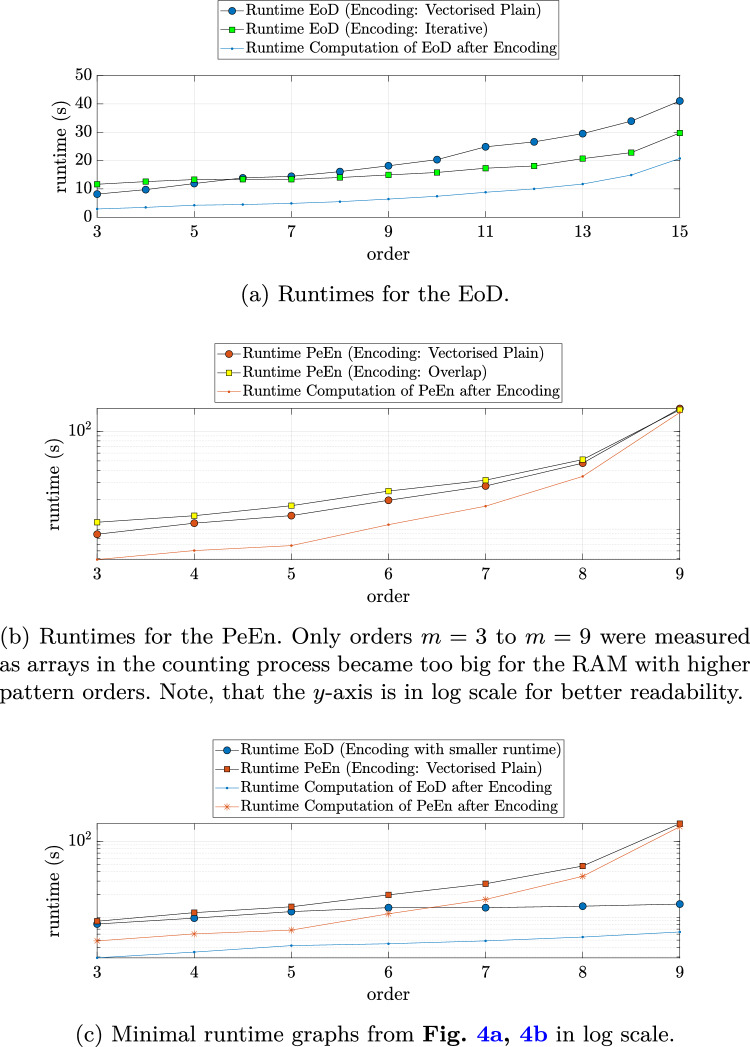
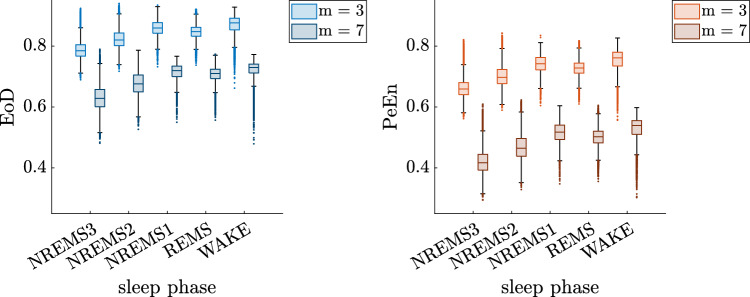
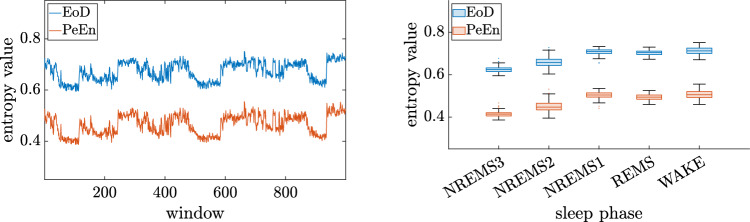
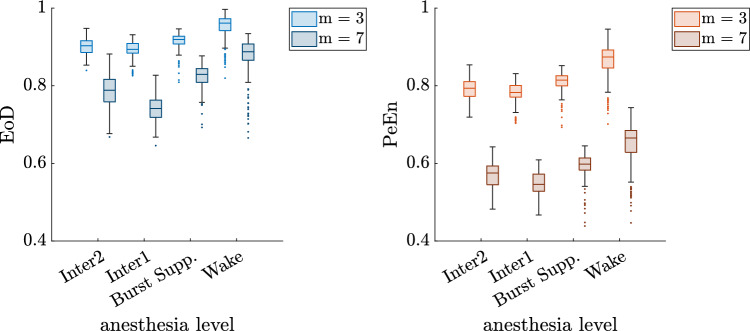
EEG monitoring during anesthesia or for diagnosing sleep disorders is a common standard. Different approaches for measuring the important information of this biosignal are used. The most often and efficient one for entropic parameters is permutation entropy as it can distinguish the vigilance states in the different settings. Due to high calculation times, it has mostly been used for low orders, although it shows good results even for higher orders. Entropy of difference has a similar way of extracting information from the EEG as permutation entropy. Both parameters and different algorithms for encoding the associated patterns in the signal are described. The runtimes of both entropic measures are compared, not only for the needed encoding but also for calculating the value itself. The mutual information that both parameters extract is measured with the AUC for a linear discriminant analysis classifier. Entropy of difference shows a smaller calculation time than permutation entropy. The reduction is much larger for higher orders, some of them can even only be computed with the entropy of difference. The distinguishing of the vigilance states between both measures is similar as the AUC values for the classification do not differ significantly. As the runtimes for the entropy of difference are smaller than for the permutation entropy, even though the performance stays the same, we state the entropy of difference could be a useful method for analyzing EEG data. Higher orders of entropic features may also be investigated better and more easily.
Keywords: Anesthesia; Electroencephalogram; Entropy of difference; Monitoring; Permutation entropy.
© 2024. The Author(s).
Conflict of interest statement
Declarations. Conflict of interest: Drs. Kreuzer and Schneider are co-inventors on several patents related to intraoperative EEG analysis owned by Columbia and TUM.
Figures
Similar articles
-
The Black Book of Psychotropic Dosing and Monitoring.Psychopharmacol Bull. 2024 Jul 8;54(3):8-59. Psychopharmacol Bull. 2024. PMID: 38993656 Free PMC article. Review.
-
Short-Term Memory Impairment.2024 Jun 8. In: StatPearls [Internet]. Treasure Island (FL): StatPearls Publishing; 2025 Jan–. 2024 Jun 8. In: StatPearls [Internet]. Treasure Island (FL): StatPearls Publishing; 2025 Jan–. PMID: 31424720 Free Books & Documents.
-
Antidepressants for pain management in adults with chronic pain: a network meta-analysis.Health Technol Assess. 2024 Oct;28(62):1-155. doi: 10.3310/MKRT2948. Health Technol Assess. 2024. PMID: 39367772 Free PMC article.
-
Systemic pharmacological treatments for chronic plaque psoriasis: a network meta-analysis.Cochrane Database Syst Rev. 2021 Apr 19;4(4):CD011535. doi: 10.1002/14651858.CD011535.pub4. Cochrane Database Syst Rev. 2021. Update in: Cochrane Database Syst Rev. 2022 May 23;5:CD011535. doi: 10.1002/14651858.CD011535.pub5. PMID: 33871055 Free PMC article. Updated.
-
Systemic pharmacological treatments for chronic plaque psoriasis: a network meta-analysis.Cochrane Database Syst Rev. 2017 Dec 22;12(12):CD011535. doi: 10.1002/14651858.CD011535.pub2. Cochrane Database Syst Rev. 2017. Update in: Cochrane Database Syst Rev. 2020 Jan 9;1:CD011535. doi: 10.1002/14651858.CD011535.pub3. PMID: 29271481 Free PMC article. Updated.
Cited by
-
EEG features associated with Alzheimer's disease and Frontotemporal dementia are not reflected by processed indices used in anesthesia monitoring.J Clin Monit Comput. 2025 Aug;39(4):681-696. doi: 10.1007/s10877-025-01294-y. Epub 2025 Apr 21. J Clin Monit Comput. 2025. PMID: 40259140 Free PMC article.
References
-
- Rampil I. A primer for EEG signal processing in anesthesia. Anesthesiology. 1998;89:980–1002. - PubMed
-
- Viertio-Oja H, et al. Description of the entropy algorithm as applied in the datex-ohmeda S/5 entropy module. Acta Anaesthesiol Scand. 2004;48:154–61. - PubMed
-
- Drover D, Ortega HR. Patient state index. Best Pract Res Clin Anaesthesiol. 2006;20:121–8. - PubMed
-
- Jensen E, et al. Monitoring hypnotic effect and nociception with two eeg-derived indices, qcon and qnox, during general anaesthesia. Acta Anaesthesiol Scand. 2014;58:933–41. - PubMed
MeSH terms
LinkOut - more resources
Full Text Sources
Medical
Research Materials
