. 2024 Dec 27;82(1):16.
doi: 10.1007/s00018-024-05525-4.

Retinoic acid drives surface epithelium fate determination through the TCF7-MSX2 axis

Affiliations

Retinoic acid drives surface epithelium fate determination through the TCF7-MSX2 axis

Huaxing Huang et al. Cell Mol Life Sci. .

Abstract

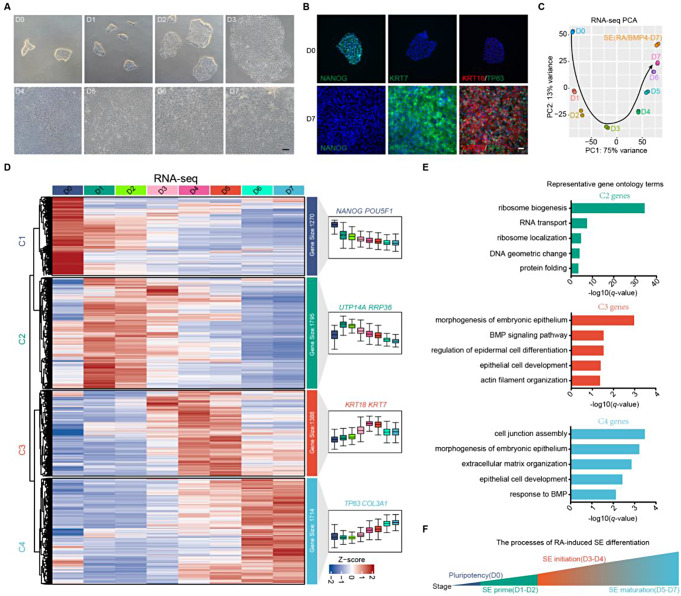
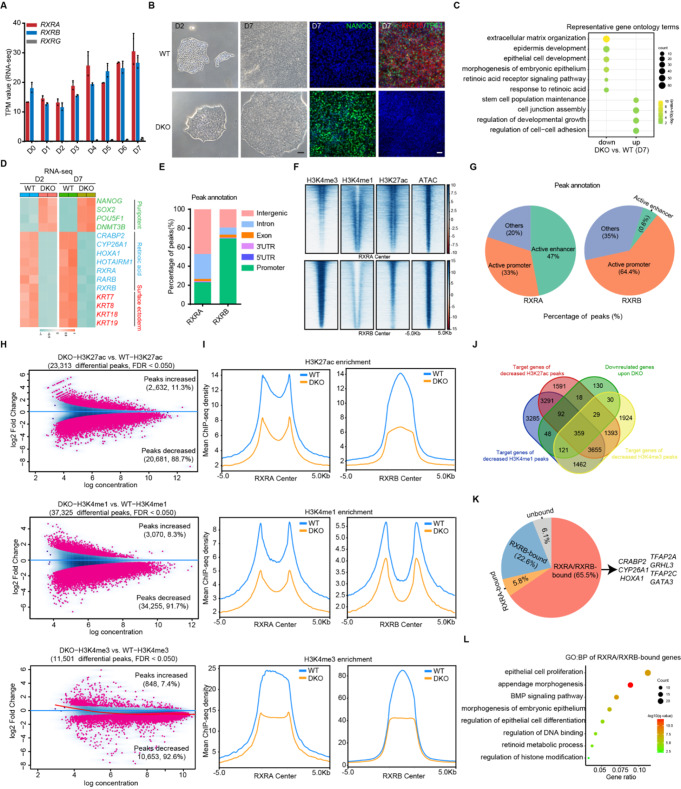
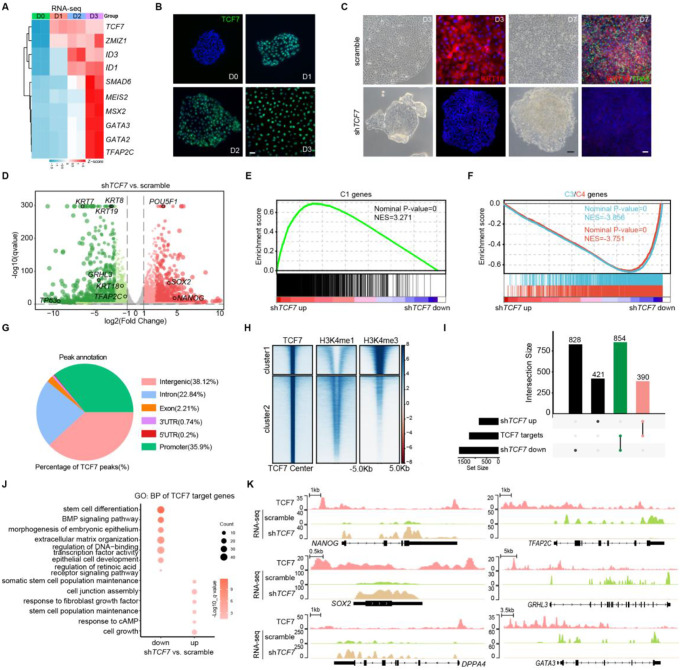
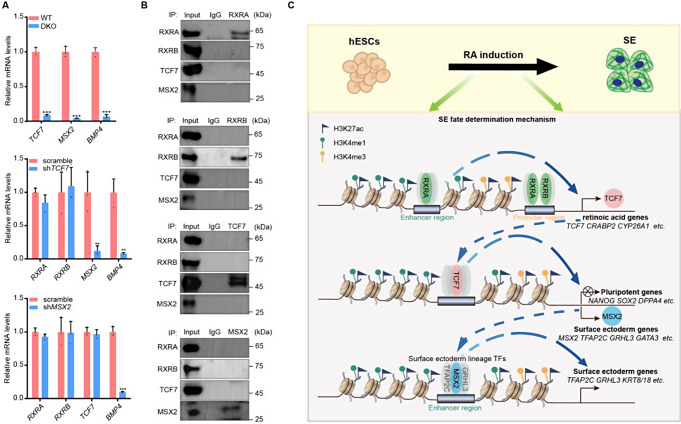
Understanding how embryonic progenitors decode extrinsic signals and transform into lineage-specific regulatory networks to drive cell fate specification is a fundamental, yet challenging question. Here, we develop a new model of surface epithelium (SE) differentiation induced by human embryonic stem cells (hESCs) using retinoic acid (RA), and identify BMP4 as an essential downstream signal in this process. We show that the retinoid X receptors, RXRA and RXRB, orchestrate SE commitment by shaping lineage-specific epigenetic and transcriptomic landscapes. Moreover, we find that TCF7, as a RA effector, regulates the transition from pluripotency to SE initiation by directly silencing pluripotency genes and activating SE genes. MSX2, a downstream activator of TCF7, primes the SE chromatin accessibility landscape and activates SE genes. Our work reveals the regulatory hierarchy between key morphogens RA and BMP4 in SE development, and demonstrates how the TCF7-MSX2 axis governs SE fate, providing novel insights into RA-mediated regulatory principles.

Keywords: MSX2; Retinoic acid; Surface epithelium; TCF7.


Conflict of interest statement

Declarations. Ethical approval: Not applicable. Consent to participate: Not applicable. Consent for publication: The authors declare their consent for this publication. Conflict of interest: The authors declare that they have no competing interests.

Figures

Fig. 1
Fig. 1
RA induces SE commitment. A Phase contrast images of the differentiating hESCs during 7 days of RA induction. Scale bar, 100 μm. B Immunostaining for NANOG, KRT7, KRT18, and TP63 in the differentiated cells on D0 and D7. Scale bar, 100 μm. C PCA of RNA-seq data of cells at each time point during RA-driven differentiation and SE cells. D Heatmap of expression changes of the genes that were differentially expressed between at least two time points during 7 days of RA induction. These differential genes were clustered into four groups based on different variation tendency over time. The color bar shows the relative expression value (Z score of TPM [transcripts per kilobase of exon model per million mapped reads]) from the RNA-seq data. E Representative GO terms (biological process) identified from the cluster II, III, and IV genes. F Schematic diagram of RA-induced SE differentiation
Fig. 2
Fig. 2
RA drives SE fate determination by activating BMP4 signaling. A Heatmap of the expression changes of BMP family members during SE differentiation. The color bar shows the expression value (TPM) from the RNA-seq. B Immunostaining of BMP4 during 7 days of differentiation. Scale bar, 100 μm. C Phase contrast images and immunostaining for pSMAD1/5/8, KRT18, and TP63 in scrambled shRNA- and shBMP4-treated hESCs after seven days of differentiation. Scale bar, 100 μm. D qRT-PCR analysis of representative genes in scrambled shRNA- and shBMP4-treated hESCs after seven days of differentiation. qRT-PCR values were normalized to the values in scrambled shRNA group. Values are presented as means ± SD (n = 3 biological replicates; **P < 0.01; ***P < 0.001 t test). E Heatmap showing expression levels of representative genes in shBMP4- and scrambled shRNA-treated hESCs after seven days of differentiation. F GO (biological process) analysis of the downregulated genes upon BMP4 knockdown. G Scatterplot of differential accessibility in shBMP4- versus scrambled shRNA-treated hESCs after seven days of differentiation. Sites identified with significant differential accessibility are highlighted in color (red, peaks increased; green, peaks decreased). H Transcription factor motif enrichment in the regions with increased (left) or decreased (right) accessibility in shBMP4- versus scrambled shRNA-treated hESCs after seven days of differentiation. I Genome browser tracks comparing ATAC-seq signal across NANOG, POU5F1, SOX2, KRT8/18, KRT7, and TP63 loci of scrambled shRNA- or shBMP4-treated hESCs after seven days of differentiation
Fig. 3
Fig. 3
RXRA/B primes SE epigenetic and transcriptomic landscape. A RNA-seq analysis of RXRA, RXRB, and RXRG expression during seven days of RA induction. B Left two panels, phase contrast images of the differentiating hESCs on D2 and D7. Scale bar, 100 μm. Right two panels, immunofluorescence staining of NANOG, KRT18, and TP63 in WT and RXRA/B DKO cells after seven days of differentiation. Scale bar, 100 μm. C Representative GO terms (biological processes) identified from the genes highly expressed in WT or RXRA/B DKO cells after seven days of differentiation. D Heatmap of expression of pluripotency, RA and SE-related genes in WT and RXRA/B DKO cells after two days or seven days of differentiation. E Histogram showing the distribution patterns of RXRA and RXRB peaks in the differentiated cells on D2. F Heatmaps of binding signals of H3K4me3, H3K4me1, H3K27ac, and ATAC-seq at the center of RXRA or RXRB peaks. G Pie chart showing the percentage of RXRA or RXRB peaks located in active enhancers or active promoters. H Scatterplot of differential H3K27ac, H3K4me1, and H3K4me3 peaks in WT versus RXRA/B DKO cells after two days of differentiation. Sites identified as differentially bound with significance (FDR < 0.05) are shown in red. I Metaplots of average H3K27ac, H3K4me1, and H3K4me3 density around RXRA or RXRB peaks in WT and RXRA/B DKO-differentiated cells on D2. J Venn diagram showing the overlap among downregulated genes and the target genes of decreased H3K27ac, H3K4me1, and H3K4me3 signals in differentiated WT versus RXRA/B DKO cells on D2. K Pie chart showing percentage of the overlap genes obtained from (J) with or without RXRA and RXRB binding. L Representative GO terms (biological process) identified from the genes bound by both RXRA and RXRB obtained from (K)
Fig. 4
Fig. 4
TCF7 is required to mediate the transition from pluripotency to SE initiation. A Heatmap of the expression of the top 10 candidate transcription factors during the first three days of differentiation. B Immunostaining of TCF7 during the first three days of differentiation. Scale bar, 100 μm. C Phase contrast images and immunostaining for KRT18 and TP63 in scrambled shRNA- and shTCF7-treated hESCs after three or seven days of differentiation. Scale bar, 100 μm. D Volcano map of differentially expressed genes of shTCF7- versus scrambled shRNA-treated hESCs after seven days of differentiation. The significant DEGs (fold change ≥ 2 and q-value < 0.05) are highlighted in red (upregulated genes) or green (downregulated genes). E GSEA for Cluster I genes in the gene expression matrix of shTCF7- versus scrambled shRNA-treated hESCs after seven days of differentiation. F GSEA for Cluster III and IV genes in the gene expression matrix of shTCF7- versus scrambled shRNA-treated hESCs after seven days of differentiation. G Pie chart showing the distribution patterns of TCF7 peaks in the differentiated cells on D3. H Heatmaps of binding signals of H3K4me1 and H3K4me3 at the center of TCF7 peaks in the differentiated cells on D3. I Upset plot depicting the overlap between genes bound by TCF7 and the genes that were differentially expressed upon TCF7 depletion. J GO (biological process) analysis of the differentially expressed target genes of TCF7. K Genome browser view of TCF7 peaks and RNA-seq signal across representative loci
Fig. 5
Fig. 5
MSX2 opens chromatin and activates SE gene expression. A Volcano map of differentially expressed genes of shTCF7- versus scrambled shRNA-treated hESCs after seven days of differentiation. The candidate downstream activators of TCF7 are highlighted in dark blue text. B Genome browser view of indicated ChIP-seq and RNA-seq signal across MSX2 loci. C Immunostaining of MSX2 during the first three days of differentiation. Scale bar, 100 μm. D Phase contrast images and immunostaining for KRT18 and TP63 in scrambled shRNA- and shMSX2-treated hESCs after three or seven days of differentiation. Scale bar, 100 μm. E Heatmap of expression of represented genes in scrambled shRNA- and shMSX2-treated hESCs after three or seven days of differentiation. F GSEA for Cluster III and IV genes in the gene expression matrix of shMSX2- versus scrambled shRNA-treated hESCs after seven days of differentiation. G GSEA for downregulated genes upon BMP4 knockdown in the gene expression matrix of shMSX2- versus scrambled shRNA-treated hESCs after three or seven days of differentiation. H Pie chart showing the distribution patterns of MSX2 peaks in the differentiated cells on D3. I Heatmaps of binding signals of H3K4me1, H3K27ac, H3K4me3 and ATAC-seq at the center of MSX2 peaks in hESCs and the D3-differentiated cells. J Enrichment of TF motifs identified by HOMER at MSX2 peaks. K Heatmaps of binding signals of GRHL3, GRHL2, TFAP2C, and GATA3 at the center of MSX2 peaks. L Pie chart of the percentages of downregulated genes induced by MSX2 knockdown with or without MSX2 binding in D3-differentiated cells. M GO (biological process) analysis of the target genes of MSX2. N Left panel: Scatterplot of differential accessibility in shMSX2- versus scrambled shRNA-treated hESCs after three days of differentiation. Sites identified as significant differential accessibility are shown in color (red, peaks increased; blue, peaks decreased). Right panel: TF motif enrichment in the regions of differential accessibility in shMSX2- versus scrambled shRNA-treated hESCs after three days of differentiation. O Metaplots of average ATAC-seq density around the MSX2 target genes in shMSX2- and scrambled shRNA-treated hESCs after three days of differentiation. P Genome browser view of MSX2, ATAC-seq and RNA-seq signal across MSX2, TFAP2C, GRHL3, and KRT8/18 loci
Fig. 6
Fig. 6
The hierarchical regulation of RXRA/B, TCF7, and MSX2 during SE commitment. A qRT-PCR analysis of representative genes in the differentiated cells on D3. Top panel, WT and DKO hESCs after three days of differentiation; Middle panel, shTCF7- versus scrambled shRNA-treated hESCs after three days of differentiation; Bottom panel, shMSX2- versus scrambled shRNA-treated hESCs after three days of differentiation. qRT-PCR values were normalized to the values in control group. Values are presented as means ± SD (n = 3 biological replicates; **P < 0.01; ***P < 0.001 t test). B Co-immunoprecipitation analysis of the interactions among endogenous RXRA, RXRB, TCF7, and MSX2 in the differentiated cells on D3. C The graphical summary of the function and mechanism of the RXRA/B-TCF7-MSX2 regulatory axis in RA-driven SE commitment

Similar articles

Cited by

References

    1. Kicheva A, Briscoe J (2023) Control of tissue development by Morphogens. Annu Rev Cell Dev Biol. 10.1146/annurev-cellbio-020823-011522 - PubMed
    1. Camacho-Aguilar E, Warmflash A (2020) Insights into mammalian morphogen dynamics from embryonic stem cell systems. Curr Top Dev Biol 137:279–305. 10.1016/bs.ctdb.2019.11.010 - PMC - PubMed
    1. Sagner A, Briscoe J (2019) Establishing neuronal diversity in the spinal cord: a time and a place. Development 146. 10.1242/dev.182154 - PubMed
    1. Rogers KW, Schier AF (2011) Morphogen gradients: from generation to interpretation. Annu Rev Cell Dev Biol 27:377–407. 10.1146/annurev-cellbio-092910-154148 - PubMed
    1. Sagner A, Briscoe J (2017) Morphogen interpretation: concentration, time, competence, and signaling dynamics. Wiley Interdiscip Rev Dev Biol 6. 10.1002/wdev.271 - PMC - PubMed

MeSH terms