

Association between quantitative CT body composition analysis and prognosis in cetuximab-based first-line treatment for advanced colorectal cancer patients
- PMID: 39725871
- PMCID: PMC11670449
- DOI: 10.1186/s12885-024-13338-8
Association between quantitative CT body composition analysis and prognosis in cetuximab-based first-line treatment for advanced colorectal cancer patients
Abstract
Background: The objective of this study is to investigate the potential association between change in body composition before and after cetuximab-based therapy and the prognostic outcomes among individuals diagnosed with advanced colorectal cancer.
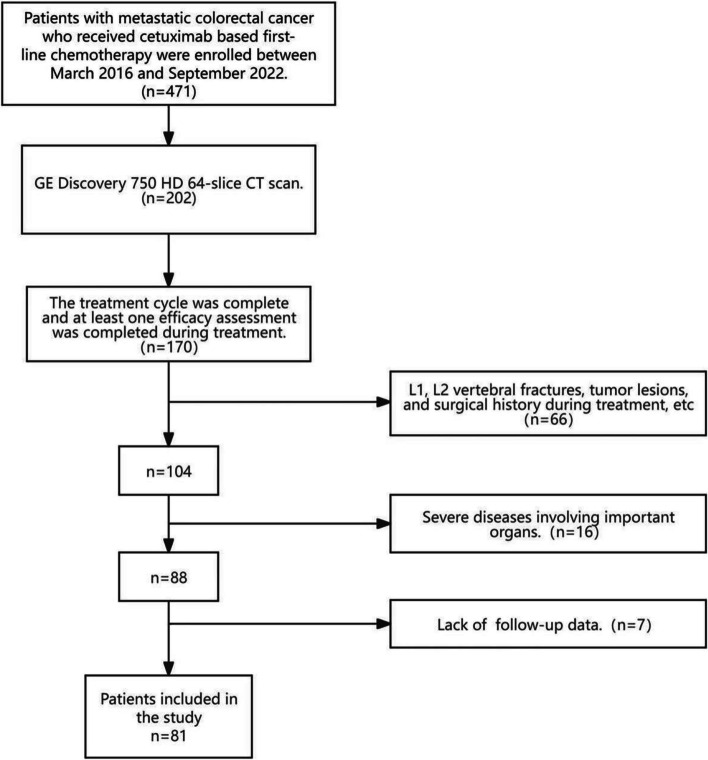
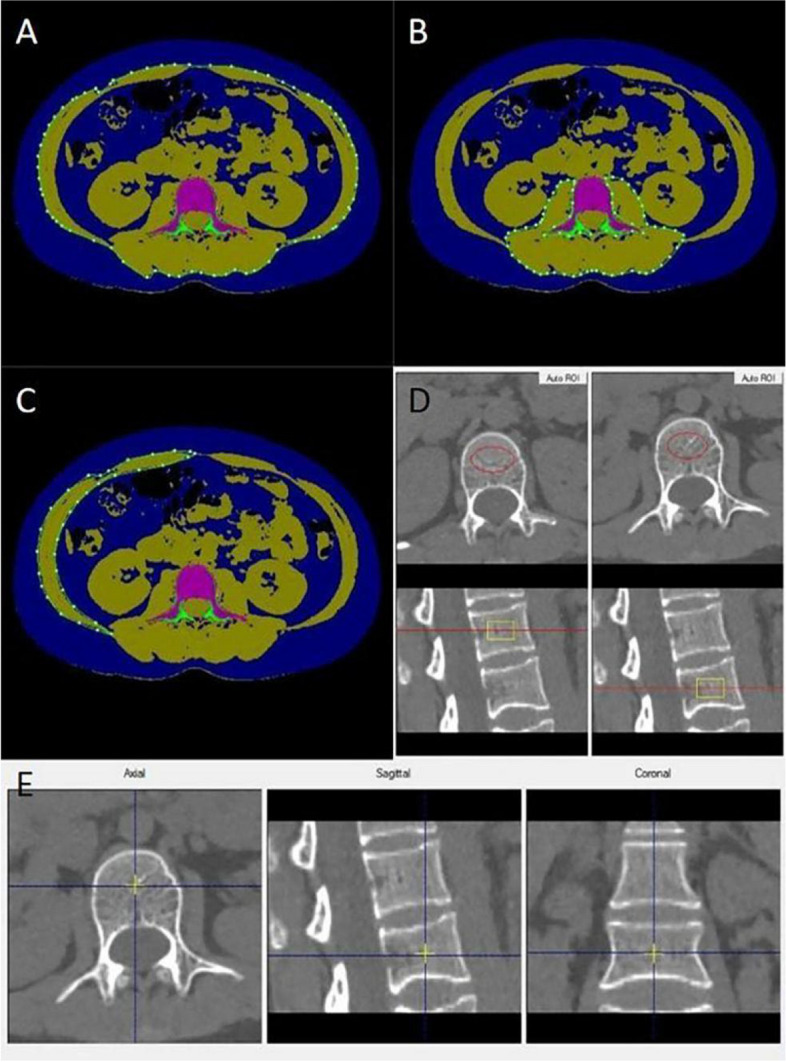
Methods: A retrospective analysis was undertaken on a cohort of 81 patients diagnosed with RAS wild-type (WT) metastatic colorectal cancer (mCRC) who were treated with cetuximab-based first-line therapy. To assess relevant body composition parameters, quantitative computed tomography (QCT) scans were conducted both before and after cetuximab treatment. These parameters encompassed measurements of visceral fat area (VFA), subcutaneous fat area (SFA), total muscle area (TMA) at the third lumbar vertebra level (L3), and bone mineral density (BMD) at the first and second vertebrae levels (L1/2). The skeletal muscle index (SMI) was subsequently calculated, and changes in parameters (∆VFA, ∆SFA, ∆SMI, ∆BMD) were standardized.
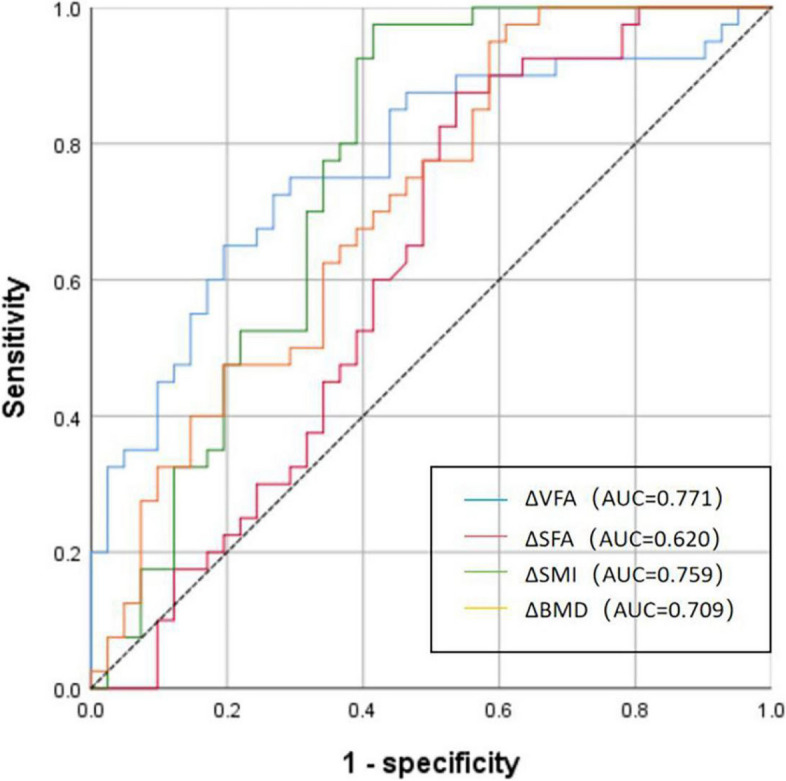
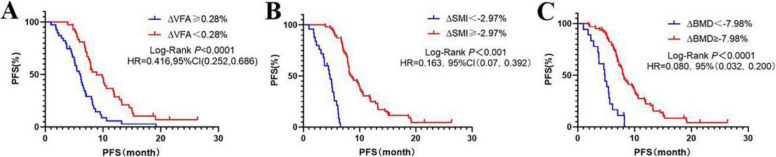
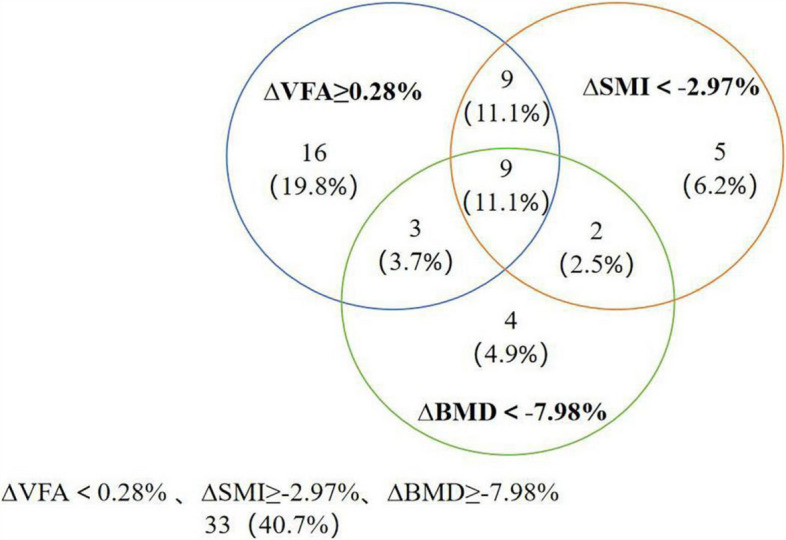
Results: The cut-off values for ∆VFA, ∆SFA, ∆SMI, and ∆BMD were 0.28%, -2.76%, -2.97%, and -7.98%, respectively. CEA, ∆VFA, ∆SMI, and ∆BMD were associated with poor outcomes of cetuximab-based first-line chemotherapy (P < 0.05). The risk of disease progression was higher when ∆VFA < 0.28%, ∆SFA < -2.76%, ∆SMI < -2.97%, and ∆BMD < -7.98%. Multivariate analysis indicated that CEA (HR: 0.396, 95% CI: 0.160-0.980, P = 0.045), ∆VFA (HR: 0.307, 95% CI: 0.145-0.651, P = 0.002), and∆SMI (HR: 0.725, 95% CI: 0.322-1.630, P = 0.001) have significant prognostic value for progression-free survival (PFS) in RAS WT mCRC patients treated with cetuximab-based first-line chemotherapy.
Conclusions: CEA, ∆VFA, and ∆SMI are independent predictors for PFS in patients with advanced colorectal cancer. High levels of CEA, ∆VFA, and low levels of ∆SMI may indicate poorer outcomes. CEA, ∆VFA, and ∆SMI can be used to predict PFS in mCRC patients receiving cetuximab-based first-line chemotherapy.
Trial registration: This study was approved by the Ethics Committee of Anhui Provincial Cancer Hospital of Anhui Medical University (Batch No:2024-ZNY-02). All subjects signed an informed consent form.
Keywords: Body composition; Cetuximab; Colorectal cancer; Quantitative computed tomography; Skeletal muscle index; Visceral fat area.
© 2024. The Author(s).
Conflict of interest statement
Declarations. Ethics approval and consent to participate: This study was approved by the Ethics Committee of Anhui Provincial Cancer Hospital of Anhui Medical University(Batch No:2024-ZNY-02). All subjects signed an informed consent form. Competing interests: The authors declare no competing interests.
Figures
References
-
- Van Cutsem E, Köhne CH, Hitre E, et al. Cetuximab and chemotherapy as initial treatment for metastatic colorectal cancer. N Engl J Med. 2009;360(14):1408–17. - PubMed
-
- Köstek O, Demircan NC, Gökyer A, et al. Skeletal muscle loss during anti-EGFR combined chemotherapy regimens predicts poor prognosis in patients with RAS wild metastatic colorectal cancer. Clin Transl Oncol. 2019;21(11):1510–7. - PubMed
-
- Argilés JM, Busquets S, Stemmler B, et al. Cancer cachexia: understanding the molecular basis. Nat Rev Cancer. 2014;14(11):754–62. - PubMed
MeSH terms
Substances
LinkOut - more resources
Full Text Sources
Medical
