. 2024 Dec 26;30(1):276.
doi: 10.1186/s10020-024-01040-1.

Hearing modulation affects Alzheimer's disease progression linked to brain inflammation: a study in mouse models

Affiliations

Hearing modulation affects Alzheimer's disease progression linked to brain inflammation: a study in mouse models

Yoo-Seung Ko et al. Mol Med. .

Abstract

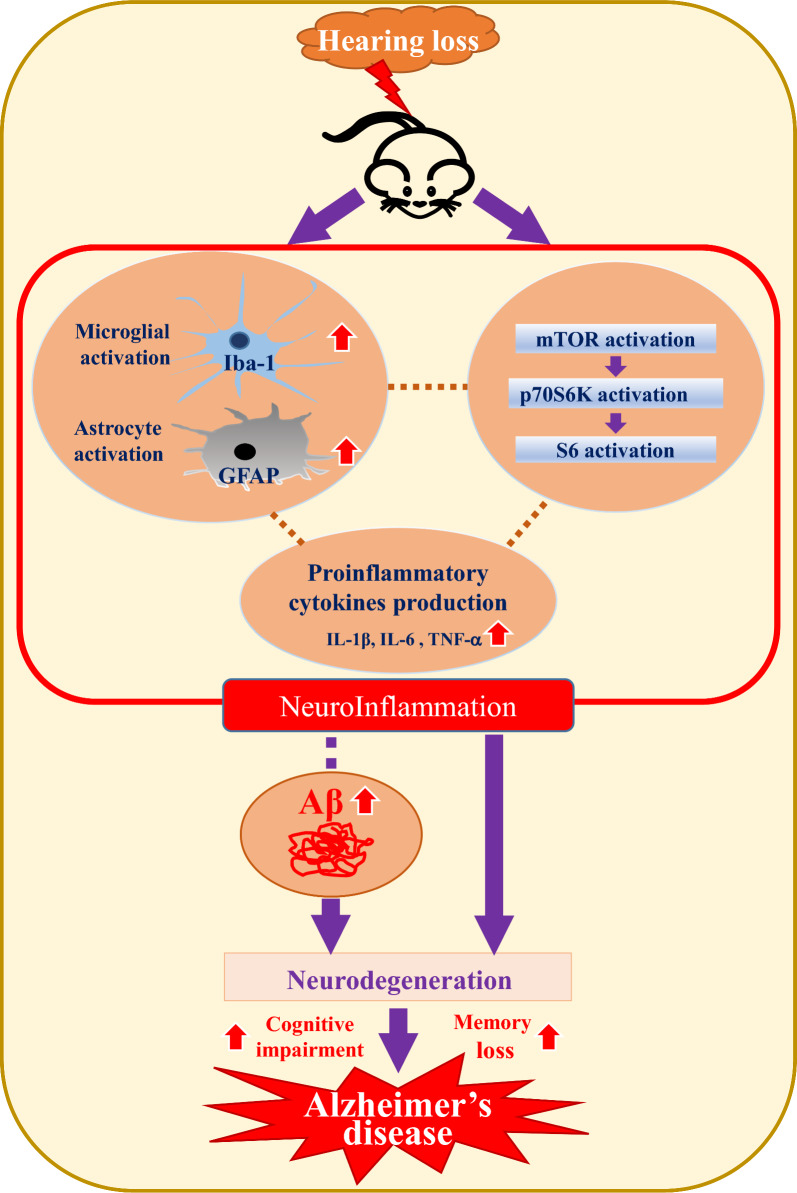
Background: Recent studies have identified hearing loss (HL) as a primary risk factor for Alzheimer's disease (AD) onset. However, the mechanisms linking HL to AD are not fully understood. This study explored the effects of drug-induced hearing loss (DIHL) on the expression of proteins associated with AD progression in mouse models.

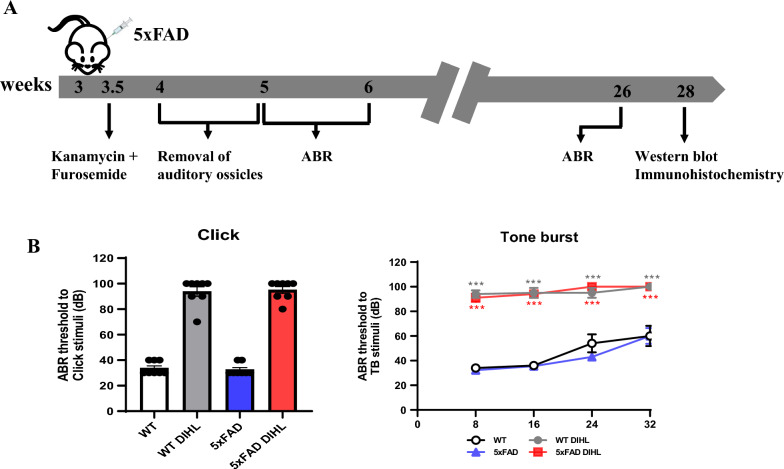
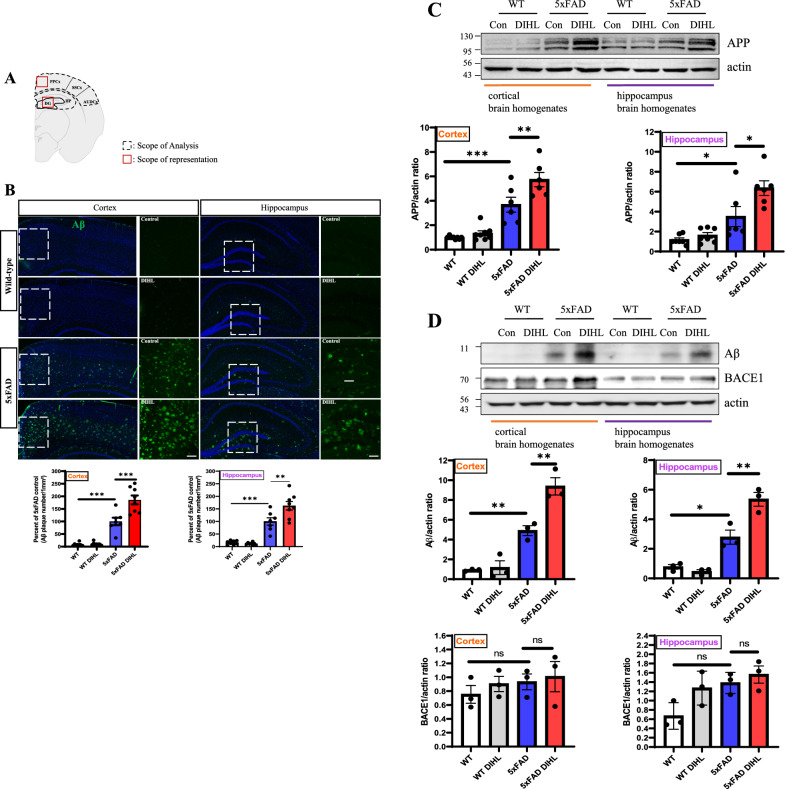
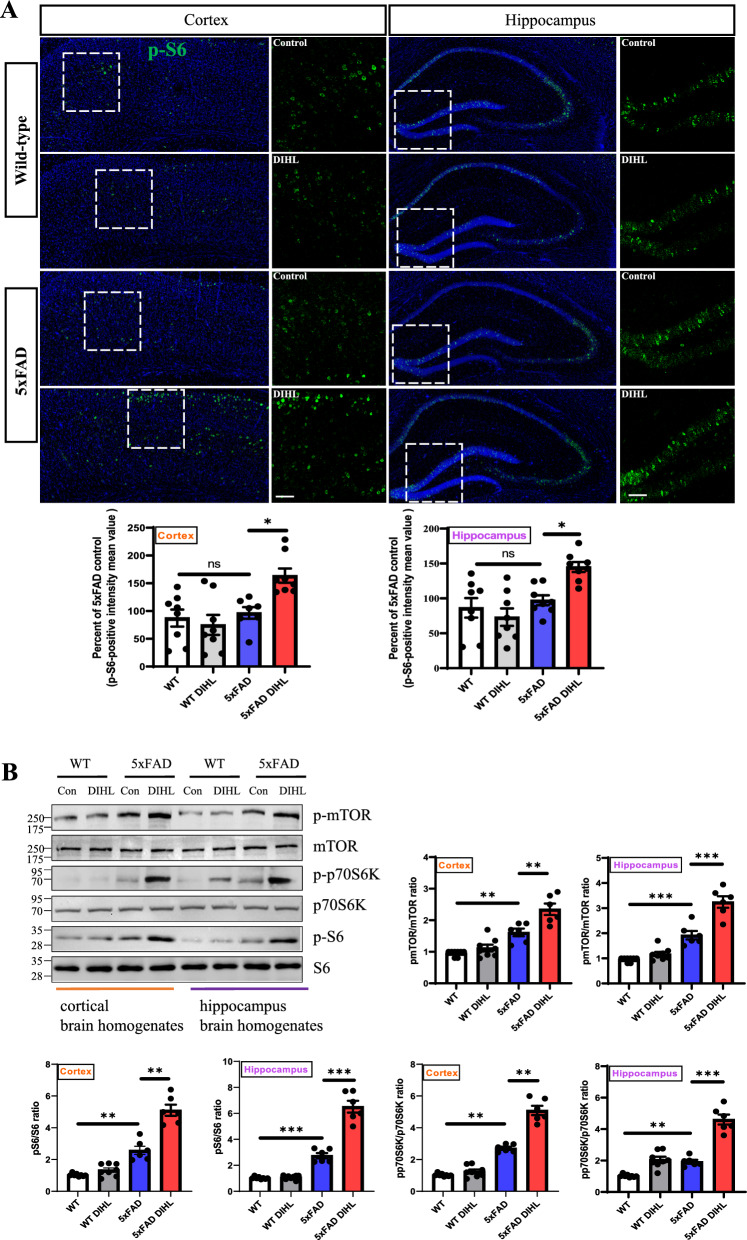
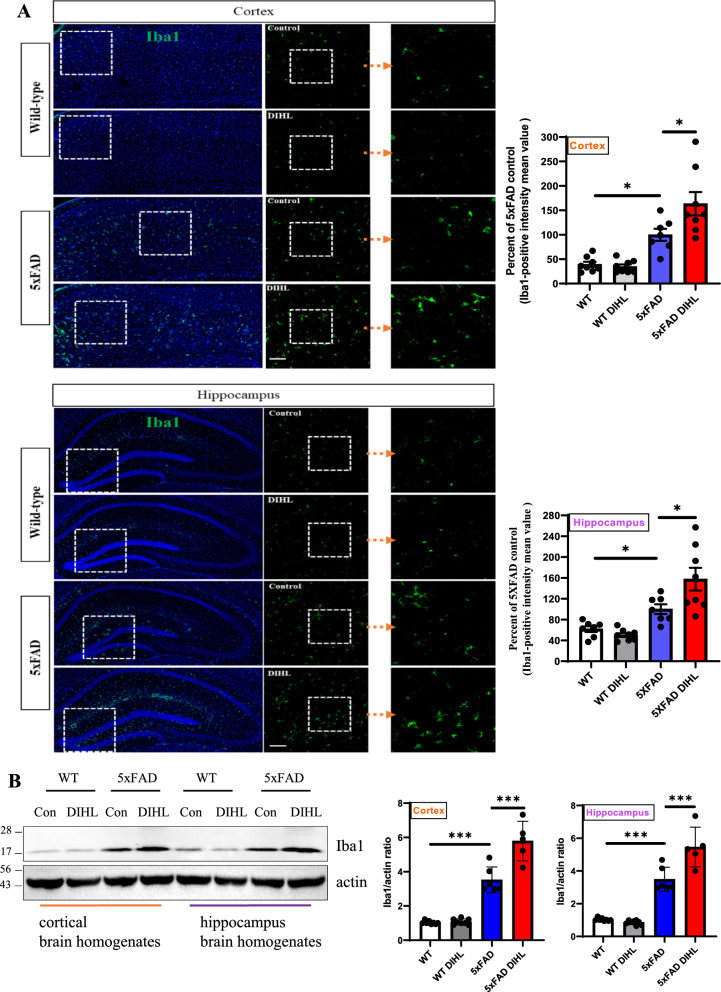
Methods: DIHL was induced in 5xFAD and Tg2576 mice aged 3 to 3.5 weeks using kanamycin (700 mg/kg, subcutaneous) and furosemide (600 mg/kg, intraperitoneal). The accumulation and expression of beta-amyloid (Aβ), ionized calcium-binding adaptor molecule 1 (Iba1), and glial fibrillary acidic protein (GFAP) were measured through immunohistochemistry and immunoblotting. Additionally, the expression of proteins involved in the mammalian target of rapamycin (mTOR) pathway, including downstream effectors p70 ribosomal S6 kinase (p70S6K) and S6, as well as proinflammatory cytokines, was analyzed.

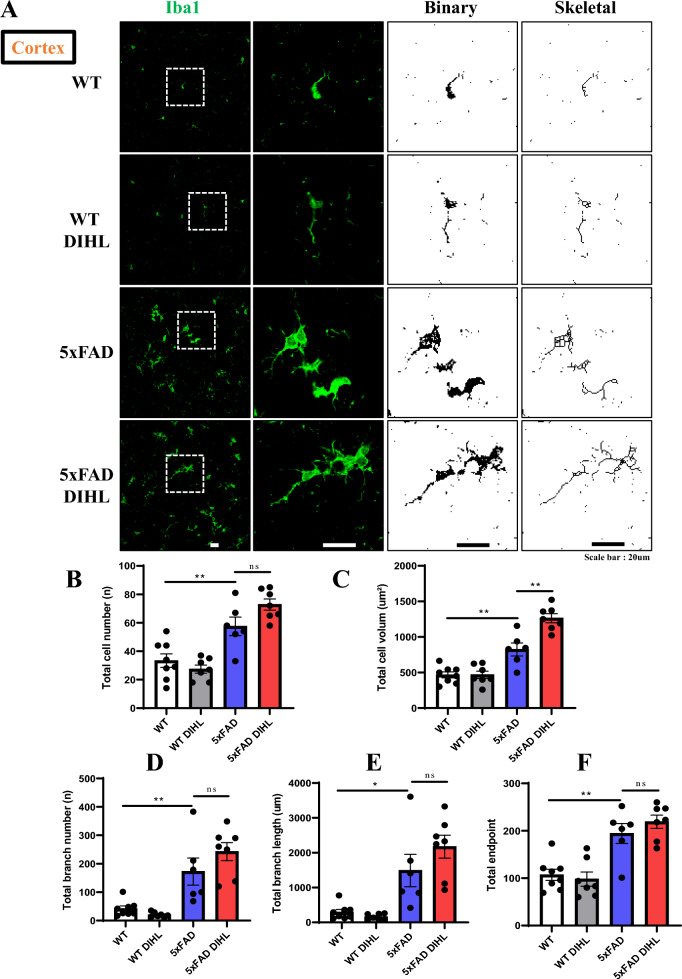
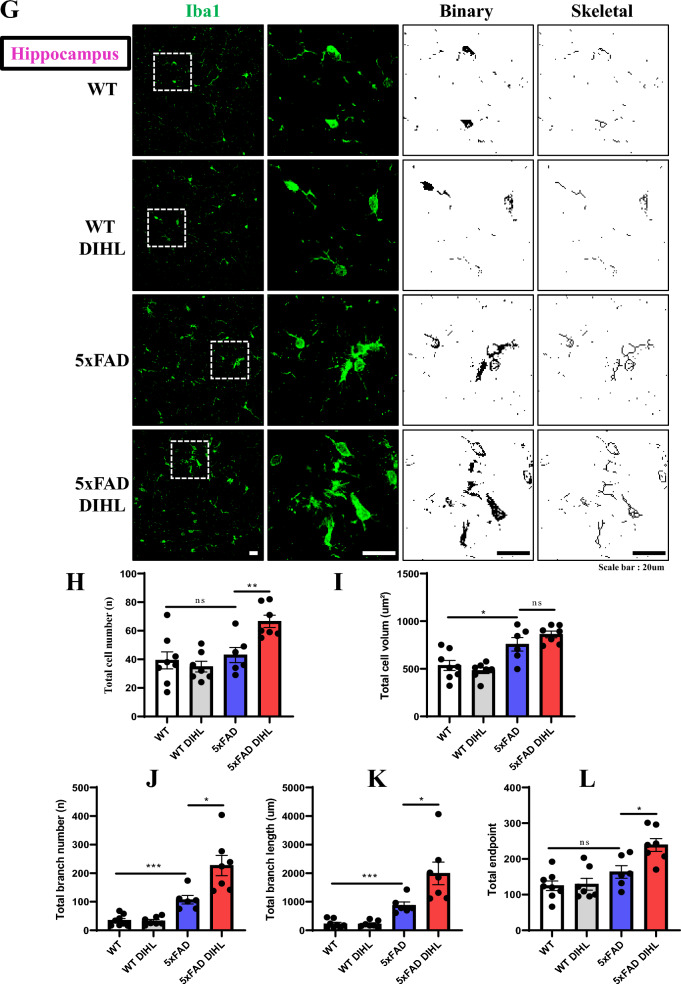
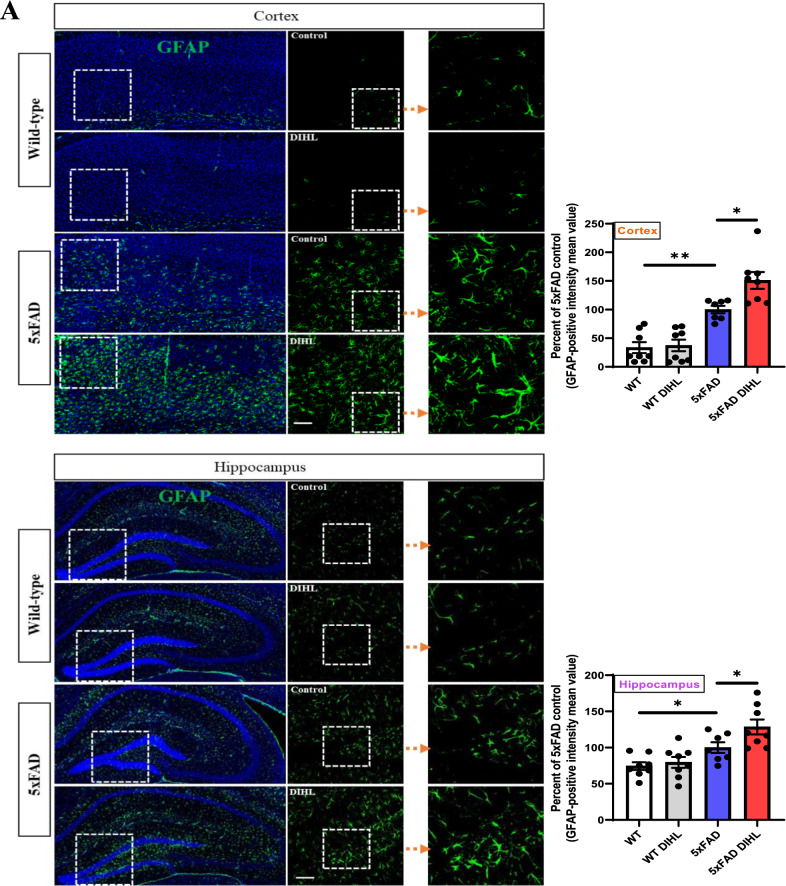
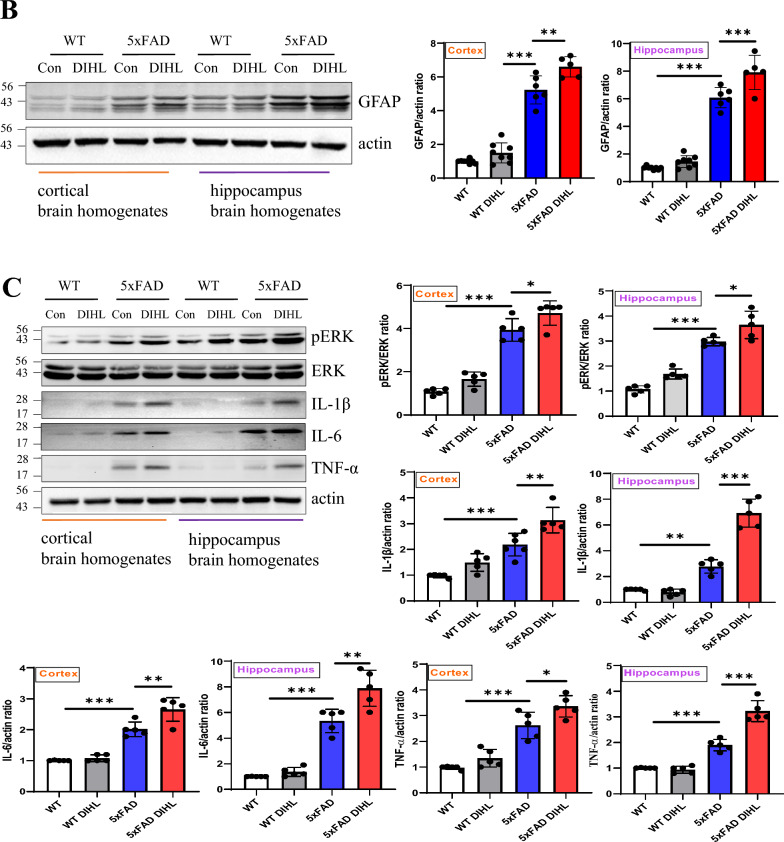
Results: Compared to control conditions, HL led to a significant increase in the accumulation of Aβ in the hippocampus and cortex. Elevated levels of neuroinflammatory markers, including Iba1 and GFAP, as well as proinflammatory cytokines such as interleukin-1β (IL-1β), IL-6, and tumor necrosis factor-alpha (TNF-α), were observed. Moreover, DIHL enhanced phosphorylation of mTOR, p70S6K, and S6, indicating activation of the mTOR pathway.

Conclusions: HL significantly increases Aβ accumulation in the brain. Furthermore, HL activates astrocytes and microglia, leading to increased neuroinflammation and thereby accelerating AD progression. These findings strongly suggest that HL contributes autonomously to neuroinflammation, highlighting the potential for early intervention in HL to reduce AD risk.

Keywords: Alzheimer’s disease; Drug-induced hearing loss; Glial fibrillary acidic protein; Iba1; Neuroinflammation.


Conflict of interest statement

Declarations. Ethics approval and consent to participate: All animal procedures were approved by the Committee on the Ethics of Animal Experiments of Chonnam National University (CNUHIACUC-21052) and were performed in accordance with national and international guidelines for animal experimentation. Consents for publication: Not applicable. Competing interests: The authors declare no competing interests.

Figures

Fig. 1
Fig. 1
Establishment of a DIHL model induced by a combination of kanamycin and furosemide injections in 5xFAD mice. HL was induced in both WT and AD mouse models. At 3–3.5 weeks of age, the DIHL model was established by administering a subcutaneous injection of kanamycin at a dosage of 700 mg/kg body weight, followed 20 mins later by an intraperitoneal injection of furosemide at 600 mg/kg body weight. A Experimental timeline of 5xFAD mice. B ABR thresholds in 5xFAD mice were evaluated using click and tone burst stimuli (n = 8). Data are presented as the mean ± SEM. Statistical significance was assessed using ANOVA with Tukey’s post hoc test, supplemented by Student’s t-test where appropriate. Significance levels are indicated as *P < 0.05, **P < 0.01, and ***P < 0.001
Fig. 2
Fig. 2
Hearing impairment significantly increases the expression of APP and the accumulation of Aβ in the brain tissue of 5xFAD mice. Brain regions for image acquisition were identified via immunohistochemical staining. Abbreviations: PPCx, posterior parietal cortex; SSCx, somatosensory cortex; AUDCx, auditory cortex; HP, hippocampus; DG, dentate gyrus (located within the hippocampus). The AUDCx was divided into dorsal, primary, and ventral regions, with only the dorsal and primary regions included in the analysis. Analyses of the specified regions and representative image locations were performed using images captured at 100 × magnification from the delineated areas at each location. A Analyzed brain regions and areas illustrated in the representative images. B Representative images showing Aβ plaque immunoreactivity in the cortex (left panel) and hippocampus (right panel) of WT and 5xFAD mice. Data are presented as the number of Aβ plaques per 1 mm2 (n = 7–8). Scale bars indicate 100 μm. C Western blot analysis of APP protein expression levels. Quantification results revealed that DIHL significantly increased APP expression in both the cortex and hippocampus of 5xFAD mice (n = 6–8). (D) Western blot analysis of Aβ and BACE1 protein expression levels. Quantification results indicated that DIHL significantly increased Aβ expression in both the cortex and hippocampus of 5xFAD mice, while BACE1 showed no significant change (n = 3). Data are presented as the mean ± SEM. Statistical significance was assessed using ANOVA with Tukey’s post hoc test, supplemented by Student’s t-test where appropriate. Significance levels are indicated as *P < 0.05, **P < 0.01, and ***P < 0.001
Fig. 3
Fig. 3
Hearing impairment increases the protein expression of the p-mTOR, p-p70S6K, and p-S6 pathways. A Representative immunofluorescence images show p-S6 expression in the cortex (left) and hippocampus (right) of WT and 5xFAD mice. Data are expressed as the intensity of p-S6-positive cells per 1 mm2 (n = 7–8). Scale bars represent 100 μm. B Western blotting was performed to analyze the protein expression levels of p-mTOR, p-p70S6K, and p-S6 (n = 6–8). Additionally, DIHL significantly increased the protein expression levels of p-mTOR, p-p70S6K, and p-S6 in both the cortex and hippocampus of 5xFAD mice. Data are presented as the mean ± SEM. Statistical significance was evaluated using ANOVA with Tukey’s post hoc test, supplemented by Student’s t-test where appropriate. Significance levels are indicated as *P < 0.05, **P < 0.01, and ***P < 0.001
Fig. 4
Fig. 4
Hearing impairment also activates microglia, and DIHL increases the protein expression of Iba1. A Representative immunofluorescence images illustrate Iba1 expression in the cortex (upper) and hippocampus (lower) of WT and 5xFAD mice. Data are expressed as the intensity of Iba1-positive cells per 1 mm2 (n = 7–8). Scale bars represent 100 μm. B Western blotting was performed to analyze the protein expression levels of Iba1 (n = 5–8). Quantification results revealed that DIHL significantly increased Iba1 expression levels in both the cortex and hippocampus of 5xFAD mice. Data are presented as the mean ± SEM. Statistical significance was evaluated using ANOVA with Tukey’s post hoc test, supplemented by Student’s t-test where appropriate. Significance levels are indicated as *P < 0.05, **P < 0.01, and ***P < 0.001
Fig. 5
Fig. 5
Effect of hearing impairments on microglial morphology. We performed a full photomicrograph analysis using ImageJ to assess microglial morphology. A Representative immunofluorescence images show photomicrographs of Iba1-stained microglia at 400 × magnification in the cortex. The Iba1 photomicrograph was converted into a binary image and subsequently transformed into a skeletal framework. Cortical analyses include the following parameters: (B) Microglial total cell number, (C) microglial total cell volume, (D) microglial branch number, (E) microglial branch length, and (F) microglial endpoint analysis. G Representative immunofluorescence images show photomicrographs of Iba1-stained microglia at 400 × magnification in the hippocampus. Hippocampal analyses include the following parameters: (H) Microglial total cell number, (I) microglial total cell volume, (J) microglial branch number, (K) microglial branch length, and (L) microglial endpoint analysis (n = 7–8). Scale bars represent 20 μm. Data are presented as the mean ± SEM. Statistical significance was evaluated using ANOVA with Tukey’s post hoc test, supplemented by Student’s t-test where appropriate. Significance levels are indicated as *P < 0.05, **P < 0.01, and ***P < 0.001
Fig. 5
Fig. 5
Effect of hearing impairments on microglial morphology. We performed a full photomicrograph analysis using ImageJ to assess microglial morphology. A Representative immunofluorescence images show photomicrographs of Iba1-stained microglia at 400 × magnification in the cortex. The Iba1 photomicrograph was converted into a binary image and subsequently transformed into a skeletal framework. Cortical analyses include the following parameters: (B) Microglial total cell number, (C) microglial total cell volume, (D) microglial branch number, (E) microglial branch length, and (F) microglial endpoint analysis. G Representative immunofluorescence images show photomicrographs of Iba1-stained microglia at 400 × magnification in the hippocampus. Hippocampal analyses include the following parameters: (H) Microglial total cell number, (I) microglial total cell volume, (J) microglial branch number, (K) microglial branch length, and (L) microglial endpoint analysis (n = 7–8). Scale bars represent 20 μm. Data are presented as the mean ± SEM. Statistical significance was evaluated using ANOVA with Tukey’s post hoc test, supplemented by Student’s t-test where appropriate. Significance levels are indicated as *P < 0.05, **P < 0.01, and ***P < 0.001
Fig. 6
Fig. 6
Hearing impairment activates astrocytes. Additionally, DIHL increases the protein expression of GFAP. A Representative immunofluorescence images of GFAP in the cortex (upper) and hippocampus (lower) of WT and 5xFAD mice are shown. Data are presented as the intensity of GFAP-positive cells per 1 mm2 (n = 7–8). Scale bars indicate 100 μm. B Western blotting was performed to analyze the protein expression levels of GFAP (n = 5–8). The quantification results showed that DIHL significantly increased GFAP expression in both the cortex and hippocampus of 5xFAD mice. C Western blotting was also used to analyze the protein expression levels of p-ERK, IL-1β, IL-6, and TNF-α (n = 5). The quantification results showed that DIHL significantly increased the levels of p-ERK, IL-1β, IL-6, and TNF-α in both the cortex and hippocampus of 5xFAD mice. Data are presented as the mean ± SEM. Statistical significance was evaluated using ANOVA with Tukey’s post hoc test, supplemented by Student’s t-test where appropriate. Significance levels are indicated as *P < 0.05, **P < 0.01, and ***P < 0.001
Fig. 6
Fig. 6
Hearing impairment activates astrocytes. Additionally, DIHL increases the protein expression of GFAP. A Representative immunofluorescence images of GFAP in the cortex (upper) and hippocampus (lower) of WT and 5xFAD mice are shown. Data are presented as the intensity of GFAP-positive cells per 1 mm2 (n = 7–8). Scale bars indicate 100 μm. B Western blotting was performed to analyze the protein expression levels of GFAP (n = 5–8). The quantification results showed that DIHL significantly increased GFAP expression in both the cortex and hippocampus of 5xFAD mice. C Western blotting was also used to analyze the protein expression levels of p-ERK, IL-1β, IL-6, and TNF-α (n = 5). The quantification results showed that DIHL significantly increased the levels of p-ERK, IL-1β, IL-6, and TNF-α in both the cortex and hippocampus of 5xFAD mice. Data are presented as the mean ± SEM. Statistical significance was evaluated using ANOVA with Tukey’s post hoc test, supplemented by Student’s t-test where appropriate. Significance levels are indicated as *P < 0.05, **P < 0.01, and ***P < 0.001
Fig. 7
Fig. 7
A representative schematic illustrating how hearing impairment worsens AD. Hearing impairment significantly increases the accumulation of Aβ. Additionally, it may activate the mTOR pathway, astrocytes, and microglia in the brain, contributing to increased neuroinflammation. This figure illustrates the potential associations between Aβ pathology, inflammation, and the mTOR pathway, highlighting their possible roles in AD progression

Similar articles

References

    1. An WL, Cowburn RF, Li L, Braak H, Alafuzoff I, Iqbal K, et al. Up-regulation of phosphorylated/activated p70 S6 kinase and its relationship to neurofibrillary pathology in Alzheimer’s disease. Am J Pathol. 2003;163(2):591–607. - PMC - PubMed
    1. Azeem A, Julleekeea A, Knight B, Sohail I, Bruyns-Haylett M, Sastre M. Hearing loss and its link to cognitive impairment and dementia. Front Dement. 2023;2:1199319. - PMC - PubMed
    1. Beckmann D, Feldmann M, Shchyglo O, Manahan-Vaughan D. Hippocampal synaptic plasticity, spatial memory, and neurotransmitter receptor expression are profoundly altered by gradual loss of hearing ability. Cereb Cortex. 2020;30(8):4581–96. - PMC - PubMed
    1. Bliss TV, Collingridge GL. A synaptic model of memory: long-term potentiation in the hippocampus. Nature. 1993;361(6407):31–9. - PubMed
    1. Blomberg R, Belting DP, Wabitsch M, Puré E. Fibroblast activation protein restrains adipogenic differentiation and regulates matrix-mediated mTOR signaling. Matrix Biol. 2019;83:60–76. - PMC - PubMed

MeSH terms

LinkOut - more resources