Comparative Study
. 2024 Dec 26;24(1):1256.
doi: 10.1186/s12870-024-05981-x.

Comparative analysis of the LEA gene family in seven Ipomoea species, focuses on sweet potato (Ipomoea batatas L.)

Affiliations
Comparative Study

Comparative analysis of the LEA gene family in seven Ipomoea species, focuses on sweet potato (Ipomoea batatas L.)

Mengqin Hu et al. BMC Plant Biol. .

Abstract

Late Embryogenesis Abundant (LEA) proteins are extensively distributed among higher plants and are crucial for regulating growth, development, and abiotic stress resistance. However, comprehensive data regarding the LEA gene family in Ipomoea species remains limited. In this study, we conducted a genome-wide comparative analysis across seven Ipomoea species, including sweet potato (I. batatas), I. trifida, I. triloba, I. nil, I. purpurea, I. cairica, and I. aquatica, identifying 73, 64, 77, 62, 70, 70, and 74 LEA genes, respectively. The LEA genes were divided into eight subgroups: LEA_1, LEA_2, LEA_3, LEA_4, LEA_5, LEA_6, SMP, and Dehydrin according to the classification of the LEA family in Arabidopsis. Gene structure and protein motif analyses revealed that genes within the same phylogenetic group exhibited comparable exon/intron structures and motif patterns. The distribution of LEA genes across chromosomes varied among the different Ipomoea species. Duplication analysis indicated that segmental and tandem duplications significantly contributed to the expansion of the LEA gene family, with segmental duplications being the predominant mechanism. The analysis of the non-synonymous (Ka) to synonymous (Ks) ratio (Ka/Ks) indicated that the duplicated Ipomoea LEA genes predominantly underwent purifying selection. Extensive cis-regulatory elements associated with stress responses were identified in the promoters of LEA genes. Expression analysis revealed that the LEA gene exhibited widespread expression across diverse tissues and showed responsive modulation to various abiotic stressors. Furthermore, we selected 15 LEA genes from sweet potatoes for RT-qPCR analysis, demonstrating that five genes responded to salt stress in roots, while three genes were responsive to drought stress in leaves. Additionally, expression changes of seven genes varied at different stages of sweet potato tuber development. These findings enhanced our understanding of the evolutionary dynamics of LEA genes within the Ipomoea genome and may inform future molecular breeding strategies for sweet potatoes.

Keywords: Ipomoea species; LEA gene family; Abiotic stress; Gene expression; Sweet potato.


Conflict of interest statement

Declarations. Ethics approval and consent to participate: The sweet potato materials used in this study were obtained from the College of Coastal Agriculture Sciences, Guangdong Ocean University, Guangdong Province, China. The collection and utilization of sweet potato materials, as well as the methods employed in this study, adhere to the guidelines and regulations set forth by relevant institutions and national and international standards. Consent to publication: Not applicable. Competing interests: The authors declare no competing interests.

Figures

Fig. 1
Fig. 1
Phylogenetic analysis of Ipomoea species and Arabidopsis LEA proteins. The proteins were classed into LEA_1, LEA_2, LEA_3, LEA_4, LEA_5, LEA_6, SMP, and Dehydrin, represented by colors such as green, orange, yellow-green, blue, dark blue, red, purple, and pink, respectively. The red star icons, yellow check marks, blue check marks, green triangles, orange stars, blue triangles, purple triangles, and red check marks indicated IbLEAs in sweet potato, I. trifida, I. triloba, I. nil, I. purpurea, I. aquatica, I. cairica, and A. thaliana, respectively
Fig. 2
Fig. 2
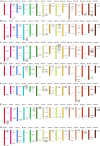
Distribution of LEA genes across the chromosomes of the seven Ipomoea species. A Distribution in sweet potato (I. batatas). B Distribution in I. trifida. C Distribution in I. triloba. D Distribution in I. nil. E Distribution in I. purpurea. F Distribution in I. cairica. G Distribution in I. aquatica
Fig. 3
Fig. 3
Gene location and collinearity analysis of the LEA genes in Ipomoea species. The genes were located on different chromosomes. Duplicated gene pairs are linked with a colored line
Fig. 4
Fig. 4
Schematic representation of syntenic genes among sweet potato (I. batatas), I. trifida, I. triloba, I. nil, I. purpurea, I. cairica, and I. aquatica. The chromosomes of the seven Ipomoea species were reordered. Grey lines in the background indicate the collinear blocks within Ipomoea genomes, with LEA gene pairs highlighted in chromatic color
Fig. 5
Fig. 5
Phylogenetic tree, gene structure and motif compositions of LEA genes in Ipomoea species. The phylogenetic tree was constructed using IQtree. Different colors represent protein motif analysis, and a number represents each motif
Fig. 6
Fig. 6
Protein-protein interaction (PPI) network of significant IbLEAs in sweet potato. Nodes represent proteins, central nodes are indicated in red, and black lines indicate interactions between nodes. The darker the color, the more important the protein in the interaction network
Fig. 7
Fig. 7
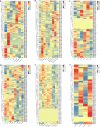
Transcriptome dataset of the IbLEA gene across various tissues of sweet potato and in response to abiotic stresses. a Expression profiles of the IbLEA gene in distinct sweet potato tissues. b Expression levels of the IbLEA gene in response to salt and drought stress. c Expression levels of the IbLEA gene under cold stress conditions. d Expression levels of the IbLEA gene under heat stress conditions. e Expression levels of the IbLEA gene following hormonal treatments. f Expression levels of the IbLEA gene under potassium deficiency
Fig. 8
Fig. 8
Expression profiles of 15 IbLEA genes across various tissues were presented. The x-axis encompasses different tissue types, including primary roots, pencil roots, and tubers of varying sizes (4 cm diameter - DR4, 8 cm diameter - DR8, and 13 cm diameter - DR13), as well as tender stems, old stems, tender leaves, old leaves, flower buds, and flowers. The y-axis denotes the relative expression levels of IbLEA genes. Significant differences, indicated by letters a, b, c, etc., are reported at the p < 0.05 level and were determined using one-way ANOVA
Fig. 9
Fig. 9
Changes in the expression levels of 15 IbLEA genes in different tissues under salt and drought treatments. The letters of a, b, c, etc., indicate significant differences at p < 0.05, as determined by one-way ANOVA with SPSS single-factor tests. a Expression of 15 IbLEA genes in leaves under salt and drought stress. b Expression of 15 IbLEA genes in fibrous roots under salt and drought stress

Similar articles

Cited by

References

    1. Gechev T, Petrov V. Reactive Oxygen Species and Abiotic Stress in Plants. Int J Mol Sci. 2020;21(20):7433. - PMC - PubMed
    1. Ahuja I, de Vos RC, Bones AM, Hall RD. Plant molecular stress responses face climate change. Trends Plant Sci. 2010;15(12):664–74. - PubMed
    1. Nykiel M, Gietler M, Fidler J, Prabucka B, Labudda M. Abiotic Stress Signaling and Responses in Plants. Plants (Basel). 2023;12(19):3405. - PMC - PubMed
    1. Shah WH, Rasool A, Saleem S, Mushtaq NU, Tahir I, Hakeem KR, Rehman RU. Understanding the integrated pathways and mechanisms of transporters, protein kinases, and transcription factors in plants under salt stress. Int J Genomics. 2021;2021:5578727. - PMC - PubMed
    1. Campo S, Baldrich P, Messeguer J, Lalanne E, Coca M, San Segundo B. Overexpression of a calcium-dependent protein kinase confers salt and drought tolerance in rice by preventing membrane lipid peroxidation. Plant Physiol. 2014;165(2):688–704. - PMC - PubMed

Publication types

Substances

LinkOut - more resources