

Integrated proteomics and metabolomics network analysis across different delivery modes in human pregnancy: a pilot study
- PMID: 39725908
- PMCID: PMC11674393
- DOI: 10.1186/s12884-024-07097-4
Integrated proteomics and metabolomics network analysis across different delivery modes in human pregnancy: a pilot study
Abstract
Background: Delivery mode has been linked to child health, e.g., allergic disease. However, it remains unclear whether protein and metabolite differences across different delivery modes may underlie child development.
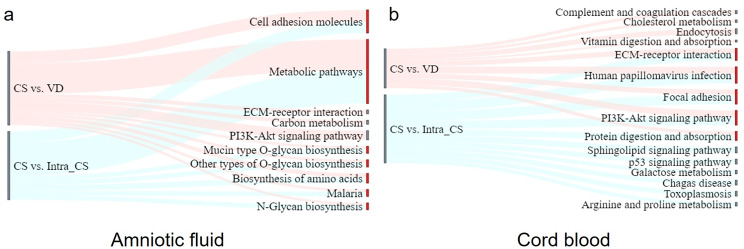
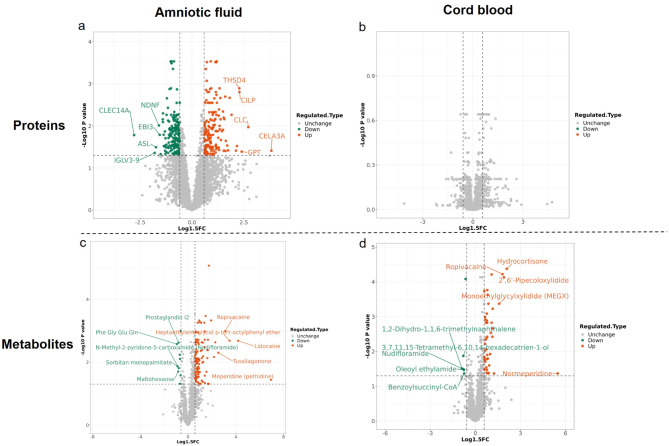
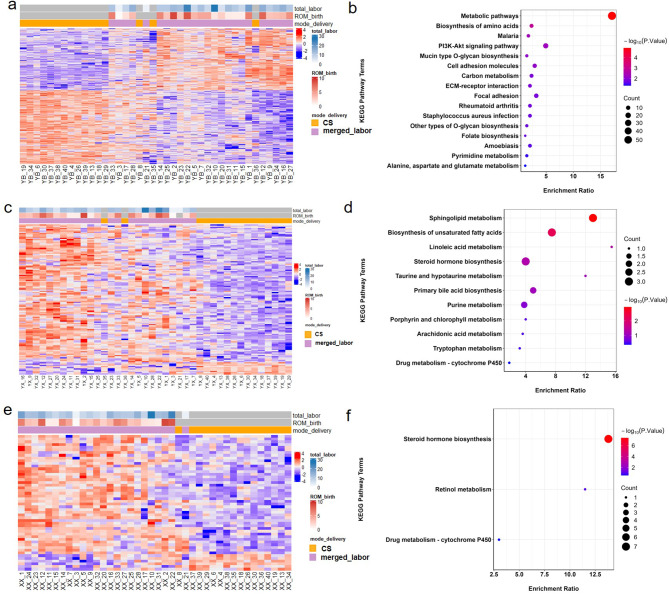
Methods: A cohort comprising 16 spontaneous onset vaginal delivery (VD), 16 prelabor cesarean delivery on maternal request (CS), and 8 intrapartum cesarean section (Intra_CS) women were analyzed using label-free proteomic and untargeted metabolomics assays on amniotic fluid and cord blood samples, respectively. We used weighted gene co-expression network analyses (WGCNA) to identify modules of highly correlated proteins or metabolites that associated with delivery modes and related clinical traits. KEGG enrichment analyses were performed to investigate the biological function of the identified modules. Integrative multiomics analysis was employed to examine the biological interplay between proteomic and metabolic interactions.
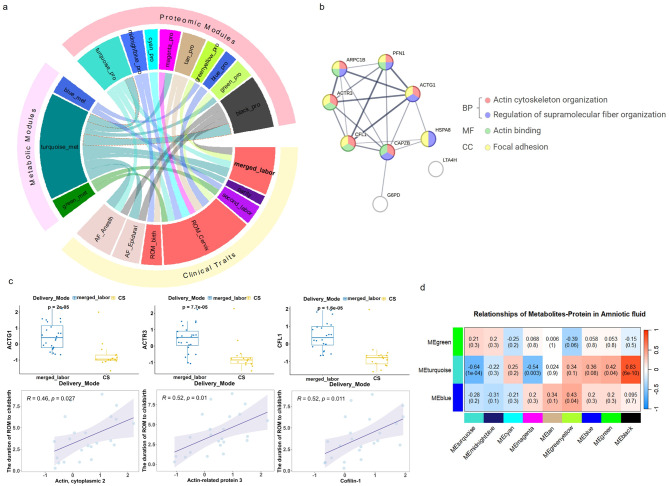
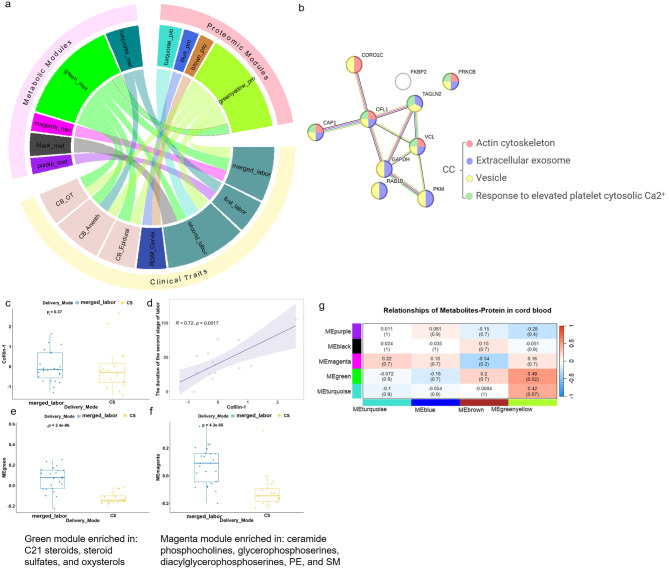
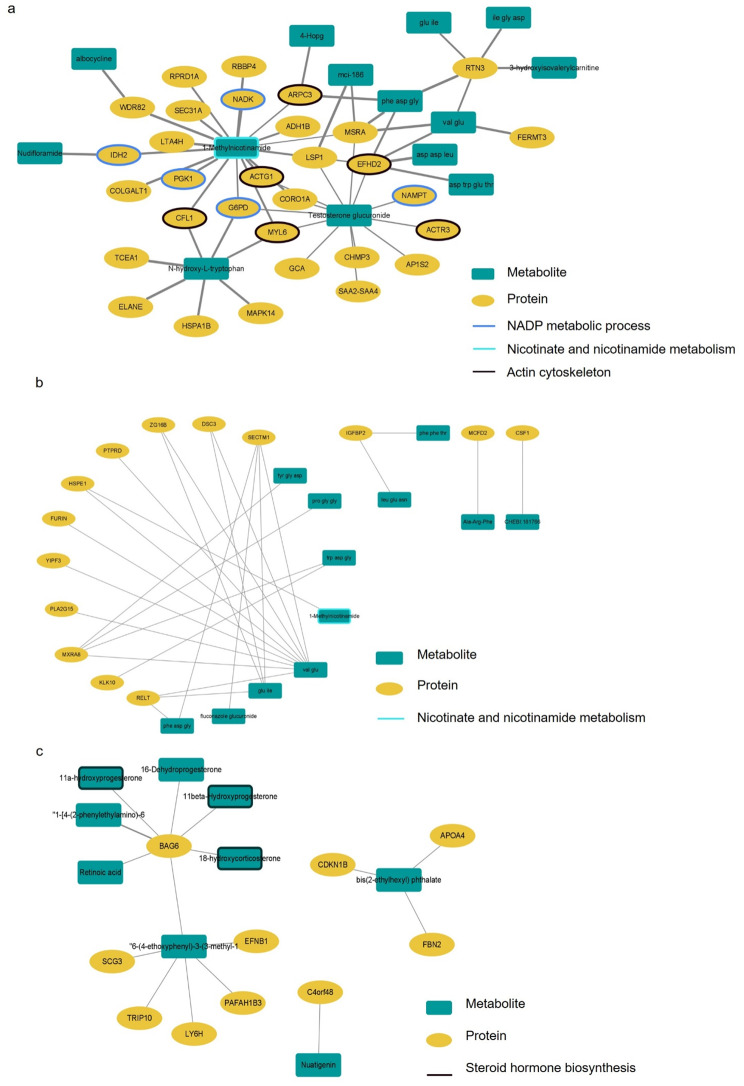
Results: Compared to the CS group, the proteomic and metabolomic profiles were similar between the Intra_CS and VD groups in our study. We did not identify any enriched protein or metabolite pathways related to immune development that could influence the risk of allergic diseases in offspring across different delivery modes. However, we identified seven protein modules correlated with the duration from the rupture of the membranes to full dilation of the cervix, with the actin cytoskeleton module significantly enriched. A metabolic module in cord blood that correlated with VD was enriched in subclasses including C21 steroids, steroid sulfates, and oxysterols. Integrative analysis of proteomic and metabolomic data suggested pathways related to mode of delivery and duration of labor, encompassing the actin cytoskeleton, NADP metabolic process, nicotinate, and nicotinamide metabolism in amniotic fluid, and the steroid hormone biosynthesis pathway in cord blood.
Conclusions: Differences in steroid hormones and the actin cytoskeleton pathway according to proteomics and metabolomics in amniotic fluid and cord blood were more indicative of the labor process. These findings could guide future studies on delivery-associated biochemical pathways.
Keywords: Cesarean section; Delivery mode; Metabolomics; Proteomics; WGCNA.
© 2024. The Author(s).
Conflict of interest statement
Declarations. Ethics approval and consent to participate: Ethics approval was obtained from both the Ethics Committee of the International Peace Maternity and Child Health Hospital and the Ethics Committee of Xinhua Hospital, both of which are affiliated with the Shanghai Jiao Tong University School of Medicine. Consent for publication: Not applicable. Competing interests: The authors declare no competing interests. Supporting information: Tables S1–S5 and Figures S1–S10 are included in the Supplementary Material. Additionally, the semi-quantitative data for proteins and metabolites are provided in a separate Supplementary .xlsx file.
Figures
Similar articles
-
Mode of delivery may seriously affect omics studies using umbilical cord blood and amniotic fluid.Arch Gynecol Obstet. 2024 Dec;310(6):3305-3308. doi: 10.1007/s00404-024-07828-0. Epub 2024 Nov 19. Arch Gynecol Obstet. 2024. PMID: 39560725
-
Investigation of the impact of birth by cesarean section on fetal and maternal metabolism.Arch Gynecol Obstet. 2019 Sep;300(3):589-600. doi: 10.1007/s00404-019-05213-w. Epub 2019 Jun 14. Arch Gynecol Obstet. 2019. PMID: 31201538
-
The effect of labor on maternal and fetal vitamins C and E.Am J Obstet Gynecol. 2002 Nov;187(5):1179-83. doi: 10.1067/mob.2002.127131. Am J Obstet Gynecol. 2002. PMID: 12439499
-
Delivery for women with a previous cesarean: guidelines for clinical practice from the French College of Gynecologists and Obstetricians (CNGOF).Eur J Obstet Gynecol Reprod Biol. 2013 Sep;170(1):25-32. doi: 10.1016/j.ejogrb.2013.05.015. Epub 2013 Jun 28. Eur J Obstet Gynecol Reprod Biol. 2013. PMID: 23810846 Review.
-
Metabolomics application in maternal-fetal medicine.Biomed Res Int. 2013;2013:720514. doi: 10.1155/2013/720514. Epub 2013 Jun 9. Biomed Res Int. 2013. PMID: 23841090 Free PMC article. Review.
References
-
- Vogl SE, Worda C, Egarter C, et al. Mode of delivery is associated with maternal and fetal endocrine stress response. Bjog[J]. 2006;113:441–5. - PubMed
-
- Gürdeniz G, Ernst M, Rago D et al. Neonatal metabolome of caesarean section and risk of childhood asthma. Eur Respir. 2022;59. - PubMed
-
- Bager P, Wohlfahrt J, Westergaard T. Caesarean delivery and risk of atopy and allergic disease: meta-analyses. Clin Exp Allergy[J]. 2008;38:634–42. - PubMed
-
- Hashimoto F, Nishiumi S, Miyake O, et al. Metabolomics analysis of umbilical cord blood clarifies changes in saccharides associated with delivery method. Early Hum Dev[J]. 2013;89:315–20. - PubMed
MeSH terms
Grants and funding
- 41991314, 81803246, and 82404277/National Natural Science Foundation of China
- 41991314, 81803246, and 82404277/National Natural Science Foundation of China
- 24ZR1449200/Natural Science Foundation of Shanghai Municipality
- 2022CR1-01A/Clinical Research Plan of IPMCHIPMCH
- 2020CXJQ01/Shanghai Municipal Health Commission
LinkOut - more resources
Full Text Sources
Medical
