. 2024 Dec 26;25(1):443.
doi: 10.1186/s12931-024-03083-8.

Activated DRP1 promotes mitochondrial fission and induces glycolysis in ATII cells under hyperoxia

Affiliations

Activated DRP1 promotes mitochondrial fission and induces glycolysis in ATII cells under hyperoxia

Tong Sun et al. Respir Res. .

Abstract

Backgroud: Recent studies have reported mitochondrial damage and metabolic dysregulation in BPD, but the changes in mitochondrial dynamics and glucose metabolic reprogramming in ATII cells and their regulatory relationship have not been reported.

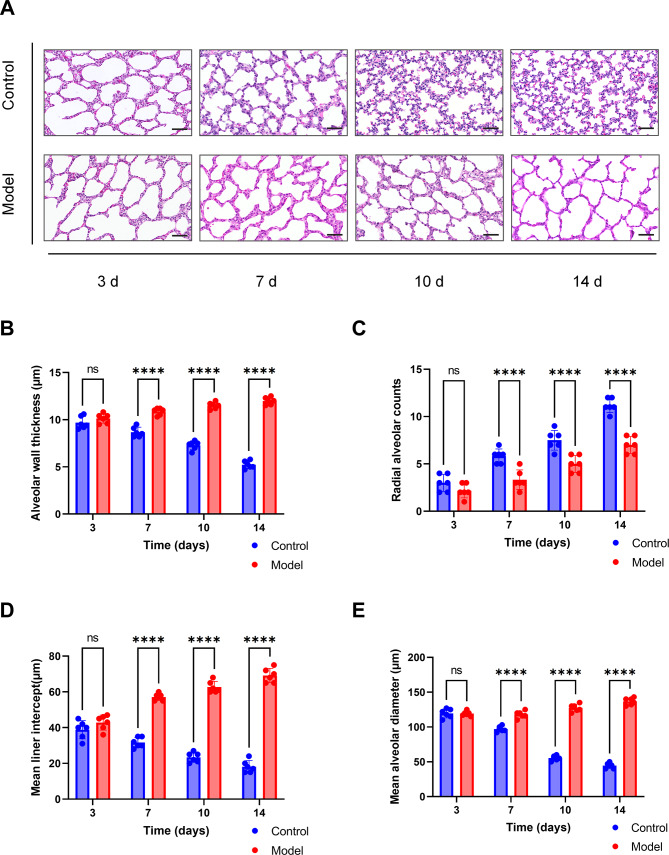
Methods: Neonatal rats in this study were divided into model (FIO2:85%) and control (FIO2: 21%) groups. Lung tissues were extracted at 3, 7, 10 and 14 postnatal days and then conducted HE staining for histopathological observation. We assessed the expression of mitochondria dynamic associated proteins and glycolysis associated enzymes in lung tissues, primary ATII cells and RLE-6TN cells. Double immunofluorescence staining was used to confirm the co-localization of DRP1 and ATII cells. Real-time analyses of ECAR and OCR were performed with primary ATII cells using Seahorse XF96. ATP concentration was measured using an ATP kit. We treated RLE-6TN cells at 85% hyperoxia for 48 h with mitochondrial fission inhibitor Mdivi-1 to verify the role of DRP1 in regulating glucose metabolic reprogramming.

Findings: We found that hyperoxia causes ATII cells' mitochondrial morphological change. The expression of DRP1 and p-DRP1 increased in lung tissue and primary ATII cells of neonatal rats exposed to hyperoxia. Glycolysis related enzymes including PFKM, HK2, and LDHA were also increased. Hyperoxia inhibited ATP production in ATII cells. In RLE-6TN cells, we verified that the administration of Mdivi-1 could alleviate the enhancement of aerobic glycolysis and fragmentation of mitochondria caused by hyperoxia.

Interpretations: Hyperoxia exposure leads to increased mitochondrial fission in ATII cells and mediates the reprogramming of glucose metabolism via the DRP1 signaling pathway. Inhibiting the activation of DRP1 signaling pathway may be a promising therapeutic target for BPD.

Keywords: ATII cells; Bronchopulmonary dysplasia; DRP1 signaling pathway; Metabolic reprogramming; Mitochondrial fission.


Conflict of interest statement

Declarations. Ethics approval and consent to participate: The Ethics Committee of Animals at China Medical University approved and supervised all animal experiments (2023PS932K). Consent for publication: Not applicable. Competing interests: The authors declare no competing interests.

Figures

Fig. 1
Fig. 1
Hyperoxia exposure leads to histological changes in the lungs. A HE staining of the lung tissues of neonatal rats was observed at 3, 7, 10, and 14 d after birth via microscopy (×400 magnification; scale bar, 50 μm; n = 6). BE Changes in lung morphology were evaluated using RAC values, MLI, MAD, and alveolar wall thickness. The mean ± SD is used to express the data. * P < 0.05, ** P < 0.01 compared with control group
Fig. 2
Fig. 2
Morphological changes of mitochondria in ATII cells after hyperoxia exposure. A Structural changes in mitochondria were observe using transmission electron microscopy, and images show mitochondrial morphological changes in ATII cells (yellow/white arrow; ×30 000 magnification; scale bar, 0.5 μm; n = 3). B, C Changes in mitochondrial size and cell count. D MitoTracker Red CMXRos staining showing that model group’s mitochondria were short and fragmented (yellow/white arrow; ×800 magnification; scale bar, 25 μm). E The membrane potential of the model group evidently decreased 7 d after birth, the JC-1 polymer (red) gradually decreased, and the JC-1 monomer (green) gradually increased (×400 magnification; scale bar, 50 μm; n = 3). F Analyses the ration of JC-1 polymer (red) to JC-1 monomer (green) in primary ATII cells at 3, 7, 10, and 14 d after birth in the control and model groups. The mean ± SD is used to express the data. * P < 0.05, ** P < 0.01 compared with the control group
Fig. 3
Fig. 3
Changes in the expression of mitochondrial dynamics-associated proteins in lung tissues of neonatal rats with bronchopulmonary dysplasia. AF Western blotting and analyses of MFN1, MFN2, OPA1, DRP1, and p-DRP1 at 3, 7, 10, and 14 d after birth in the lung tissues of the control and model groups (n = 3). G Representative immunostaining of lung sections from the control and model groups using anti‑DRP1 and anti‑SPB. Yellow puncta denote co-localization (white arrows, ×400 magnification; scale bar, 50 μm; n = 3). The mean ± SD is used to express the data. *P < 0.05, **P < 0.01 vs. control
Fig. 4
Fig. 4
Changes in the expression of mitochondrial dynamics-associated proteins in primary ATII cells of rats with bronchopulmonary dysplasia. AF Western blotting and analyses of MFN1, MFN2, OPA1, DRP1, and p-DRP1 in primary ATII cells at 3, 7, 10, and 14 d after birth in the control and model groups (n = 3). G, H Representative immunostaining of ATII cell slides from the control and model groups using anti‑DRP1 and anti‑SPB or anti‑p-DRP1 and anti-Mff antibodies. Yellow puncta denote co-localization (white arrows, ×400 magnification; scale bar, 50 μm; n = 3). The mean ± SD is used to express the data. *P < 0.05, **P < 0.01 vs. control
Fig. 5
Fig. 5
Changes in glucose metabolism in lung tissues and ATII cells. AD Western blotting and analyses of HK2, PFKM, and LDHA in the lung tissues of the control and model groups at 3, 7, 10, and 14 d after birth (n = 3). EH Western blotting and analyses of HK2, PFKM, and LDHA in primary ATII cells in the control and model groups at 3, 7, 10, and 14 d after birth (n = 3). I, J Representative graph of ECAR output of ATII cells and responses to glucose, 2‑DG and oligomycin, and ECAR of glycolysis performed using Seahorse XF96. K, L Representative graph of the OCR output of ATII cells and responses to FCCP, oligomycin, rotenone/antimycin A, and mitochondrial OCR of maximal respiration performed using Seahorse XF96. The assay was conducted on one plate with at least three replicates. M ATP concentrations in primary ATII cells at 3, 7, 10, and 14 d after birth in the control and model groups (n = 3). The mean ± SD is used to express the data. *P < 0.05, **P < 0.01 vs. control
Fig. 6
Fig. 6
Histological changes of lungs after given 2-DG to model group. A, B Western blotting and analyses of HK2, PFKM, and LDHA in the ATII cells of the control, model, and 2-DG given groups (n = 3). C HE staining of the lung tissues of neonatal rats was observed at 14 d after birth via microscopy (×400 magnification; scale bar, 50 μm; n = 3). D, E Changes in lung morphology were evaluated using RAC values, and alveolar wall thickness. The mean ± SD is used to express the data. *P < 0.05, **P < 0.01 vs. control
Fig. 7
Fig. 7
Changes of mitochondrial dynamics and glucose metabolic reprogramming in RLE-6TN cells exposed to hyperoxia. AE Western blotting and analyses of MFN1, MFN2, OPA1, and DRP1 in RLE-6TN cells at 24, 48, and 72 h after hyperoxia exposure (n = 3). FI Western blotting and analyses of HK2, PFKM, and LDHA in RLE-6TN cells at 24, 48, and 72 h after exposed to hyperoxia (n = 3). J Volcanic map of differential metabolites. Red, upregulated differential metabolites; blue, downregulated differential metabolites; and gray, undifferentiated metabolites. K, L Circos and histograms of differential metabolites, KEGG pathway enrichment *P < 0.05, **P < 0.01 vs. control
Fig. 8
Fig. 8
Effect of Mdivi-1 administration on RLE-6TN cells exposed to hyperoxia. AD Representative graphs of the ECAR and OCR outputs of RLE-6TN cells at 24, 48, and 72 h after hyperoxia exposure. E Cell viability curve of RLE-6TN cells after the treatment with Mdivi-1. F, G Western blotting and analyses of DRP1, PFKM, HK2, and LDHA in RLE-6TN cells at 48 h after exposed to hyperoxia and the addition of Mdivi-1 (n = 3). H, I Representative graph of ECAR and OCR output of RLE-6TN cells at 48 h after exposed to hyperoxia and the addition of Mdivi-1. J ATP concentration at 48 h after hyperoxia exposure and addition of Mdivi-1. K MitoTracker Red CMXRos staining showed that mitochondrial fragmentation improved after the addition of Mdivi-1 48 h under hyperoxic conditions (white arrows, ×800 magnification; scale bar, 25 μm). The mean ± SD is used to express the data. *P < 0.05, **P < 0.01 vs. control

Similar articles

Cited by

References

    1. Gilfillan M, Bhandari V. Moving bronchopulmonary dysplasia research from the bedside to the bench. Am J Physiol Lung Cell Mol Physiol. 2022;322(6):L804–21. - PubMed
    1. Álvarez-Fuente M, Arruza L, Muro M, Zozaya C, Avila A, López-Ortego P, González-Armengod C, Torrent A, Gavilán JL, Del Cerro MJ. The economic impact of prematurity and bronchopulmonary dysplasia. Eur J Pediatr. 2017;176(12):1587–93. - PubMed
    1. Katz TA, Vliegenthart RJS, Aarnoudse-Moens CSH, Leemhuis AG, Beuger S, Blok GJ, van Brakel MJM, van den Heuvel MEN, van Kempen A, Lutterman C, Rijpert M, Schiering IA, Ran NC, Visser F, Wilms J, van Kaam AH, Onland W. Severity of Bronchopulmonary Dysplasia and Neurodevelopmental Outcome at 2 and 5 years corrected age. J Pediatr. 2022;243:40–e4642. - PubMed
    1. Thébaud B, Goss KN, Laughon M, Whitsett JA, Abman SH, Steinhorn RH, Aschner JL, Davis PG, McGrath-Morrow SA, Soll RF, Jobe AH. Bronchopulmonary dysplasia. Nat Rev Dis Primers. 2019;5(1):78. - PMC - PubMed
    1. Yue L, Lu X, Dennery PA, Yao H. Metabolic dysregulation in bronchopulmonary dysplasia: implications for identification of biomarkers and therapeutic approaches. Redox Biol. 2021;48:102104. - PMC - PubMed

LinkOut - more resources