. 2024 Dec 26;24(1):432.
doi: 10.1186/s12935-024-03611-y.

Protein kinase CK2 sustains de novo fatty acid synthesis by regulating the expression of SCD-1 in human renal cancer cells

Affiliations

Protein kinase CK2 sustains de novo fatty acid synthesis by regulating the expression of SCD-1 in human renal cancer cells

Barbara Guerra et al. Cancer Cell Int. .

Abstract

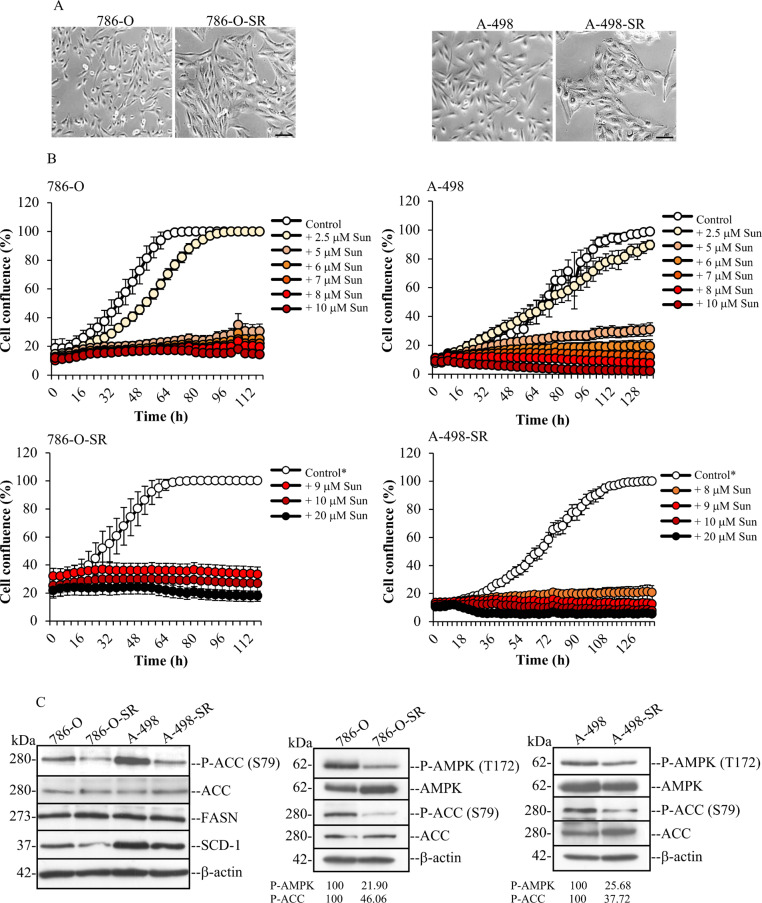
Background: Clear cell renal cell carcinoma (ccRCC) is a type of cancer characterized by a vast intracellular accumulation of lipids that are critical to sustain growth and viability of the cells in the tumour microenvironment. Stearoyl-CoA 9-desaturase 1 (SCD-1) is an essential enzyme for the synthesis of monounsaturated fatty acids and consistently overexpressed in all stages of ccRCC growth.

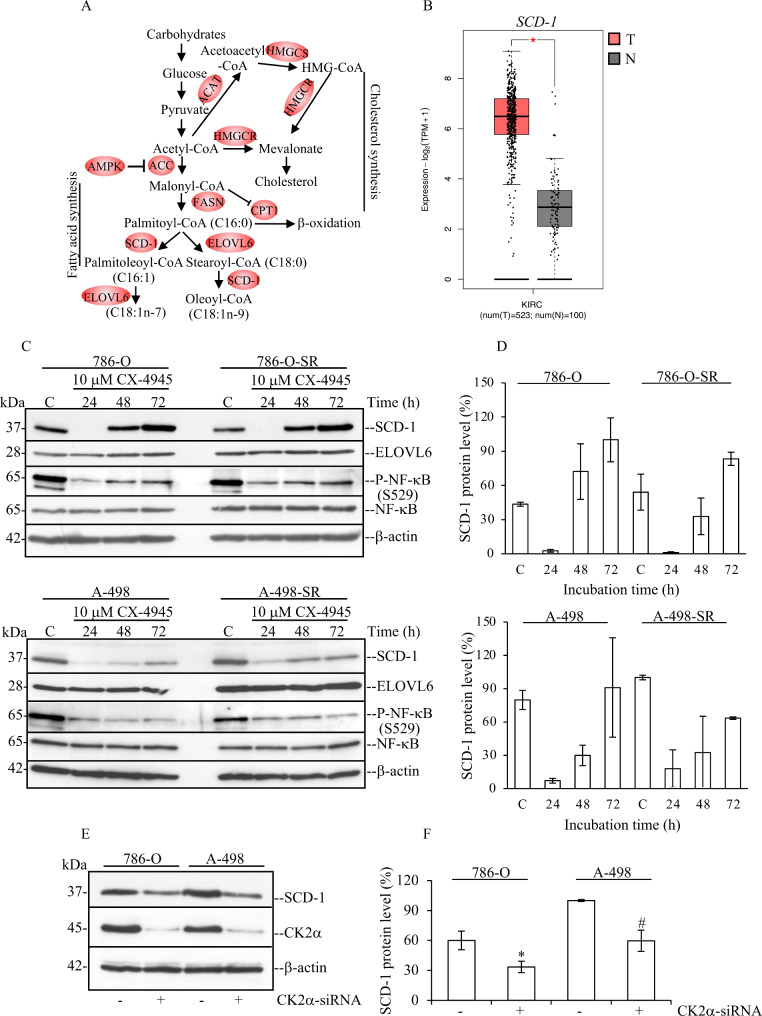
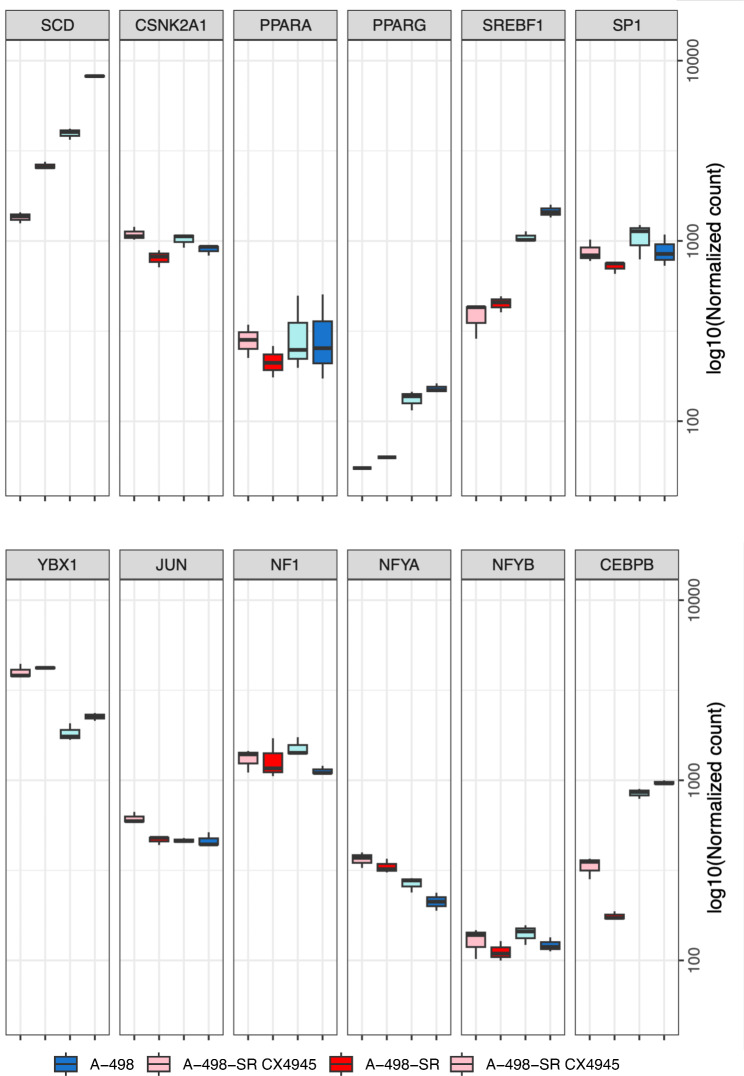
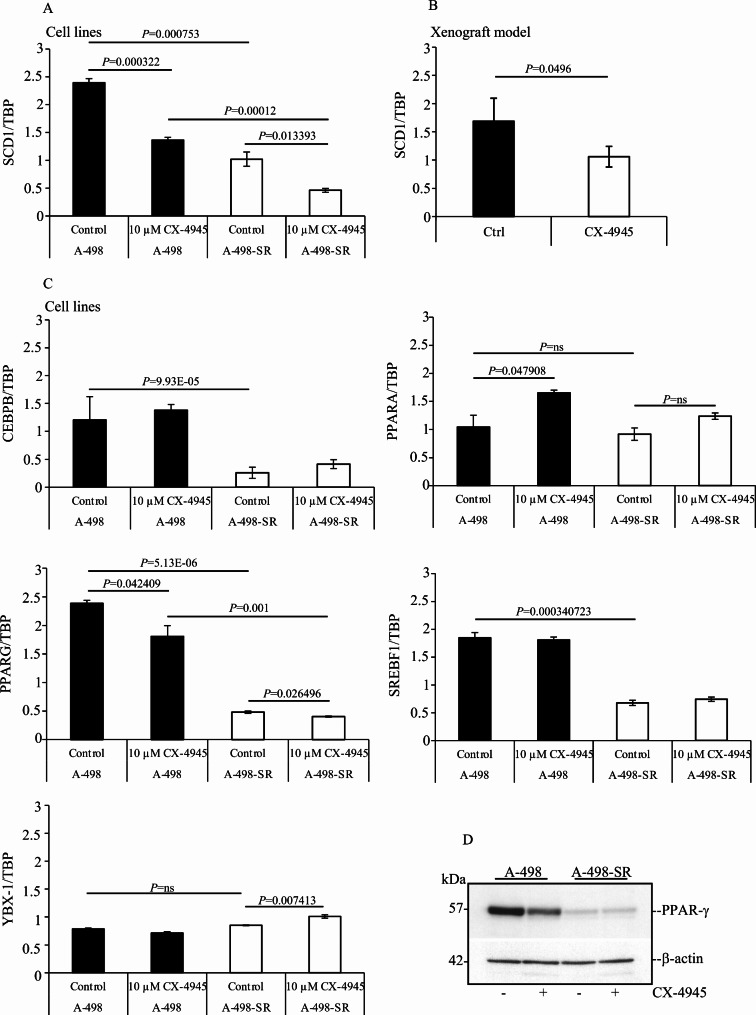
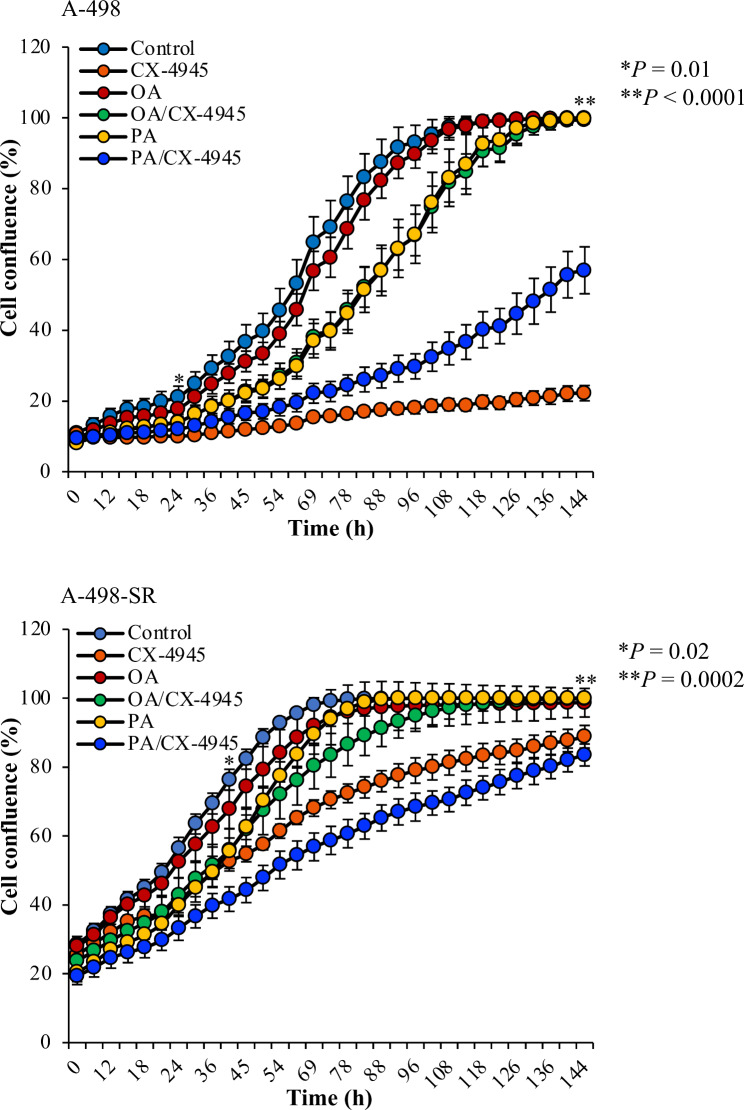
Methods: Human clear cell renal cell carcinoma lines were treated with small-molecule inhibitors of protein kinase CK2. Effects on the expression levels of SCD-1 were investigated by RNA-sequencing, RT-qPCR, Western blot, and in vivo studies in mice. Phase-contrast microscopy, fluorescence microscopy, flow cytometry, and MALDI-mass spectrometry analysis were carried out to study the effects on endogenous lipid accumulation, induction of endoplasmic reticulum stress, rescue effects induced by exogenous MUFAs, and the identity of lipid populations. Cell proliferation and survival were investigated in real time employing the Incucyte® live-cell analysis system. Statistical significance was determined by applying the two-tailed Student's t test when comparing two groups of data whereas the two-way ANOVA, multiple Tukey's test was employed for multiple comparisons.

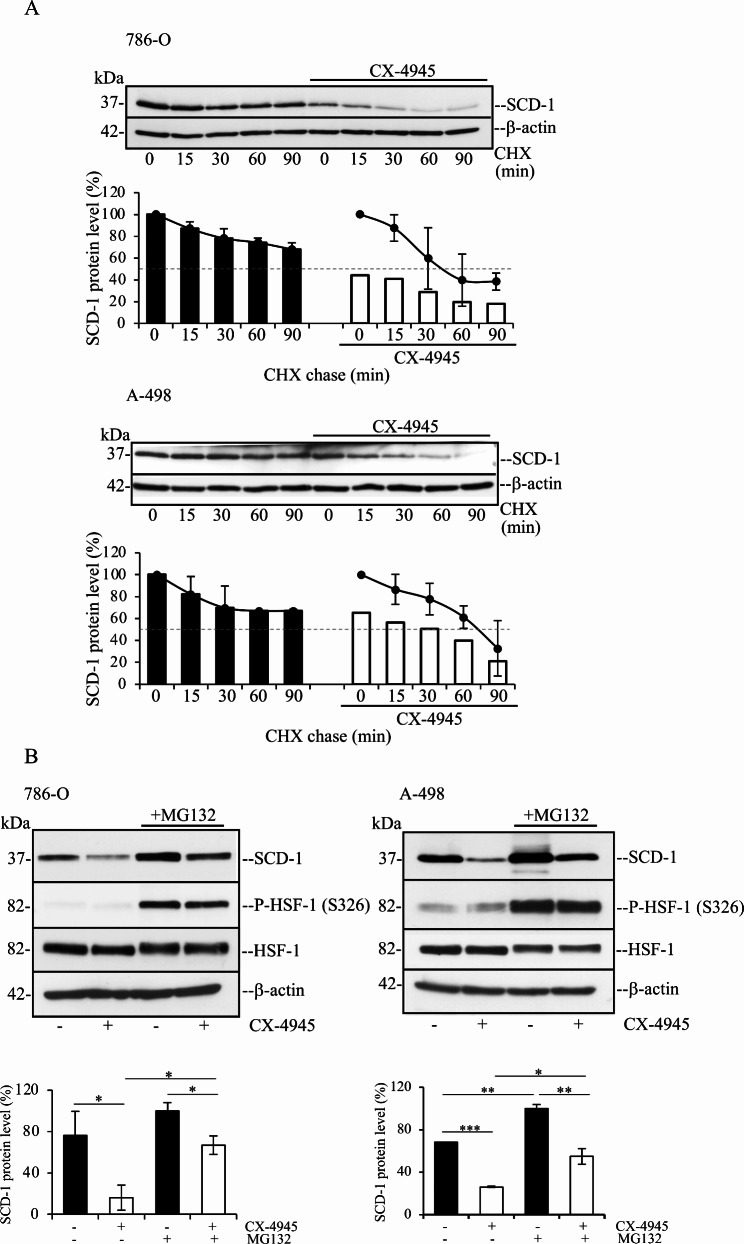
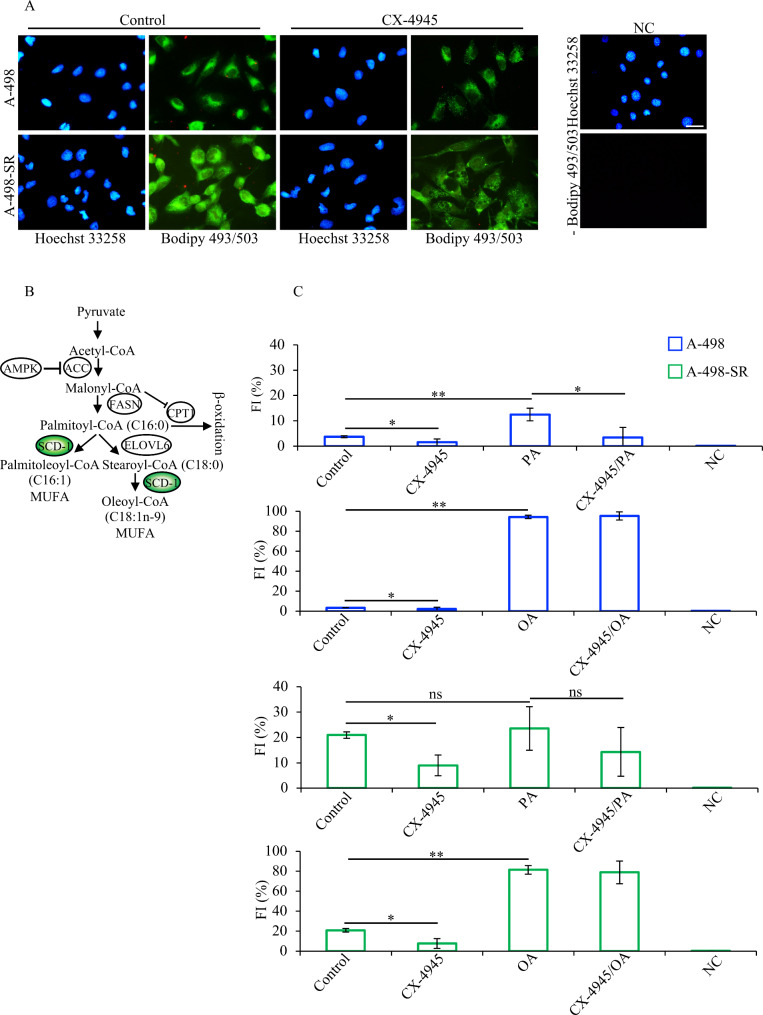
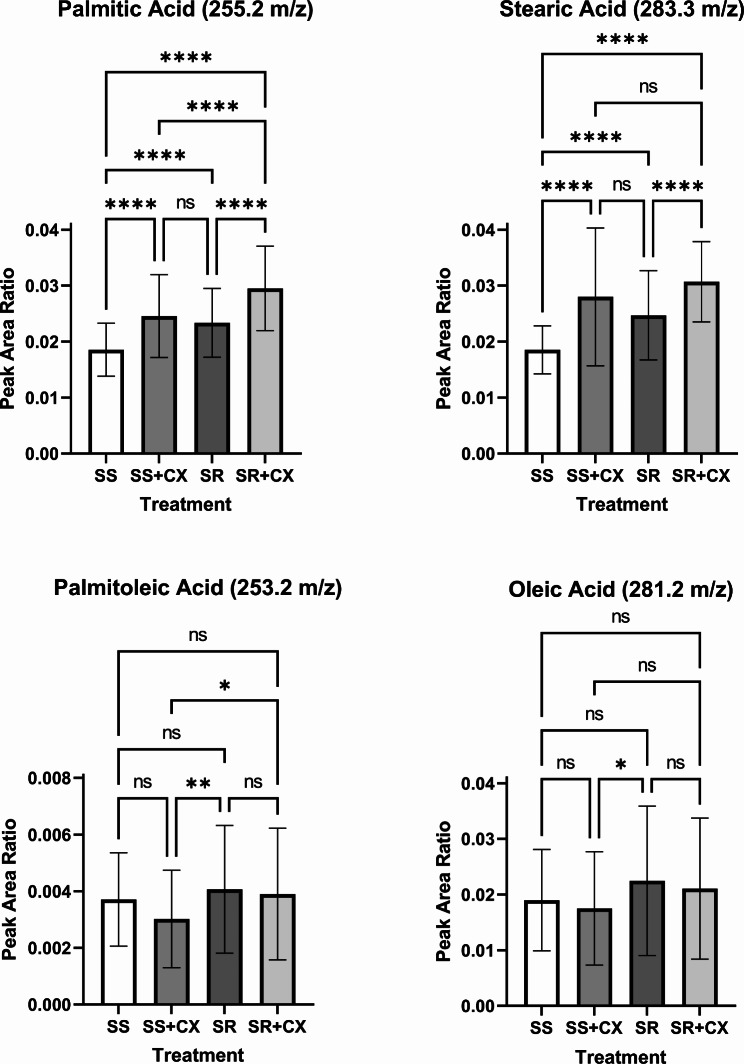
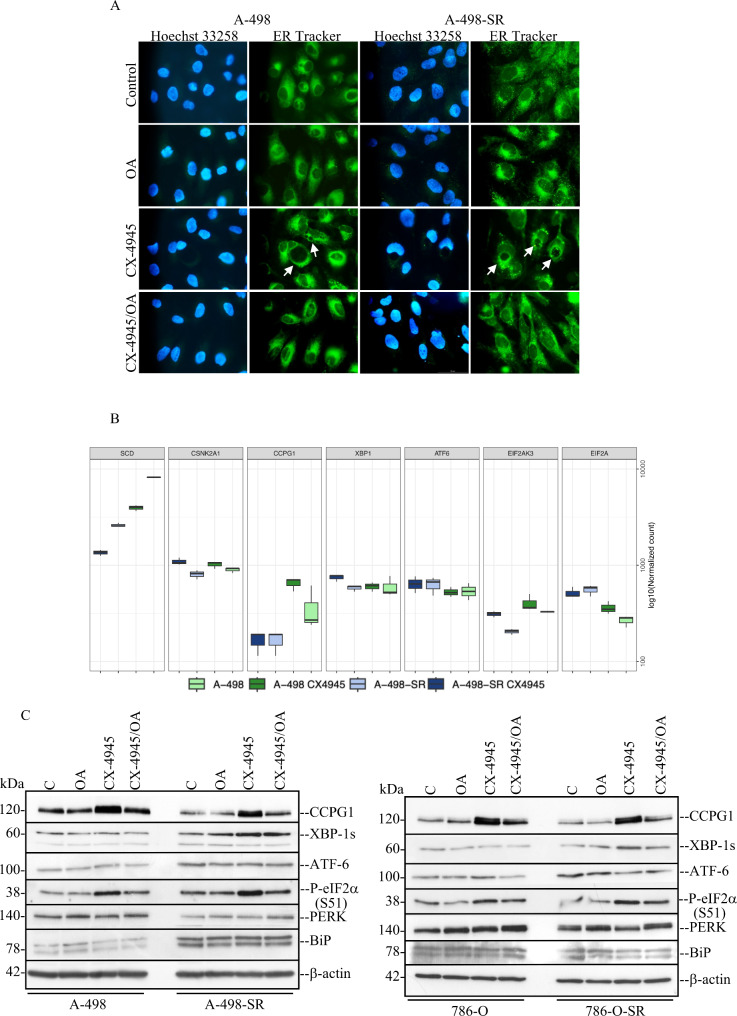
Results: Here, we show that protein kinase CK2 is critical for preserving the expression of SCD-1 in ccRCC lines maintained in culture and heterotransplanted into nude mice. Consistent with this, pharmacological inhibition of CK2 leads to induction of endoplasmic reticulum stress linked to unfolded protein response activation and decreased proliferation of the cells. Both effects could be reversed by supplementing the growth medium with oleic acid indicating that these effects are specifically caused by reduced expression of SCD-1. Analysis of lipid composition by MALDI-mass spectrometry revealed that inhibition of CK2 results in a significant accumulation of the saturated palmitic- and stearic acids.

Conclusions: Collectively, our results revealed a previously unidentified molecular mechanism regulating the synthesis of monounsaturated fatty acids corroborating the notion that novel therapeutic approaches that include CK2 targeting, may offer a greater synergistic anti-tumour effect for cancers that are highly dependent on fatty acid metabolism.

Keywords: CK2; Clear cell renal cell carcinoma; SCD-1; fatty acids; sunitinib.


Conflict of interest statement

Declarations. Ethics approval and consent to participate: Studies involving experimental animals were approved by the Danish Animal Experiments Inspectorate (permission nr.: 2022-15-0201-01265). Competing interests: The authors declare no competing interests.

Figures

Fig. 1
Fig. 1
Generation of ccRCC cell lines adapted to grow in the presence of sunitinib. (A) Phase-contrast microscopy pictures of live cells, i.e. 786-O, 786-O-SR (adapted to grow in the presence of 8 µM sunitinib), A-498 and A-498-SR (adapted to grow in the presence of 7 µM sunitinib). Sunitinib-resistant (SR) cells show hypertrophic features indicated by their increased size as compared to the corresponding parental cell lines. Pictures were taken at 10x magnification. Scale bar = 100 μm. (B) The effect on cell growth of increasing concentrations of sunitinib (Sun) was analysed by the IncuCyte S3 live-cell system. Measurements were performed every four hours. Data represent mean values +/- STDEV (n = 9 replicates) and expressed in percentage. Control cells were grown in the presence of DMSO. Control* denotes cells adapted to grow in the presence of 8 µM sunitinib (786-O-SR) or 7 µM sunitinib (A-498-SR). (C) Analysis by Western blot of whole cell lysates from 786-O, 786OSR, A-498 and A-498-SR cell lines. Harvested cells were processed as described in the materials and methods section and whole cell lysates were analysed by probing Western blot membranes with antibodies directed against the indicated proteins. Western blot band intensity of the indicated proteins was determined using ImageJ densitometry analysis (NIH). Values are expressed in percentage. All experiments were performed at least three times and yielded similar results. One representative experiment is shown. β-actin detection served as loading control
Fig. 2
Fig. 2
Pharmacological inhibition of CK2 reduces the expression levels of SCD-1 in a time-dependent manner. (A) Scheme summarizing the major steps involved in the intracellular de novo synthesis of fatty acids and cholesterol. HMGCS1: hydroxymethylglutaryl-CoA synthase 1, HMGCR: 3-hydroxy-3-methylglutaryl-CoA reductase, ACAT: acyl-CoA: cholesterol acyltransferase, AMPK: AMP-activated protein kinase, ACC: acetyl-CoA carboxylase, FASN: fatty acid synthase, CPT1: carnitine palmitoyltransferase 1, SCD-1: stearoyl-CoA 9-desaturase 1, ELOVL6: elongation of long fatty acid protein 6. (B) Significantly upregulated gene expression levels of SCD-1 in ccRCC tissue as compared to normal kidney tissue. The analysis was performed utilizing the GEPIA2 online tool. (C) Western blot analysis of whole cell lysate for proteins indicated in the figure. Experiments were carried out treating cells with vehicle (DMSO, Control) or 10 µM CX-4945 for increasing lengths of time. (D) Densitometric analysis of SCD-1 protein band signal relative to the experiments shown in (C), was carried out using ImageJ software (NIH) and calculated in percentage. (E) Downregulation of CK2α was carried out as described in the materials and methods section. Cells were harvested and whole lysates analysed by Western blot after 72 h from transfection. (F) Densitometric analysis of SCD-1 protein band signal was as in (D) and calculated in percentage by assigning a value of 100% to the intensity of protein band signal from A-498 control experiment. *P = 0.01, #P = 0.002. In all cases, similar results were obtained from three independent experiments. One representative experiment is shown. β-actin detection was used as loading control
Fig. 3
Fig. 3
RNA-seq analysis of differentially expressed genes regulating SCD-1 expression following pharmacological inhibition of CK2. (A) A-498 and A-498-SR cells were treated with vehicle (DMSO, Control) or 10 µM CX-4945 for 24 h, respectively. Total RNA was isolated and employed for RNA-seq. Boxplots show the mRNA levels of major transcription factors regulating the expression of SCD-1. Results highlight the effect of adaptation to sunitinib treatment and the response to CK2 inhibition of the indicated ccRCC cell lines
Fig. 4
Fig. 4
Small molecule-mediated inhibition of CK2 affects the expression of PPARγ. (A) RT-qPCR analysis of SCD-1 gene expression in ccRCC cells treated with vehicle (DMSO, Control) or 10 µM CX-4945 for 24 h. TATA box binding protein (TBP)-coding gene was employed as reference gene. Values on the Y-axis are expressed as the ratio between the level of the gene of interest and the reference gene. Experiments were performed three times in triplicates. Average values are shown +/- STDEV. (B) RT-qPCR analysis of SCD-1 gene expression in ccRCC cells heterotransplanted into nude mice treated with vehicle or Silmitasertib sodium salt (n = 4 per group). (C) Analysis of the mRNA levels of the indicated transcription factors expressed in cells treated as indicated in (A). (D) Whole cell lysates from cells treated as in (A) were analysed by Western blot probing the membrane with anti-PPARγ antibody. β-actin detection was used as loading control
Fig. 5
Fig. 5
CK2 is important for preserving the stability of SCD-1 in ccRCC cells. (A) Cells were incubated with vehicle (DMSO) or 2.5 µM CX-4945 for 16 h prior to the addition of 100 µg/ml cycloheximide (CHX) for the indicated times. Whole cell lysates were subjected to Western blot analysis. β-actin detection was used as loading control. One representative experiment is shown. Densitometric analysis of SCD-1 protein band signals were plotted against time assigning for each cell line 100% to values corresponding to control cells at time 0 (bar graphs), or to control cells and CX-4945-treated cells, respectively, at time 0 (line graphs). Average values are expressed in percentage +/- STDEV. Experiments were performed at least three times yielding similar results. (B) Cells were incubated with vehicle or 2.5 µM CX-4945 for 16 h prior to the addition of 50 µM MG132 for 6 h. Whole cell lysates were processed as in (A). Detection of phosphorylated heat shock factor 1 (P-HSF-1) at S326 was carried out to verify induction of cellular stress in the presence of proteasome inhibitors [85]. Values from the densitometric analysis of SCD-1 protein band signals are expressed in percentage assigning 100% to values corresponding to cells treated with MG132. Experiments were performed two times. *P < 0.05, **P < 0.005, ***P < 0005
Fig. 6
Fig. 6
CK2-dependent dynamics of lipid droplets accumulation in ccRCC lines. (A) Fluorescence images of cells treated with vehicle (DMSO, Control) or 10 µM CX-4945 for 24 h. Cells were stained with Bodipy 493/503 dye as described in the materials and methods section. Cells were counterstained with Hoechst 33,258 dye. Photos were taken at 20x magnification. Scale bar = 50 μm. (B) Scheme summarizing the initial steps in the synthesis of MUFAs from SFAs. (C) Cells were treated as described in (A). 80 µM BSA-Palmitic acid (PA) or 80 µM BSA-Oleic acid (OA) were added to the culture medium 30 min after CX-4945. Quantification of fluorescence emission is expressed in percentage and was determined by flow cytometry after staining with Bodipy 493/503 reagent. Experiments were performed three times and results are shown in arbitrary units +/- STDEV. *P < 0.05, **P < 0.005. NC: negative control; FI: fluorescence intensity
Fig. 7
Fig. 7
Lipid profiling by MALDI-MS of ccRCC cells revealed accumulation of SFAs upon treatment with CX-4945. Analysis of specific lipid species in A-498 (SS) or A-498-SR (SR) cells treated with vehicle or 10 µM CX-4945 (CX) for 24 h. Values refer to the quantification of palmitic acid, stearic acid, palmitoleic acid, and oleic acid among four treatment groups (n = 3 per group), respectively. One-Way ANOVA with post hoc Tukey’s HSD; ****P < 0.0001, ***P < 0.001, **P < 0.01, *P < 0.05, NS = not significant
Fig. 8
Fig. 8
Inhibition of CK2 leads to ER stress and activation of the unfolded protein response (UPR). (A) Fluorescence images of cells treated with vehicle (DMSO, Control) or 10 µM CX-4945 for 48 h. Where indicated, cells were additionally grown in the presence of 80 µM OA. Cells were stained with ER-Tracker™ Green dye as described in the materials and methods section. Arrows indicate detection of cytoplasmic vacuolation which appears to be dilation of ER cisternae. Cells were counterstained with Hoechst 33,258 dye. Photos were taken at 40x magnification. Scale bar = 50 μm. (B) RNA-seq analysis was as described in Fig. 3. Boxplots show the mRNA levels of specific proteins controlling ER stress response. (C) Whole cell lysate from cells treated with vehicle (DMSO, Control) or CX-4945 for 48 h were analysed by Western blot. Where indicated, cells were additionally grown in the presence of 80 µM OA. Western blot analysis shows the expression of the indicated proteins. Experiments were repeated three times obtaining similar results. Detection of β-actin served as loading control
Fig. 9
Fig. 9
Oleic acid restores compromised proliferation of the cells following pharmacological inhibition of CK2. Dose-response growth curves of cells treated with vehicle (DMSO, Control), 80 µM OA, 80 µM PA, 10 µM CX-4945, and a combination of CX-4945/OA or PA, respectively. Data represent mean values +/- STDEV (n = 9 replicates) and expressed in percentage. Statistically significant differences between CX-4945 treatments and CX-4945/OA treatments were calculated using one-way ANOVA

Similar articles

Cited by

References

    1. Abramczyk H, Surmacki J, Kopec M, Olejnik AK, Lubecka-Pietruszewska K, Fabianowska-Majewska K. The role of lipid droplets and adipocytes in cancer. Raman imaging of cell cultures: MCF10A, MCF7, and MDA-MB-231 compared to adipocytes in cancerous human breast tissue. Analyst. 2015;140:2224–35. - PubMed
    1. Hsieh JJ, Purdue MP, Signoretti S, Swanton C, Albiges L, Schmidinger M, et al. Renal cell carcinoma. Nat Rev Dis Primers. 2017;3:17009. - PMC - PubMed
    1. Dizman N, Philip EJ, Pal SK. Genomic profiling in renal cell carcinoma. Nat Rev Nephrol. 2020;16:435–51. - PubMed
    1. Ricketts CJ, De Cubas AA, Fan H, Smith CC, Lang M, Reznik E, et al. The Cancer Genome Atlas Comprehensive Molecular Characterization of Renal Cell Carcinoma. Cell Rep. 2018;23:3698. - PubMed
    1. Nickerson ML, Jaeger E, Shi Y, Durocher JA, Mahurkar S, Zaridze D, et al. Improved identification of von Hippel-Lindau gene alterations in clear cell renal tumors. Clin Cancer Res. 2008;14:4726–34. - PMC - PubMed

LinkOut - more resources