Comparative Study
. 2024 Dec 26;15(1):54.
doi: 10.1186/s13229-024-00636-y.

Comparative profiling of white matter development in the human and mouse brain reveals volumetric deficits and delayed myelination in Angelman syndrome

Affiliations
Comparative Study

Comparative profiling of white matter development in the human and mouse brain reveals volumetric deficits and delayed myelination in Angelman syndrome

Siddhi S Ozarkar et al. Mol Autism. .

Abstract

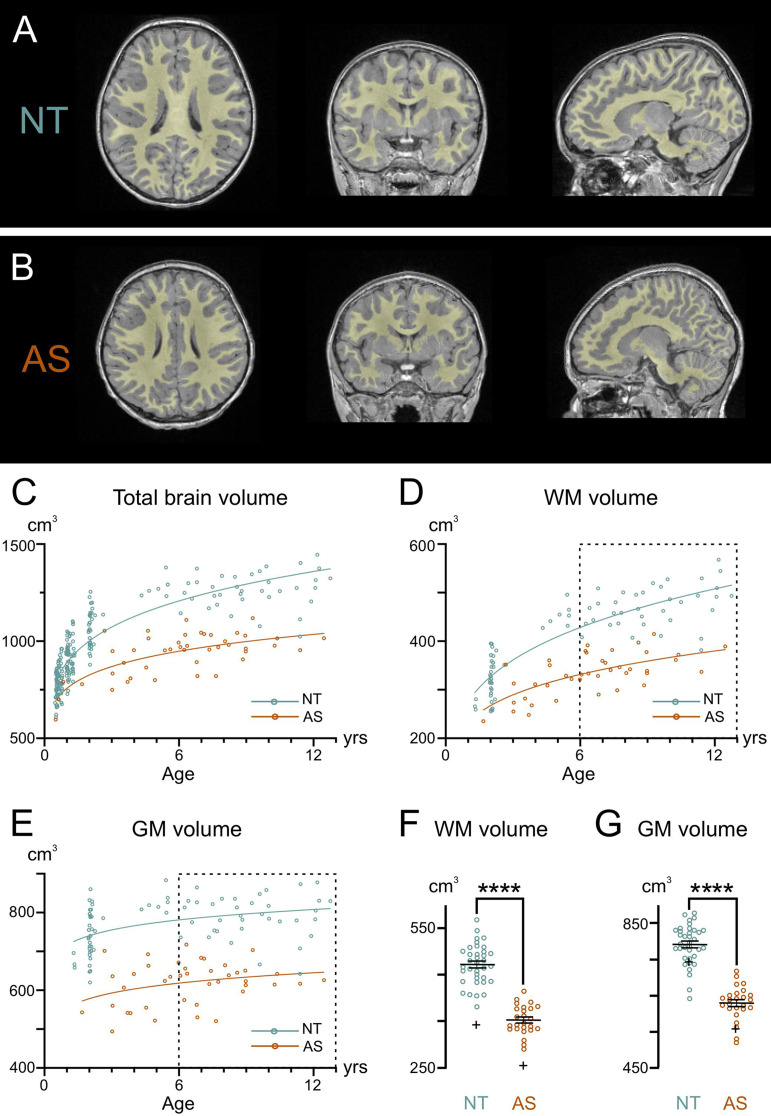
Background: Angelman syndrome (AS), a severe neurodevelopmental disorder resulting from the loss of the maternal UBE3A gene, is marked by changes in the brain's white matter (WM). The extent of WM abnormalities seems to correlate with the severity of clinical symptoms, but these deficits are still poorly characterized or understood. This study provides the first large-scale measurement of WM volume reduction in children with AS. Furthermore, we probed the possibility of underlying WM neuropathology by examining the progression of myelination in an AS mouse model.

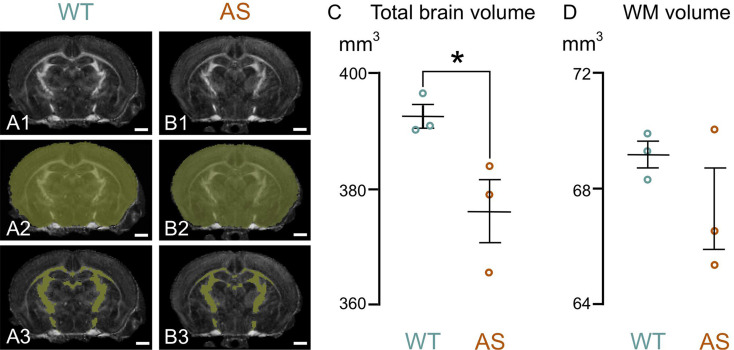
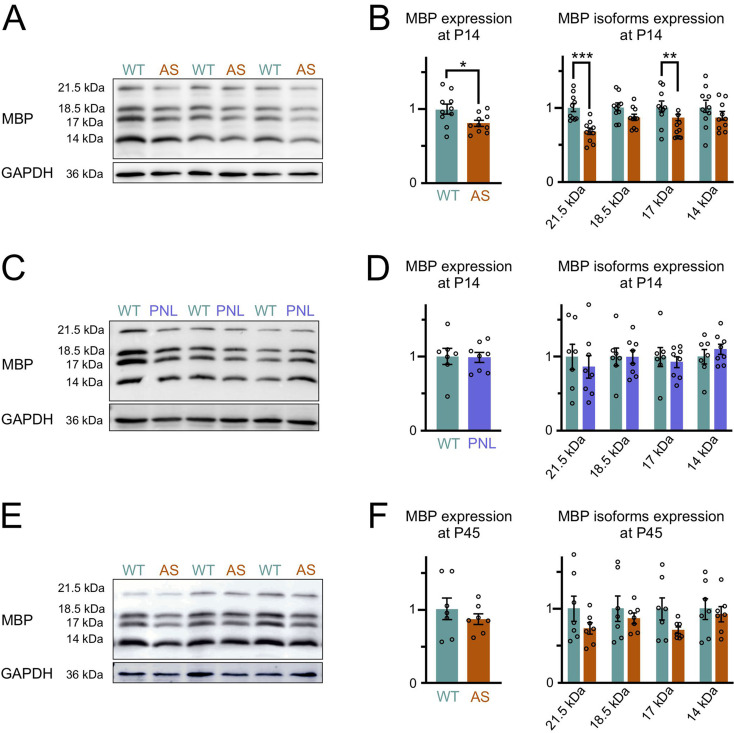
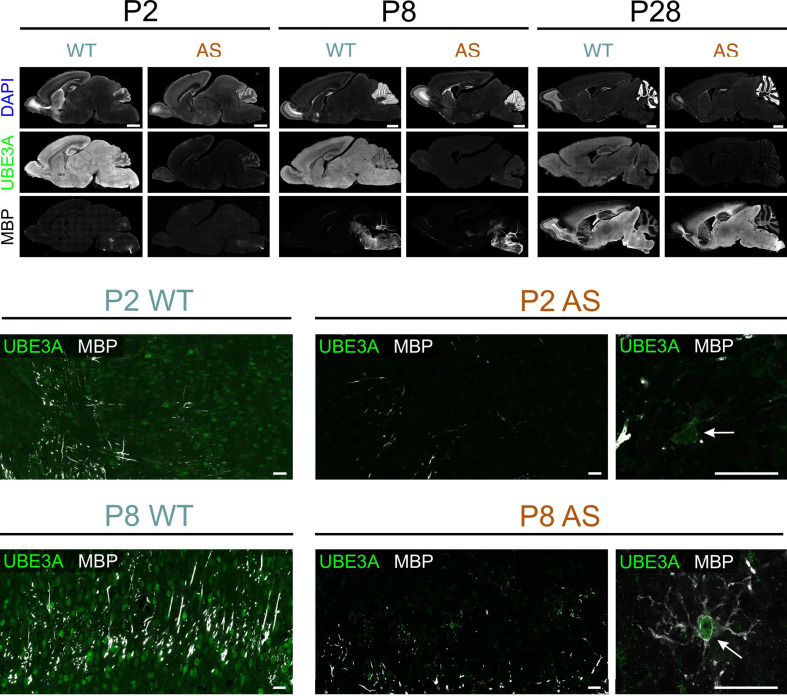
Methods: We conducted magnetic resonance imaging (MRI) on children with AS (n = 32) and neurotypical controls (n = 99) aged 0.5-12 years. In parallel, we examined myelination in postnatal Ube3a maternal-null mice (Ube3am-/p+; AS model), Ube3a paternal-null mice (Ube3am+/p-), and wildtype controls (Ube3am+/p+) using MRI, immunohistochemistry, western blotting, and electron microscopy.

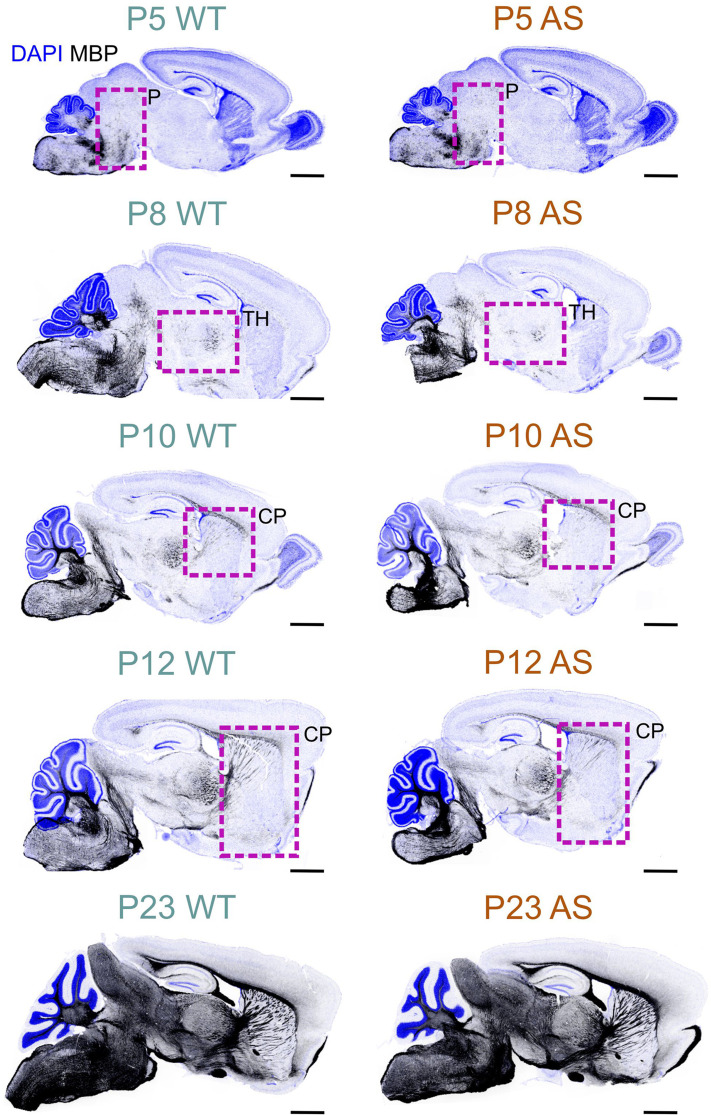
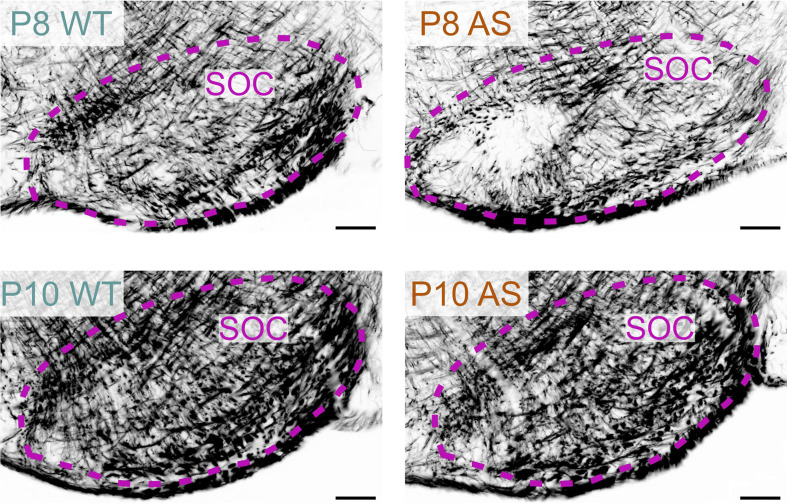
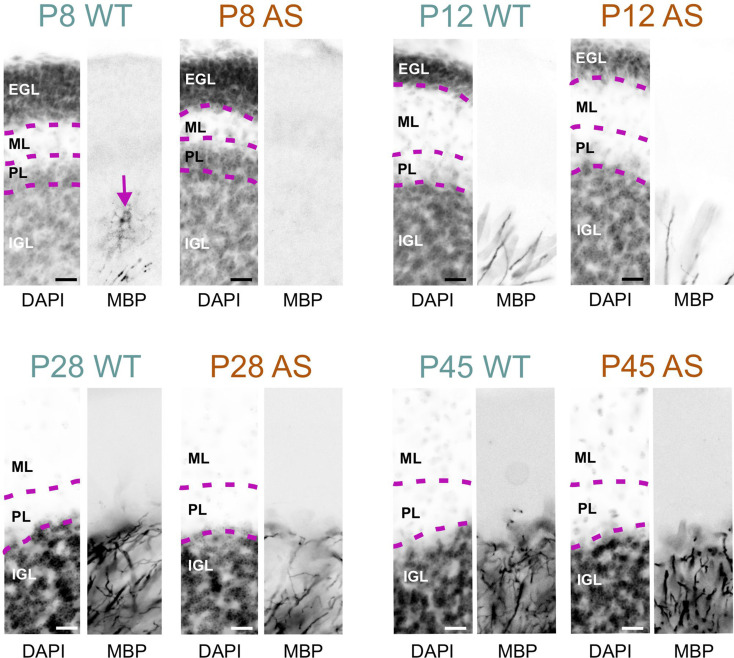
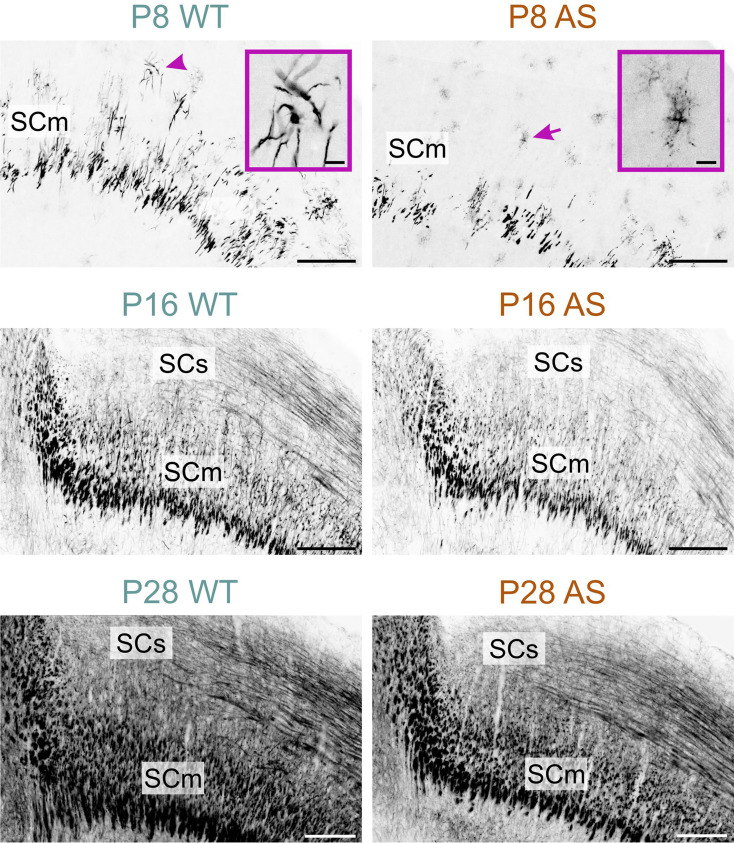
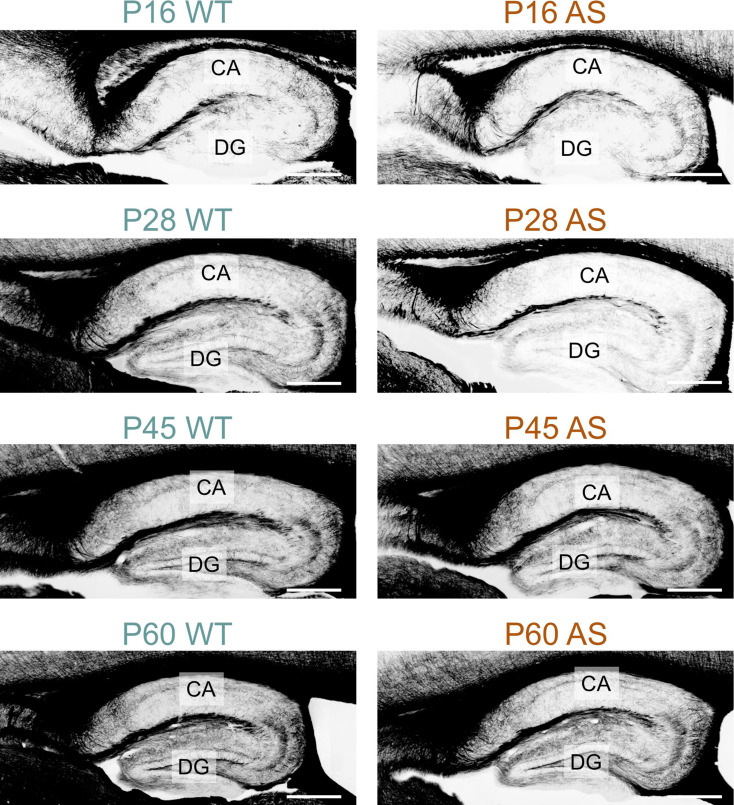
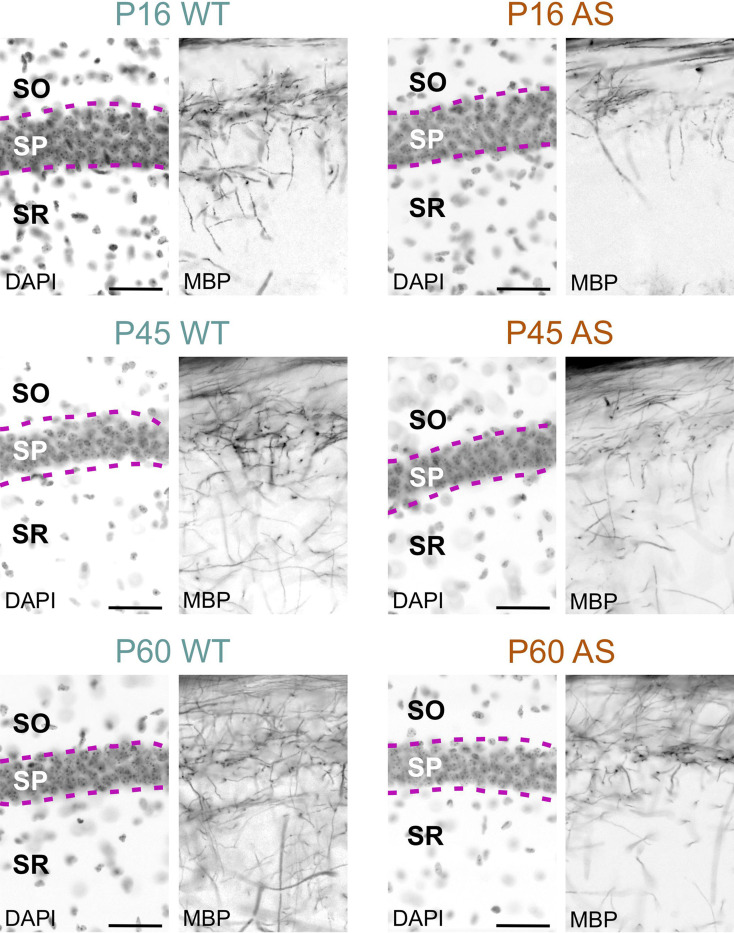
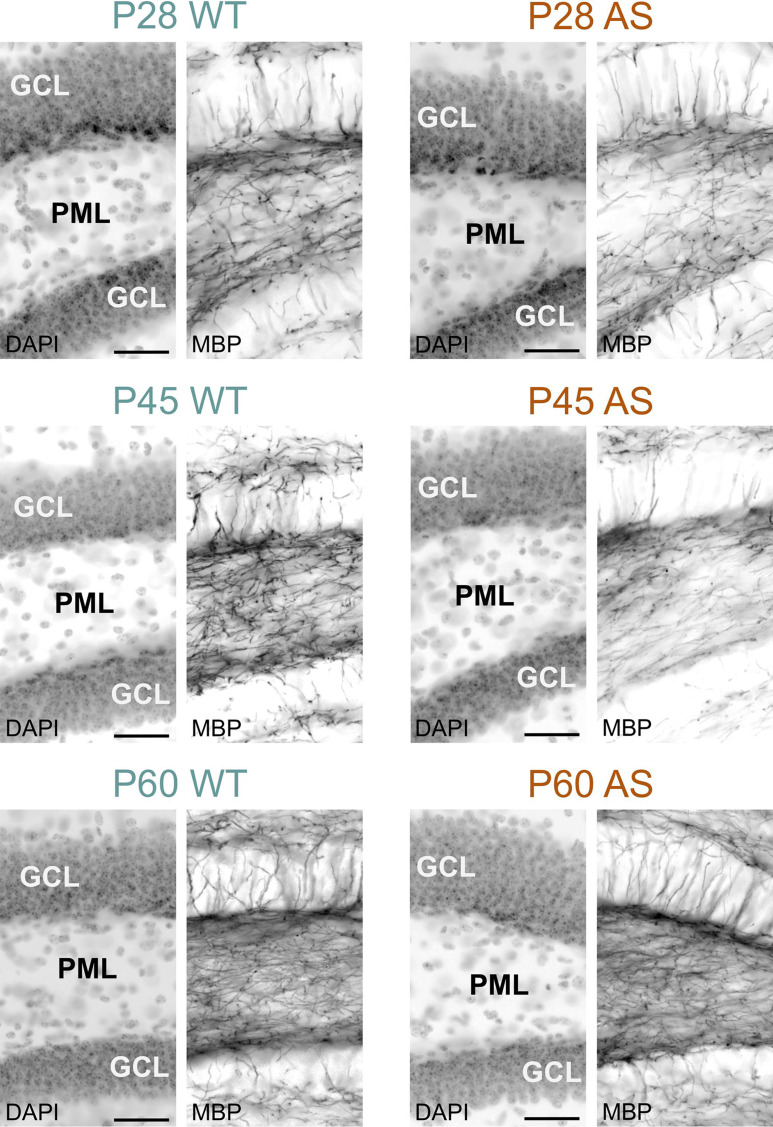
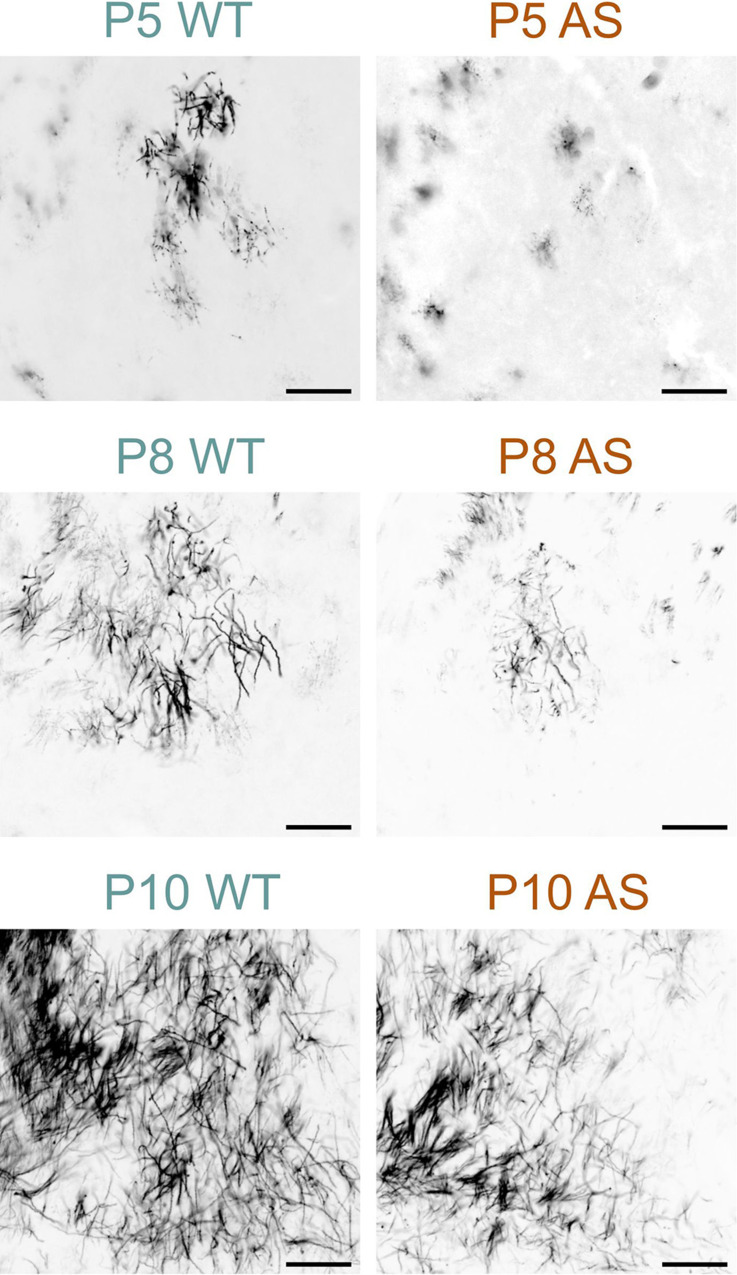
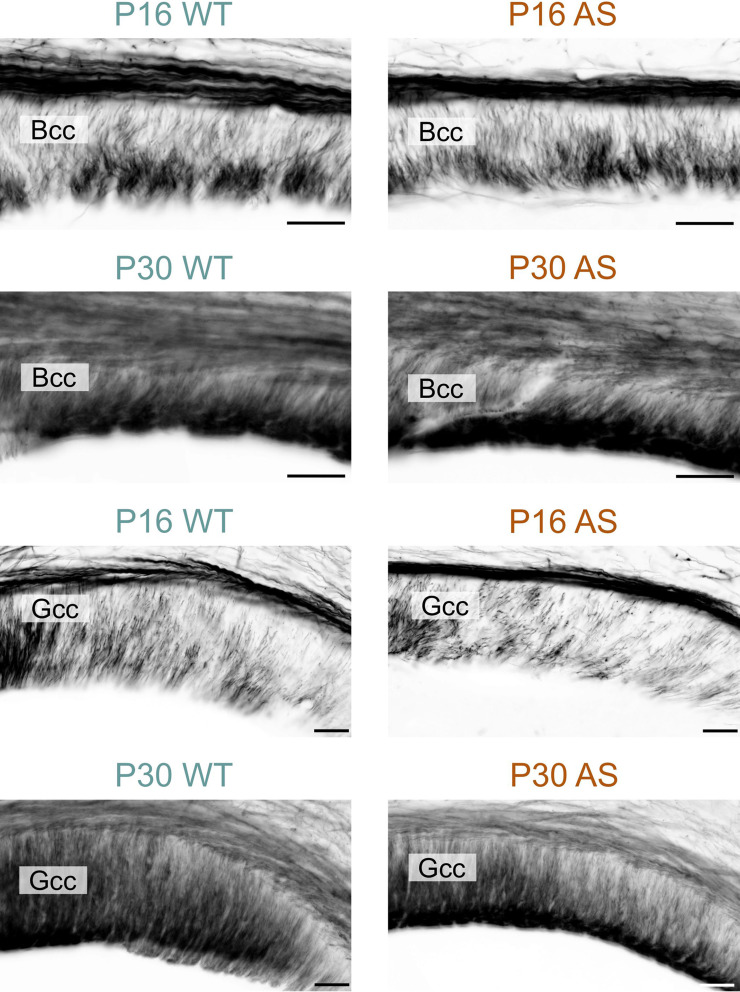
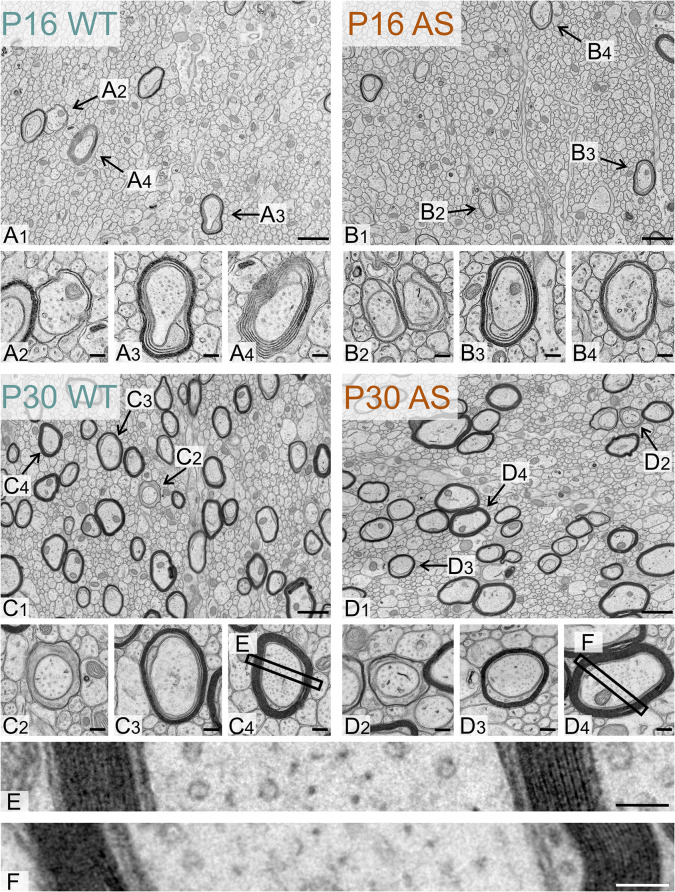
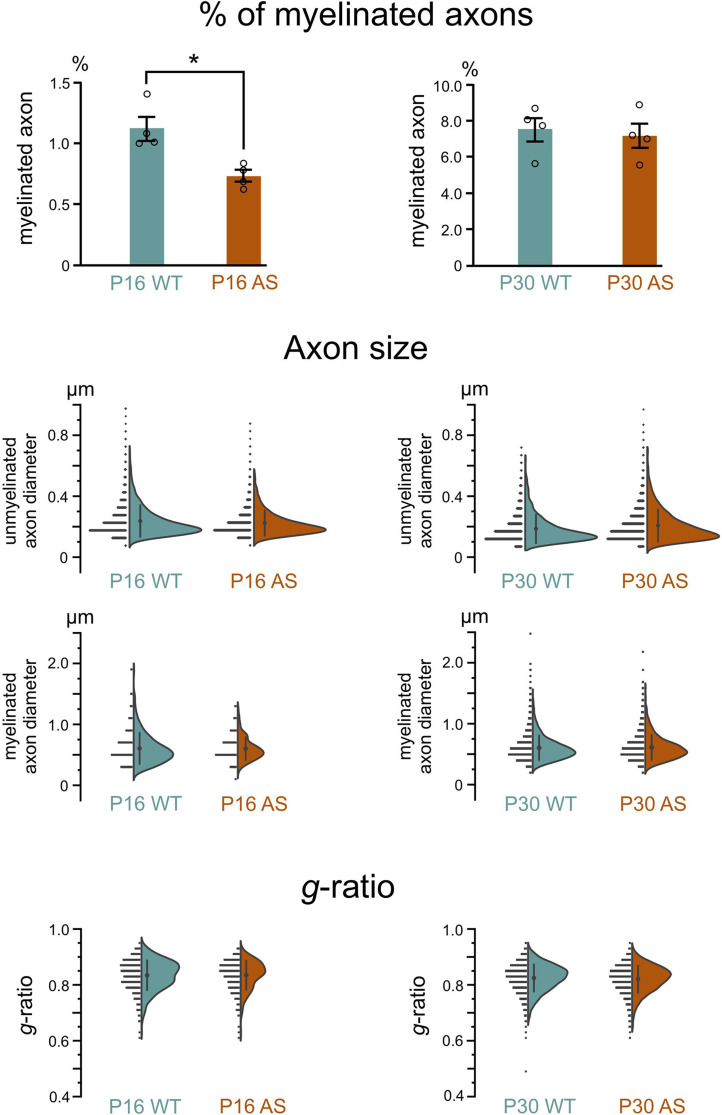
Results: Our data revealed that AS individuals exhibit significant reductions in brain volume by ~ 1 year of age, and by 6-12 years of age WM is reduced by 26% and gray matter by 21%-approximately twice the reductions observed in the adult AS mouse model. Our AS mouse model saw a global delay in the onset of myelination, which normalized within days (likely corresponding to months or years in human development). This myelination delay is caused by the loss of UBE3A in neurons rather than UBE3A haploinsufficiency in oligodendrocytes. Interestingly, ultrastructural analyses did not reveal abnormalities in myelinated or unmyelinated axons.

Limitations: It is difficult to extrapolate the timing and duration of the myelination delay observed in AS model mice to individuals with AS.

Conclusions: This study reveals WM deficits as a hallmark in children with AS, demonstrating for the first time that these deficits are already apparent at 1 year of age. Parallel studies in a mouse model of AS show these deficits occur alongside the delayed onset of myelination, which results from the loss of neuronal (but not glial) UBE3A, though the causal relationship between these phenotypes remains to be determined. These findings emphasize the potential of WM as both a therapeutic target for interventions and a valuable biomarker for tracking the progression of AS and the effectiveness of potential treatments.

Keywords: Magnetic resonance imaging; Microcephaly; Myelin basic protein; Myelination; UBE3A; White matter.


Conflict of interest statement

Ethics approval and consent to participate: All procedures related to the care and treatment of animals followed institutional and NIH guidelines, and all animal use protocols were reviewed and approved by the UNC Institutional Animal Care and Use Committee. Parents of AS and NT individuals provided informed consent, and the institutional review board approved the research protocol. Competing interests: The authors declare no competing interests.

Figures

Fig. 1
Fig. 1
Developmental trajectory of brain volume in neurotypical and AS individuals. Representative axial, coronal, and sagittal orientations of MRI scans from (A) a 4-year-old neurotypical (NT) control and (B) a 4-year-old individual with AS. Regions marked in yellow represent the segmented white matter (WM). (C) Quantification of total brain volume in NT controls and individuals with AS from 0.5 to 12 years of age. AS children had significantly smaller total brain volume from 0.5–12 years compared to NT controls (F1,234 = 28.82, p < 0.001, covarying for age, sex, scanner, group x age). Quantification of (D) WM volume and (E) gray matter (GM) volume in NT controls and individuals with AS from 1 to 12 years of age. AS children had significantly smaller WM (F1,103 = 24.46, p < 0.001) and GM (F1,99 = 34.98, p < 0.001) volumes from 1–12 years of age compared to NT controls. The boxplots show the (F) WM volumes and (G) GM volumes in NT controls and AS individuals from 6 to 12 years, corresponding to the age data points in dotted rectangles in (D) and (E). WM volume is decreased by 26.5% and GM volume is decreased by 21.6% in AS children compared to NT controls between 6 to 12 years. The ‘+’ in (F) and (G) depicts the group means from 1–6 years
Fig. 2
Fig. 2
Total brain and WM volume in developing WT and AS mice. A1, B1: show representative Fractional Anisotropy (FA) maps of WT (A1) and AS (B1) mice brains at P14, obtained through diffusion tensor imaging. A2, B2: highlights the mask used to determine total brain volume (yellow overlay). A3, B3: show segmented white matter (yellow overlay). C, D: quantification of total brain volume (C) and white matter volume (D) in WT and AS mice at P14. Data are presented as mean ± standard error of the mean. Scale bars = 1mm
Fig. 3
Fig. 3
Delayed myelination in AS mouse brain (A) Representative Western blots for MBP and GAPDH loading control protein in P14 forebrain lysates from littermate pairs of Ube3am−/p+ (AS) and wild-type (WT) mice. (B) Quantification of Western blotting for total MBP content (sum of 21.5, 18.5, 17 and 14 kDa isoforms). The total MBP content is significantly reduced in the forebrains of AS compared to WT mice (WT n = 10, AS n = 10, unpaired two-tailed t-test, P = 0.026). Quantification of Western blotting for individual MBP isoforms (unpaired two-tailed t-test, 21.5 kDa: P = 0.0002, 18.5 kDa: P = 0.06, 17 kDa: P = 0.005, 14 kDa: P = 0.25). (C) Representative Western blots for MBP and GAPDH loading control protein in P14 forebrain lysates from littermate pairs of paternal Ube3a-null model (Ube3am+/p−, PNL) and WT mice. (D) Quantification of Western blotting for total MBP content (WT n = 7, PNL n = 8, unpaired two-tailed t-test, P = 0.93). Quantification of Western blotting for individual MBP isoforms (unpaired two-tailed t-test, 21.5 kDa: P = 0.6, 18.5 kDa: P = 0.97, 17 kDa: P = 0.6, 14 kDa: P = 0.42). (E) Representative Western blots for MBP and GAPDH loading control protein in P45 forebrain lysates from littermate pairs of AS and WT mice. (F) Quantification of Western blotting for total MBP content (WT n = 7, AS n = 7, unpaired two-tailed t-test, P = 0.412). Quantification of Western blotting for individual MBP isoforms (unpaired two-tailed t-test, 21.5 kDa: P = 0.18, 18.5 kDa: P = 0.47, 17 kDa: P = 0.09, 14 kDa: P = 0.67). Data are mean ± SEM
Fig. 4
Fig. 4
Multiple labeling for MBP and UBE3A in WT and AS mice during development. Upper panel: Overview of MBP, UBE3A, and DAPI labeling in sagittal sections from WT and AS mice at P2, P8, and P28. Middle panel: High magnification images from midbrain at P2. Arrow points to a premyelinating oligodendrocyte in AS tissue that expresses UBE3A while neighboring cells show minimal UBE3A staining. Lower panel: High magnification images from midbrain at P8. Arrow points to a premyelinating oligodendrocyte in AS tissue that expresses UBE3A Scale bars: upper panel = 1 mm, middle and lower panel = 25 μm
Fig. 5
Fig. 5
MBP developmental profile in the WT and AS mouse brain. Immunofluorescence staining for MBP (black) and DAPI (blue) in sagittal brain sections of WT and AS mice at P5 through P23. Boxes highlight regions with notably reduced MBP staining in AS mice compared to WT mice. Scale bars = 1 mm. P, Pons; TH, Thalamus; CP, caudoputamen
Fig. 6
Fig. 6
Delayed myelination in the AS hindbrain. Immunofluorescence staining for MBP in the superior olivary complex of WT mouse and AS littermate at P8 and P10. Scale bars = 100 µm. SOC, superior olivary complex
Fig. 7
Fig. 7
Delayed myelination in the AS cerebellar cortex. Immunofluorescence staining for DAPI and MBP in the cerebellar cortex of WT mice and AS littermates from P8 to P45. Arrow shows MBP staining along an oligodendrocyte in the WT cerebellar cortex at P8. Scale bars = 20 µm. EGL, external granule layer; ML, molecular layer; PL, Purkinje cell layer; IGL; inner granule layer
Fig. 8
Fig. 8
Delayed myelination in the AS midbrain. Immunofluorescence staining for MBP in the midbrain of WT mice and AS littermates at P8, P16, and P28. The arrowhead indicates active myelination, while the arrow points to premyelinating oligodendrocytes. Insets provide a close-up view of the areas indicated by the arrowhead and the arrow. Scale bars = 200 μm; inset = 20 μm. SCm, superior colliculus motor related; SCs, superior colliculus sensory related
Fig. 9
Fig. 9
Delayed myelination in the AS hippocampal formation. Immunofluorescence is staining for MBP in the hippocampal formation of WT mice and AS littermates from P16 to P60. Scale bars = 400 µm. CA, Cornu ammonis; DG, Dentate gyrus
Fig. 10
Fig. 10
Delayed myelination in the AS CA1 hippocampus. Immunofluorescence staining for DAPI and MBP in the hippocampal CA1 region of WT mice and AS littermates at P16, P45, and P60. Scale bars = 50 µm. SO, stratum oriens; SP, stratum pyramidale; SR, stratum radiatum
Fig. 11
Fig. 11
Delayed myelination in the AS dentate gyrus. Immunofluorescence staining for DAPI and MBP in the dentate gyrus of WT mice and AS littermates at P28, P45, and P60. Scale bars = 50 µm. GCL, granule cell layer; PML, polymorph layer
Fig. 12
Fig. 12
Delayed myelination in the AS globus pallidus. Immunofluorescence staining for MBP in the globus pallidus of WT mice and AS littermates at P5, P8, and P10. Scale bars = 100 µm
Fig. 13
Fig. 13
Delayed myelination in the AS corpus callosum. Immunofluorescence staining for MBP in the body and genu of the corpus callosum in WT mice and AS littermates at P16 and P30. Scale bars = 50 µm. Bcc, body of corpus callosum; Gcc, genu of corpus callosum
Fig. 14
Fig. 14
Ultrastructure of the developing WT and AS corpus callosum. Representative electron micrographs of the corpus callosum body in (A1) a WT mouse and (B1) a AS littermate at P16. Representative electron micrographs showing examples of myelinated axons observed in (A2, A3, A4) a WT mouse and (B2, B3, B4) an AS littermate at P16. Representative electron micrographs of the corpus callosum body in (C1) a WT mouse and (D1) a AS littermate at P30. Representative electron micrographs showing examples of myelinated axons observed in (C2, C3, C4) a WT mouse and (D2, D3, D4) a AS littermate at P30. (E) and (F) Representative electron micrographs showing layers of compacted myelin around the axons shown in C4 and D4. Scale bars: (A1, B1, C1, D1) = 500 nm; (A2-4), (B2-4), (C2-4), (D2,4) = 125 nm, (E), (F) = 50 nm
Fig. 15
Fig. 15
Percentage of myelinated axons, axon size, and g-ratio in the developing WT and AS corpus callosum. Quantification of percent myelinated axons in the body of corpus callosum (Bcc) in WT and AS mice at P16 and P30 (n = 4 mice for each genotypic group, unpaired two-tailed t-test, P = 0.01 for P16, P = 0.72 for P30). Data are mean ± SEM. Distribution of diameters of unmyelinated and myelinated axons in WT and AS mice Bcc at P16 and P30. Distribution of g-ratios of myelinated axons in WT and AS mice Bcc at P16 and P30

Update of

References

    1. Mabb AM, Judson MC, Zylka MJ, Philpot BD. Angelman syndrome: insights into genomic imprinting and neurodevelopmental phenotypes. Trends Neurosci. 2011;34:293–303. 10.1016/j.tins.2011.04.001. - PMC - PubMed
    1. Margolis SS, Sell GL, Zbinden MA, Bird LM. Angelman Syndrome Neurother. 2015;12:641–50. 10.1007/s13311-015-0361-y. - PMC - PubMed
    1. Williams CA, Driscoll DJ, Dagli AI. Clinical and genetic aspects of Angelman syndrome. Genet Med. 2010;12:385–95. 10.1097/GIM.0b013e3181def138. - PubMed
    1. Williams CA, et al. Angelman syndrome 2005: updated consensus for diagnostic criteria. Am J Med Genet A. 2006;140:413–8. 10.1002/ajmg.a.31074. - PubMed
    1. Bindels-de Heus K, et al. An overview of health issues and development in a large clinical cohort of children with Angelman syndrome. Am J Med Genet A. 2020;182:53–63. 10.1002/ajmg.a.61382. - PMC - PubMed

Publication types

MeSH terms

Substances

LinkOut - more resources