. 2024 Dec;14(12):e70187.
doi: 10.1002/brb3.70187.

Propofol Suppresses Ferroptosis via Modulating eNOS/NO Signaling Pathway to Improve Traumatic Brain Injury

Affiliations

Propofol Suppresses Ferroptosis via Modulating eNOS/NO Signaling Pathway to Improve Traumatic Brain Injury

Zi-Lei Zheng et al. Brain Behav. 2024 Dec.

Abstract

Purpose: This study aims to explore the neuroprotective effect of propofol in improving traumatic brain injury (TBI) by inhibiting ferroptosis through the modulation of the endothelial nitric oxide (NO) synthase (eNOS)/NO signaling pathway.

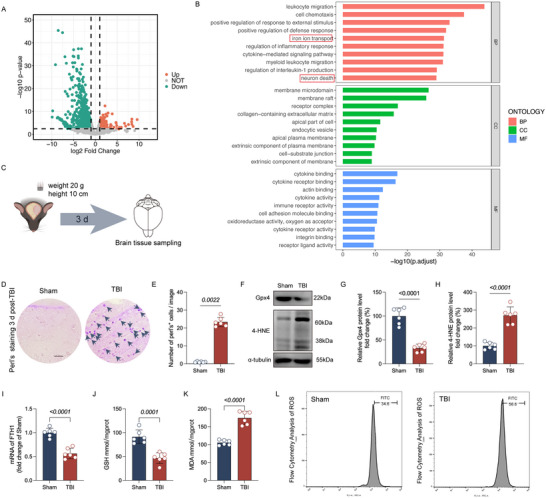
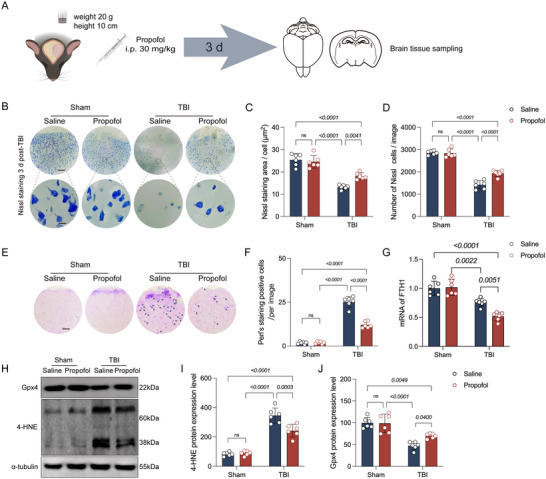
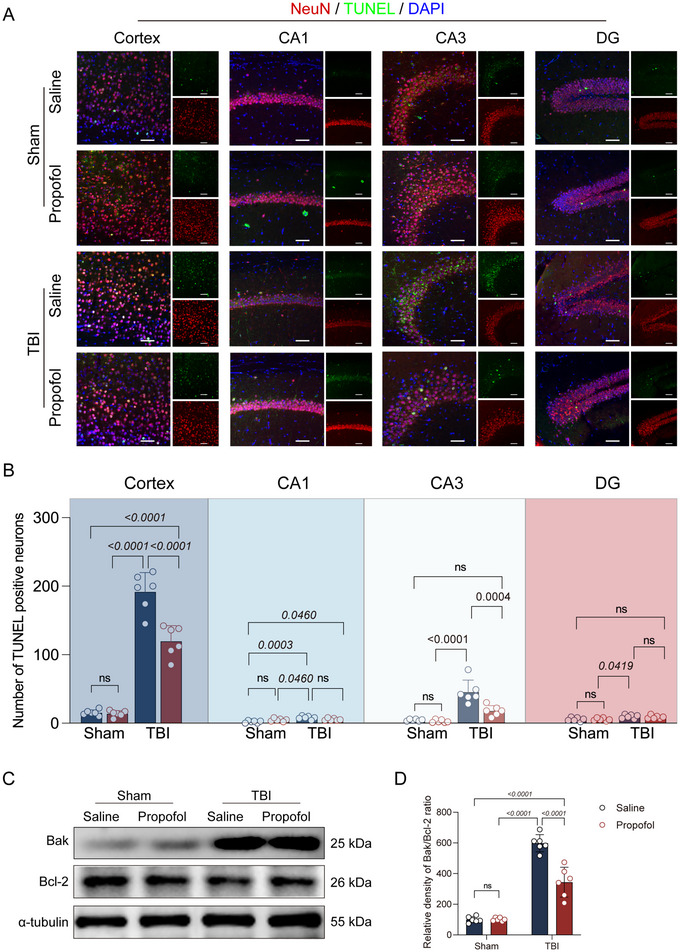
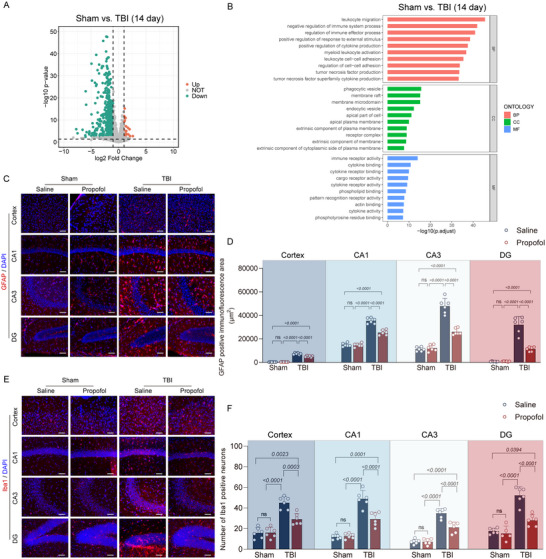
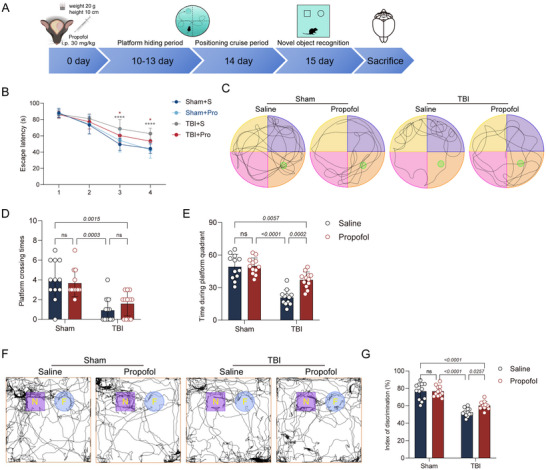
Methods: The GSE173975 dataset was used to analyze the differentially expressed genes between TBI and sham surgery control groups in the short and long term. A TBI model was established in 2-month-old male SPF C57BL/6 mice by impact exposure of the exposed dura mater. After the establishment of the TBI model, propofol (30 mg/kg) or saline was administered via intraperitoneal injection for intervention. Nissl staining and Perls staining were employed to assess neuronal function and iron deposition, respectively. Western blot technology was employed to detect the expression of proteins related to ferroptosis. Immunofluorescence staining of astrocytes and microglia was utilized to assess the neuroinflammatory response induced by TBI. The Morris water maze (MWM) and novel object recognition (NOR) tests were employed to assess cognitive dysfunction induced by TBI.

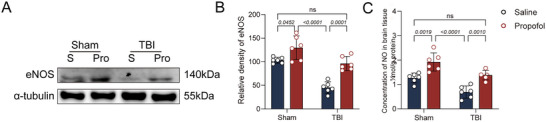
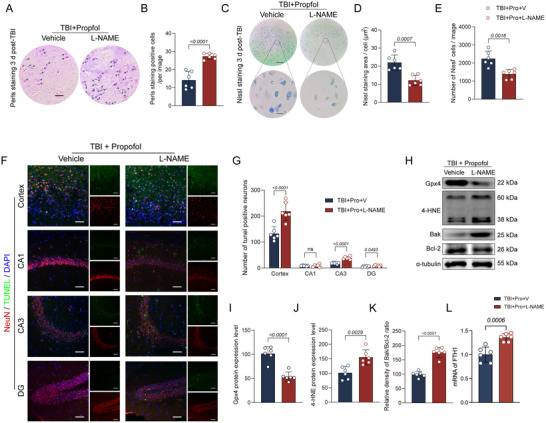
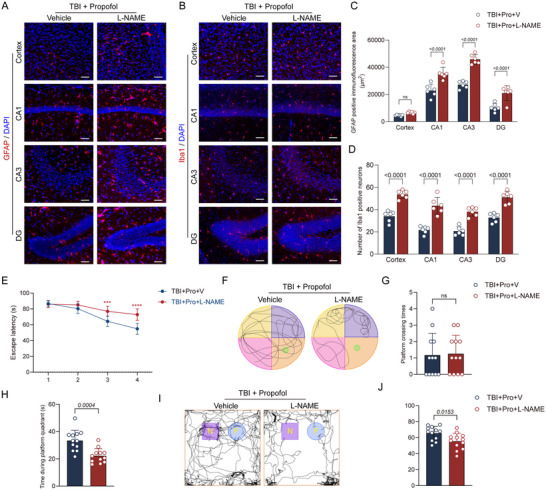
Findings: Bioinformatics analysis revealed aberrant gene expression associated with iron transport, neuronal death, and inflammatory response in the initial stages of TBI. Long-term abnormalities were predominantly linked to genes involved in inflammatory response. Perls staining and protein expression analysis confirmed the occurrence of iron deposition and ferroptosis following TBI. Propofol treatment significantly reduced iron deposition and ferroptosis induced by TBI. Nissl staining demonstrated enhanced neuronal function, while TUNEL staining indicated reduced neuronal apoptosis. Immunofluorescence analysis demonstrated that propofol significantly reduced the proliferation of astrocytes and activation of microglia induced by TBI in the long term. The results of MWM and NOR tests indicated that propofol significantly improved the long-term cognitive dysfunction induced by TBI. Propofol exerts neuroprotective effects by increasing the expression of eNOS protein and the content of NO. The neuroprotective effects of propofol can be reversed by the eNOS inhibitor L-NAME.

Conclusion: Propofol significantly improves the prognosis of TBI by inhibiting ferroptosis through the modulation of the eNOS/NO signaling pathway. The study results provide a scientific basis for the clinical use of propofol as a neuroprotective agent and offer a new direction for the development of new treatment strategies for TBI.

Keywords: eNOS; ferroptosis; nitric oxide; propofol; traumatic brain injury.


Conflict of interest statement

The authors declare no conflicts of interest.

Figures

FIGURE 1
FIGURE 1
Ferroptosis as a significant contributor to TBI Pathology. (A) One‐day post TBI, a volcano plot was utilized to illustrate the differentially expressed genes between the sham and TBI groups, with the criteria of |log2 (fold change, FC)| ≥ 1 and a p < 0.05 to distinguish upregulated and downregulated genes. (B) Bar charts were used to present the results of the gene ontology (GO) enrichment analysis. (C) TBI model was prepared by impacting the exposed dura mater after craniotomy with a 20 g weight dropped from a height of 10 cm, and brain tissue sampling was conducted 3 days post‐model preparation. (D) Representative images of Perls staining from both groups of mice. (E) Comparison of the number of positively stained cells in Perls staining between the two groups of mice (n = 6 per group). (F) Representative immunoblots of Gpx4 and 4‐HNE proteins from both groups of mice are shown. (G, H). Comparison of the expression levels of Gpx4 and 4‐HNE proteins between the two groups of mice (n = 6 per group). (I) Comparison of the expression levels of FTH1 mRNA between the two groups of mice (n = 6 per group). (J, K) Comparison of the levels of GSH and MDA between the two groups of mice (n = 6 per group). (L) Representative images of flow cytometry analysis of ROS (n = 6 per group). Data are represented as mean ± standard deviation, and statistical analysis was performed using Student's t‐test, with p values indicated directly on the bar charts.
FIGURE 2
FIGURE 2
Propofol exerts neuroprotection by inhibiting ferroptosis. (A) Schematic of the experimental procedure. Following the establishment of the TBI model, intervention was conducted via intraperitoneal injection of propofol (dose: 30 mg/kg), with brain tissue samples collected 3 days post‐intervention. (B) Representative Nissl staining images for the four groups of mice, with scale bars = 50 or 10 µm. (C, D) Comparative analysis of Nissl body count and positive area per field of view for the four groups of mice (n = 6 per group). (E) Representative images of Perls staining for the four groups of mice. (F) Comparative analysis of the number of positively stained cells in Perls staining for the four groups of mice (n = 6 per group). (G, H) Representative immunoblots of Gpx4 and 4‐HNE proteins from the four groups of mice. (G) Comparison of the expression levels of FTH1 mRNA between the four groups of mice (n = 6 per group). (I, J) Comparative analysis of the expression levels of Gpx4 and 4‐HNE proteins for the four groups of mice (n = 6 per group). Data are presented as mean ± standard deviation, and statistical analysis was conducted using ANOVA, with p values directly indicated on the bar charts.
FIGURE 3
FIGURE 3
Propofol reduces neuronal apoptosis by inhibiting ferroptosis. (A) Representative TUNEL fluorescence images are displayed for the damaged cortical area, hippocampal CA1 region, CA3 region, and DG region across four groups of mice. In the images, red labeling indicates neurons, green labeling signifies apoptotic cells, and blue labeling represents cell nuclei, with a scale bar set at 50 µm. (B) A comparison of the number of apoptotic neurons in the damaged cortical area, hippocampal CA1 region, CA3 region, and DG region among the four groups of mice is presented (n = 6 per group). (C) Representative immunoblots for Bak, Bcl‐2, and α‐tubulin proteins from the four groups of mice are shown. (D) A comparison of the Bak/Bcl‐2 ratio among the four groups of mice is provided (n = 6 per group). Data are expressed as the mean ± standard deviation and were statistically analyzed using ANOVA, with p values directly indicated on the bar charts.
FIGURE 4
FIGURE 4
Propofol can inhibit persistent neuroinflammation caused by ferroptosis. (A) At 14 days post‐TBI, a volcano plot illustrates differentially expressed genes between sham and TBI groups, using |log2 (fold change, FC)| ≥ 1 and a p < 0.05 as thresholds to differentiate upregulated and downregulated genes. (B) Bar charts display the results of Gene Ontology (GO) enrichment analysis. (C) Representative GFAP immunofluorescence images from the damaged cortical area, hippocampal CA1 region, CA3 region, and DG region of mice in the four groups are shown. (D) A comparison of GFAP‐positive area in the damaged cortical area, hippocampal CA1 region, CA3 region, and DG region among the four groups of mice is presented (n = 6 per group). E. Representative Iba1 immunofluorescence images from the damaged cortical area, hippocampal CA1 region, CA3 region, and DG region of mice in the four groups are shown. (F) A comparison of the number of Iba1‐positive cells in the damaged cortical area, hippocampal CA1 region, CA3 region, and DG region among the four groups of mice is presented (n = 6 per group). Data are expressed as mean ± standard deviation and were statistically analyzed using ANOVA, with p values indicated on the bar charts.
FIGURE 5
FIGURE 5
Propofol can improve the long‐term cognitive dysfunction induced by TBI. (A) Schematic of the experimental procedure. After establishing the TBI model, intervention was conducted via intraperitoneal propofol injection (dose: 30 mg/kg). MWM training was conducted from Days 10 to 13 post‐TBI, with testing on Day 14, NOR testing on Day 15, and subsequent brain tissue sampling. (B) Comparison of escape latencies during the MWM training period among the four groups of mice. Statistical analysis was performed using two‐way repeated measures ANOVA, with *p < 0.05 and ****p < 0.0001. (C) Representative traces of the mice's paths in the MWM are shown for the four groups. (D, E) Comparison of platform crossing times and time spent in the target quadrant among the four groups of mice (n = 6 per group). (F) Representative traces of the mice in the NOR test are shown for the four groups, with N representing the novel object and F representing the familiar object. (G) Comparison of the discrimination index among the four groups of mice (n = 6 per group). Data are presented as mean ± standard deviation and were statistically analyzed using ANOVA, with p values indicated on the bar charts.
FIGURE 6
FIGURE 6
The neuroprotective effect of propofol may be associated with promoting eNOS to produce nitric oxide (NO). (A) Representative immunoblots of eNOS and α‐tubulin proteins from four groups of mice. (B) Comparative analysis of eNOS protein expression among the four groups of mice (n = 6). (C) Comparison of NO concentrations in brain tissue among the four groups of mice (n = 6). Data are presented as mean ± standard deviation and were statistically analyzed using ANOVA, with p values indicated on the bar charts.
FIGURE 7
FIGURE 7
The eNOS protein inhibitor L‐NAME can reverse the early neuroprotective effects of propofol on TBI. (A) Representative images of Perls staining from two groups of mice are displayed. (B) A comparison of the number of positively stained cells in Perls staining between the two groups of mice (n = 6 per group) is presented. (C) Representative images of Nissl staining from two groups of mice are shown, with scale bars at 50 or 10 µm. (D, E) Bar graphs illustrate the statistical analysis of Nissl body count and positive area per field of view for four groups of mice (n = 6 per group). (F) Representative TUNEL fluorescence images from the damaged cortical area, hippocampal CA1 region, CA3 region, and DG region of two groups of mice are displayed. Red labeling indicates neurons, green labeling indicates apoptotic cells, and blue labeling indicates cell nuclei, with a scale bar at 50 µm. (G) A comparison of the number of apoptotic neurons in the damaged cortical area, hippocampal CA1 region, CA3 region, and DG region among four groups of mice (n = 6 per group) is presented. (H) Representative immunoblots of Gpx4, 4‐HNE, Bak, Bcl‐2, and α‐tubulin proteins from two groups of mice are shown. (I–K) Comparisons of Gpx4 protein expression, 4‐HNE protein expression, and the Bak/Bcl‐2 ratio between the two groups of mice (n = 6 per group) are provided. (L) Comparison of the expression levels of FTH1 mRNA between the two groups of mice (n = 6 per group). Data are presented as mean ± standard deviation and statistically analyzed using Student's t‐test, with p values on the bar charts.
FIGURE 8
FIGURE 8
The eNOS protein inhibitor L‐NAME can reverse the effect of propofol in improving long‐term outcomes after TBI. (A, B) Representative GFAP and Iba1 immunofluorescence images from the damaged cortical area, hippocampal CA1 region, CA3 region, and DG region of two groups of mice are shown. (C, D) Comparisons of GFAP‐positive area and Iba1‐positive cell counts in the damaged cortical area, hippocampal CA1 region, CA3 region, and DG region between two groups of mice are presented (n = 6 per group). (E) The escape latencies during the MWM training period for two groups of mice were compared, and two‐way repeated measures ANOVA was used for statistical analysis, with ****p < 0.0001. (F) Representative traces of the mice in the MWM are shown. (G, H) Comparisons of platform crossing times and time spent in the target quadrant between two groups of mice are presented (n = 6 per group). (I) Representative traces of the mice in the NOR test are shown, with N representing the novel object and F representing the familiar object. (J) A comparison of the discrimination index between two groups of mice is presented (n = 6 per group). Data are expressed as mean ± standard deviation and were statistically analyzed using Student's t‐test, with p values indicated on the bar charts.

Similar articles

References

    1. Badgley, M. A. , Kremer D. M., Maurer H. C., et al. 2020. “Cysteine Depletion Induces Pancreatic Tumor Ferroptosis in Mice.” Science 368: 85–89. 10.1126/science.aaw9872. - DOI - PMC - PubMed
    1. Baechler, B. L. , Bloemberg D., and Quadrilatero J.. 2019. “Mitophagy Regulates Mitochondrial Network Signaling, Oxidative Stress, and Apoptosis During Myoblast Differentiation.” Autophagy 15: 1606–1619. 10.1080/15548627.2019.1591672. - DOI - PMC - PubMed
    1. Bagri, K. , Kumar P., and Deshmukh R.. 2021. “Neurobiology of Traumatic Brain Injury.” Brain Injury 35: 1113–1120. 10.1080/02699052.2021.1972152. - DOI - PubMed
    1. Bao, W. D. , Pang P., Zhou X. T., et al. 2021. “Loss of Ferroportin Induces Memory Impairment by Promoting Ferroptosis in Alzheimer's Disease.” Cell Death and Differentiation 28: 1548–1562. 10.1038/s41418-020-00685-9. - DOI - PMC - PubMed
    1. Batsaikhan, B. , Wang J. Y., Scerba M. T., et al. 2019. “Post‐Injury Neuroprotective Effects of the Thalidomide Analog 3,6′‐Dithiothalidomide on Traumatic Brain Injury.” International Journal of Molecular Sciences 20: 502. 10.3390/ijms20030502. - DOI - PMC - PubMed

MeSH terms

LinkOut - more resources