

Characterizing Variability in Non-Invasive Hydration Monitoring Using Raman Spectroscopy
- PMID: 39726183
- PMCID: PMC12287566
- DOI: 10.1177/00037028241307043
Characterizing Variability in Non-Invasive Hydration Monitoring Using Raman Spectroscopy
Abstract
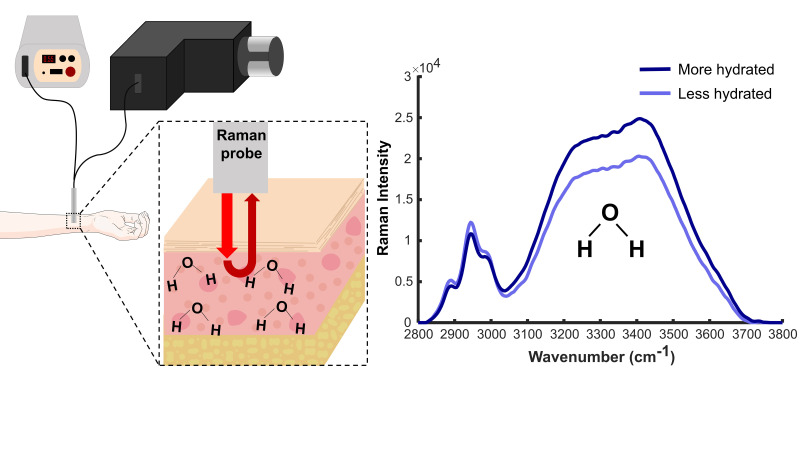
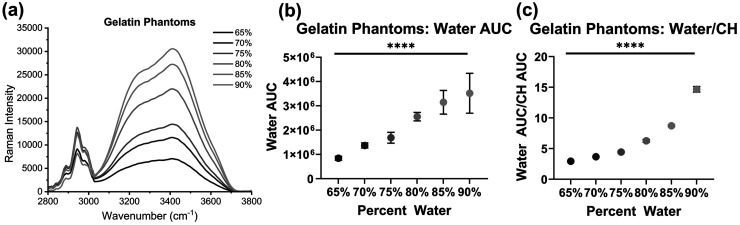
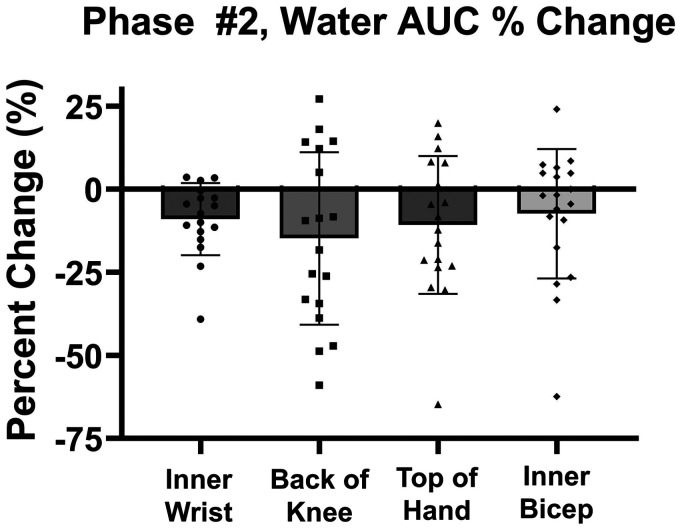
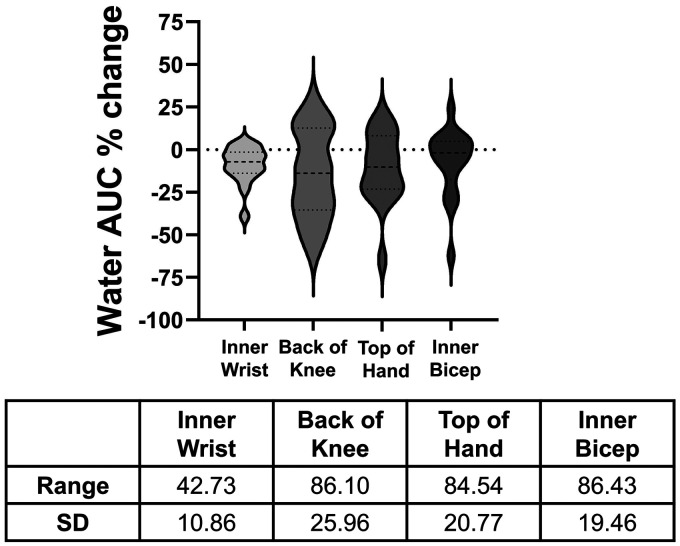
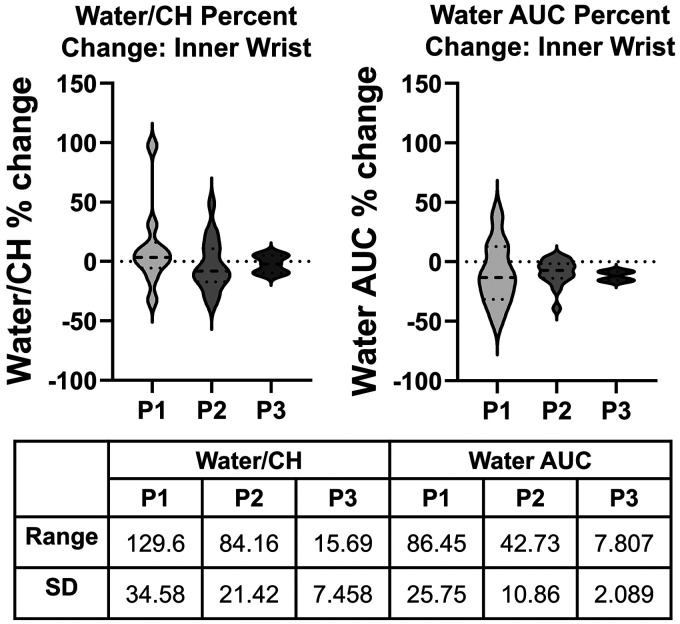
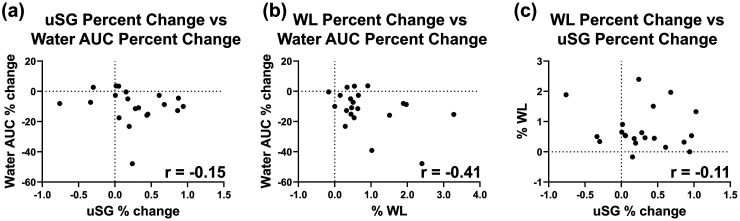
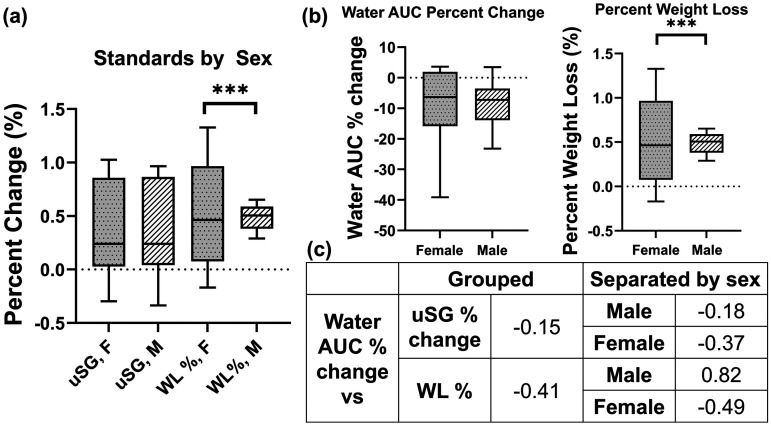
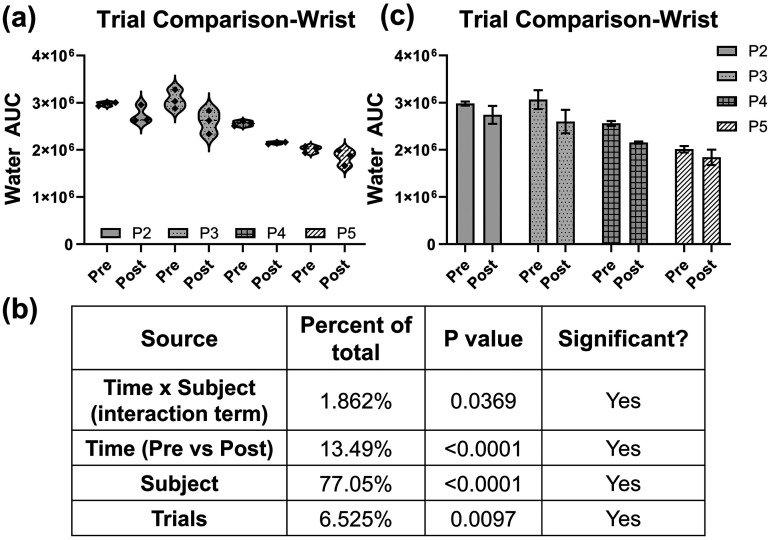
Significant dehydration can increase thermoregulatory and cardiovascular strain and impair physical and cognitive performance. Despite these negative effects, there are currently no objective, non-invasive tools to monitor systemic hydration. Raman spectroscopy is an optical modality with the potential to fill this gap because it is sensitive to water, provides results quickly, and can be applied non-invasively. In this work, high wavenumber Raman spectroscopy has been developed toward detection of systemic hydration via validation with tissue-mimicking phantoms, followed by three in vivo feasibility studies to investigate the relationship between spectral features and systemic hydration. The area under the curve (AUC) of the water bands and the ratio of water bands to CH bands are Raman-derived metrics that can be used to describe systemic hydration. Here, we determined a trend in decreasing water bands AUC after exercise, although the magnitude of the change was highly variable. In investigating the sources of variability, we identified significant inter-subject variability and a failure of current clinical standards to benchmark our developed technique against. Despite the high variability, we found that multiple anatomical locations were suitable for collecting the spectral measurements. While the high degree of variability may confound the use of Raman spectroscopy for non-invasive hydration monitoring, when implementing additional study standardization, significant differences (p <.05) in spectral metrics can be identified before and after exercise. Raman spectroscopy can allow for rapid, non-invasive detection of systemic hydration, which would improve routine hydration monitoring and reduce the incidence of negative side effects associated with dehydration.
Keywords: Raman spectroscopy; dehydration; hydration; in vivo Raman spectroscopy.
Conflict of interest statement
Declaration of Conflicting InterestsThe authors declared no potential conflicts of interest with respect to the research, authorship, and/or publication of this article.
Figures
References
-
- Gonzalez-Alonso J., Mora-Rodriguez R., Below P.R., Coyle E.F.. “Dehydration Reduces Cardiac Output and Increases Systemic and Cutaneous Vascular Resistance During Exercise”. J. Appl. Physiol. 1995. 79(5): 1487–1496. - PubMed
-
- Leiper J.B.. “Intestinal Water Absorption: Implications for the Formulation of Rehydration Solutions”. Int. J. Sports Med. 1998. 19(Suppl. 2): S129–S132. - PubMed
-
- Arnaud M.J.. “Mild Dehydration: A Risk Factor of Constipation?”. Eur. J. Clin. Nutr. 2003. 57(2): S88–S95. - PubMed
MeSH terms
Substances
LinkOut - more resources
Full Text Sources
Medical
Miscellaneous
