

Arrival-Time Parametric Imaging in Contrast-Enhanced Ultrasound for Thyroid Nodule Differentiation
- PMID: 39726208
- PMCID: PMC11686919
- DOI: 10.12659/MSM.945793
Arrival-Time Parametric Imaging in Contrast-Enhanced Ultrasound for Thyroid Nodule Differentiation
Abstract
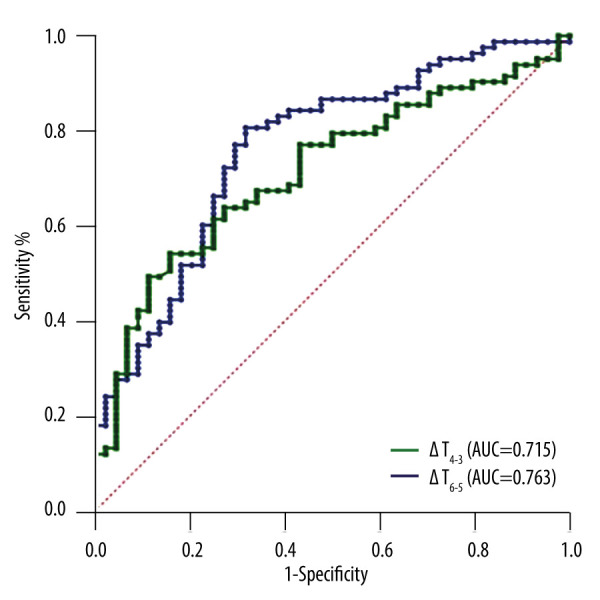
BACKGROUND Solitary thyroid nodules present a challenge in differentiating between benign and malignant conditions using ultrasound (US). Arrival time parameter imaging (At-PI) following contrast-enhanced ultrasound (CEUS) can effectively visualize the vascular architectural patterns of the nodules, providing valuable diagnostic information. This study aimed to explore the application value of At-PI in differentiating thyroid nodules, specifically focusing on a sample of 127 cases. MATERIAL AND METHODS From October 2020 to December 2023, 127 thyroid nodules from 108 patients who underwent ultrasound and CEUS examinations at the General Hospital of Northern Theater Command were reviewed. Pathological outcomes served as the criterion standard, categorizing the nodules into a benign group (44 cases) and a malignant group (83 cases). At-PI was employed to analyze the CEUS videos, allowing for a comparison of parameters between the 2 groups. Additionally, the diagnostic performance of 2 quantitative parameters was assessed using receiver operating characteristic (ROC) curves. RESULTS After conducting the chi-square test, the differences between the 2 groups regarding enhancement time, perfusion pattern, and perfusion defect were found to be statistically significant (P<0.05). There was a significant difference between the 2 groups over the time span (ΔT) (P<0.05). The areas under the curve (AUCs) for ΔT₄₋₃ and ΔT₆₋₅ were 0.715 (95% CI: 0.624-0.805) and 0.763 (95% CI: 0.676-0.851). CONCLUSIONS At-PI can offer more effective parameters for differentiating thyroid nodules. Additionally, some of these parameters exhibit notable diagnostic performance in the detection of thyroid cancer.
Conflict of interest statement
Figures
Similar articles
-
Clinical diagnostic value of contrast-enhanced ultrasound and TI-RADS classification for benign and malignant thyroid tumors: One comparative cohort study.Medicine (Baltimore). 2019 Jan;98(4):e14051. doi: 10.1097/MD.0000000000014051. Medicine (Baltimore). 2019. PMID: 30681562 Free PMC article. Clinical Trial.
-
Diagnostic value of contrast-enhanced ultrasound in solid thyroid nodules with and without enhancement.Endocrine. 2016 Aug;53(2):480-8. doi: 10.1007/s12020-015-0850-0. Epub 2016 Jan 5. Endocrine. 2016. PMID: 26732040
-
Clinical Application of C-TIRADS Category and Contrast-Enhanced Ultrasound in Differential Diagnosis of Solid Thyroid Nodules Measuring ≥1 cm.Med Sci Monit. 2022 Jun 7;28:e936368. doi: 10.12659/MSM.936368. Med Sci Monit. 2022. PMID: 35668611 Free PMC article.
-
The Value of Chinese Thyroid Imaging Report and Data System Combined With Contrast-Enhanced Ultrasound Scoring in Differential Diagnosis of Benign and Malignant Thyroid Nodules.J Ultrasound Med. 2022 Jul;41(7):1753-1761. doi: 10.1002/jum.15858. Epub 2021 Oct 28. J Ultrasound Med. 2022. PMID: 34709672
-
Qualitative analysis of contrast-enhanced ultrasound in the diagnosis of small, TR3-5 benign and malignant thyroid nodules measuring ≤1 cm.Br J Radiol. 2020 Jul;93(1111):20190923. doi: 10.1259/bjr.20190923. Epub 2020 Apr 9. Br J Radiol. 2020. PMID: 32242748 Free PMC article.
References
-
- Boucai L, Zafereo M, Cabanillas ME. Thyroid cancer: A review. JAMA. 2024;331(5):425–35. - PubMed
-
- Siegel RL, Miller KD, Wagle NS, Jemal A. Cancer statistics, 2023. Cancer J Clin. 2023;73(1):17–48. - PubMed
-
- Chen DW, Lang BHH, McLeod DSA, et al. Thyroid cancer. Lancet. 2023;401(10387):1531–44. - PubMed
MeSH terms
Substances
LinkOut - more resources
Full Text Sources
Research Materials
Miscellaneous
