. 2025 Jan;45(1):e16208.
doi: 10.1111/liv.16208.

Ganglioside GD2 Contributes to a Stem-Like Phenotype in Intrahepatic Cholangiocarcinoma

Affiliations

Ganglioside GD2 Contributes to a Stem-Like Phenotype in Intrahepatic Cholangiocarcinoma

Antonella Mannini et al. Liver Int. 2025 Jan.

Abstract

Background & aims: GD2, a member of the ganglioside (GS) family (sialic acid-containing glycosphingolipids), is a potential biomarker of cancer stem cells (CSC) in several tumours. However, the possible role of GD2 and its biosynthetic enzyme, GD3 synthase (GD3S), in intrahepatic cholangiocarcinoma (iCCA) has not been explored.

Methods: The stem-like subset of two iCCA cell lines was enriched by sphere culture (SPH) and compared to monolayer parental cells (MON). GS profiles were evaluated by chromatography, after feeding with radioactive sphingosine. Membrane GD2 expression was evaluated by FACS, and the expression of enzymes of GS biosynthesis was analysed by RT-qPCR. The modulation of stem features by GS was investigated in vitro and in vivo using GD3S-overexpressing cells and corroborated by global transcriptomic analysis.

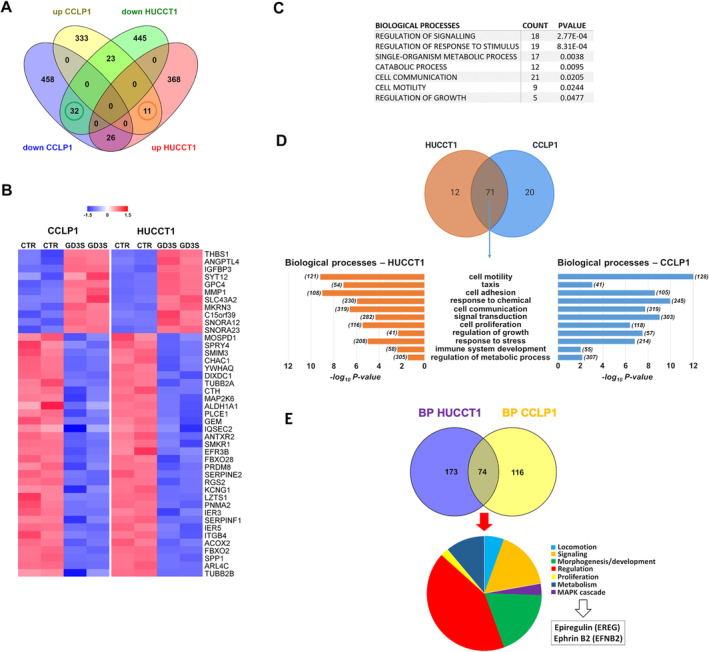
Results: GS composition was markedly different comparing SPH and MON. Among complex GS, iCCA-SPH showed increased GD2 levels, in agreement with the high expression levels of GD3 and GM2/GD2 synthases. iCCA cells overexpressing GD3S had higher sphere-forming ability, invasive properties and drug resistance than parental cells. NOD/SCID mice implanted with CCLP1 cells overexpressing GD3S developed larger tumours than control cells. By global transcriptomic analysis, ontology investigation identified 74 processes shared by the iCCA-SPH and GD3S-transfected cells, with enrichment for development and morphogenesis processes, MAPK signalling and locomotion. In a cohort of patients with iCCA, GD3S expression was correlated with lymph node invasion, indicating a possible relevance of GD3S in the clinical setting.

Conclusions: The profile of GS derivatives regulates the stem-like properties of iCCA cells.

Keywords: GD2 ganglioside; GD3 synthase (o ST8SIA1); cancer stem cells; cancer stemness biomarker; intrahepatic cholangiocarcinoma.


Conflict of interest statement

The authors declare no conflicts of interest.

Figures

FIGURE 1
FIGURE 1
Ganglioside patterns of iCCA‐MON and ‐SPH. (A) Representative digital autoradiography of ganglioside pattern and (B) quantification of the radioactivity associated with individual gangliosides in HUCCT1 and CCLP1 (MON and SPH), fed with radioactive sphingosine in order to label at the steady state cell sphingolipids. Data are expressed as nCi of ganglioside/mg of cell proteins, as mean ± SEM (n = 3, ***p < 0.001, t‐test SPH vs. MON). (C) FACS analysis strategy. Representative dot plots foretection GD2 ganglioside in iCCA‐MON and ‐SPH.Graph bar reported as (D) percent (%) of positive cells and (E) MFI values (*p < 0.05, **p < 0.01 t‐test, SPH vs. MON). (F) Representative confocal immunofluorescence images of sections of OCT‐embedded SPH of human HUCCT1 and CCLP1 cells immunostained to reveal GD2 (green). Cell plasma membranes and nuclei were counterstained with WGA Alexa 555 conjugated (magenta) and DAPI (blue), respectively; scale bars = 20 μm. Insets show high‐resolution details of the areas highlighted in the respective figures; individual optical sections acquired inside the cells display the localisation of GD2 on the cell membrane (arrowheads) and in the cytoplasm (arrows); scale bars = 7 μm.
FIGURE 2
FIGURE 2
Expression of GD3 synthase in iCCA‐MON and ‐SPH. (A) The GD3 synthase was evaluated in iCCA cells (HUCCT1 and CCLP1) and reported as fold expression relative to MON (n = 5, **p < 0.01 SPH vs. MON). (B) Western blot of the protein levels of GD3S were established in MON and SPH of the iCCA cells. Vinculin immunoblot was performed to ensure equal loading. Densitometry of GD3S/Vinculin expression (n = 3) was shown in the graph (*p < 0.05, **p < 0.001, t‐test SPH vs. MON).
FIGURE 3
FIGURE 3
Evidence for association between GD2 and stem‐like features. (A) Evaluation of stem‐like surface proteins in GD2pos and GD2neg SPH cells by FACS. reported as percentage of positive cells and MFI. (B) iCCA sphere‐forming efficiency and sphere‐volume in CCLP1 cells after PPMP exposure. Mean ± SEM (n = 3, ***p ≤ 0.001 PPMP‐SPH vs. CTR‐SPH). (C) Impact of PPMP on the expression of several stem‐like genes. The mRNA expression of stem‐like genes is presented as 2^deltaCT. Data are mean ± SEM (n = 3, *p ≤ 0.05, ***p ≤ 0.001 PPMP‐SPH vs. CTR‐SPH).
FIGURE 4
FIGURE 4
Ganglioside patterns of iCCA cells overexpressing GD3S. (A) Representative digital autoradiography of ganglioside pattern and quantification of the percentage of individual ganglioside in iCCA‐HUCCT1 overexpressing or not (CTR) GD3S after feeding with radioactive sphingosine in order to label at the steady state cell sphingolipids. Data are expressed as % of ganglioside; Mean ± SEM (n = 3, ***p < 0.001, one‐way ANOVA Lenti vs. GD3S). (B) Representative digital autoradiography of ganglioside pattern and quantification of the percentage of individual ganglioside in iCCA‐CCLP1 overexpressing or not (CTR) GD3S after feeding with radioactive sphingosine in order to label at the steady state cell sphingolipids. Data are expressed as % of ganglioside; mean ± SEM (n = 3, *p < 0.05, **p < 0.01, ***p < 0.001, ****p < 0.0001, one‐way ANOVA Lenti vs. GD3S).
FIGURE 5
FIGURE 5
In vitro tumour‐stem‐like properties of iCCA cells overexpressing GD3S. (A) Invasion of CCLP1 and HUCCT1 transfected cells was measured in modified Boyden chambers; mean ± SEM (n = 5, **p ≤ 0.01, ***p ≤ 0.001 GD3S vs. CTR). (B) iCCA sphere‐forming efficiency in HUCCT1 and CCLP1 transfected cells. Mean ± SEM (n = 3, **p ≤ 0.01, ***p ≤ 0.001 GD3S vs. CTR). (C, D) CCLP1 and HUCCT1 GD3S‐stably transfected cells were treated with 5‐fluorouracil, cisplatin or oxaliplatin (IC50 doses and treatment are described in [3]). Cell viability as measured by absorbance intensity (560 nm) was assessed with crystal violet staining. Mean ± SEM (n = 3, *p ≤ 0.05, **p ≤ 0.01, ***p ≤ 0.001 GD3S vs. CTR). CTR, transfected control cells; GD3S, cells stably transfected with GD3 synthase.
FIGURE 6
FIGURE 6
Molecular profile of iCCA cells overexpressing GD3S. (A) Venn diagram of commonly and specific deregulated genes between HUCCT1 and CCLP1 cells transfected with GD3S versus controls. (B) Heatmap of 43 commonly differentially expressed genes in both HUCCT1 and CCLP1 cell lines. Modified Z scores of the individual genes, as median‐centred log2 intensity values divided by standard deviation, are shown by a blue‐to‐red gradient variation. (C) Functional enrichment analysis of the 43 commonly deregulated genes. (D) Upper panel: Venn diagram of biological processes (level 2 of the GO) for which the lists of differentially expressed genes in HUCCT1 (orange) and CCLP1 (blue) cells transfected with GD3S versus controls were enriched with a p < 0.05. Seventy‐one processes (69%) were commonly enriched in both cell lines. The union of up‐ and down‐regulated genes for the two cell line was used for functional‐enrichment analysis. Lower panel: selection of the non‐redundant processes among the 71 commonly enriched in HUCCT1 (orange) and CCLP1 (blue) cell lines upon GDS3 transfection. Bars represent the negative log base 10 of the p. (E) Venn diagram of biological processes obtained by GD3S versus lentiviral and SPH and versus MON comparisons in HUCCT1 (blue) and CCLP1 (yellow). The 74 shared processes were further explored and are represented in the pie chart, with epiregulin and ephrin‐B2 being involved in all the depicted functional classes.
FIGURE 7
FIGURE 7
Impact of GD3S in GD3S‐transfected CCLP1 xenografts mouse model. (A) Analysis of tumour volume by Vevo LAZR‐X photoacoustic imaging. Tumour growth was weekly monitored with a dedicated in vivo imaging system until 31 days after s.c. injection of GD3S‐transfected CCLP1 cells; tumours were obtained in NOD/SCID mice (n = 10 per group, *p ≤ 0.05). (B) Representative dissected tumour samples. (C) Ultrasound images of representative subcutaneous tumour masses. CTR‐T, tumour derived from control transfected cells; GD3S‐T, tumour derived from GD3S‐transfected CCLP1 cells. (D) CK7, Ki67, GD3S and haematoxylin eosin co‐staining by immunohistochemical analysis. Representative stainings are shown below the histograms (**p ≤ 0.01, ***p ≤ 0.001; Mann–Whitney U test GD3S‐T vs. CTR‐T). (E) Heatmap of different tumour samples based on qRT‐PCR arrays of statistically significant differential expressed genes focused on CSC pathways (84 genes). Unsupervised hierarchical clustering of genes using Euclidean distance as the similarity metric and complete linkage as the linkage method. Modified Z‐scores for individual genes, calculated as median‐centred log2 intensity values divided by the standard deviation, are shown using a blue‐to‐red gradient.
FIGURE 8
FIGURE 8
GD3S expression in human iCCA and clinical relevance. (A) Expression of GD3S evaluated in 104 tumour samples versus 59 matched surrounding non‐tumoral liver tissue of iCCA patients [17]; (B) GD3S expression in paraffin‐embedded sections of iCCA. Neoplastic cells can show faint (left), moderate (centre) or strong (right) immunoreactivity; the surrounding liver parenchyma is usually characterised by a low expression of GD3S (*), bar: 50 μm, 40× magnification (area: 0.119 mm2); (C) clinical relevance of GD3S expression in iCCA. The median expression of GD3S in a validating cohort of 39 iCCA cases [18] was used to define ‘Low’ and ‘High’ expressing groups. Statistical analysis of clinical data demonstrated a significant association of GD3S expression with portal invasion (p = 0.029), lymph node invasion (p = 0.03). Statistical analysis was performed using a two‐sided Fisher's exact test.

References

    1. Banales J. M., Marin J. J. G., Lamarca A., et al., “Cholangiocarcinoma 2020: The Next Horizon in Mechanisms and Management,” Nature Reviews. Gastroenterology & Hepatology 17 (2020): 557–588. - PMC - PubMed
    1. Izquierdo‐Sanchez L., Lamarca A., La Casta A., et al., “Cholangiocarcinoma Landscape in Europe: Diagnostic, Prognostic and Therapeutic Insights From the ENSCCA Registry,” Journal of Hepatology 76 (2022): 1109–1121. - PubMed
    1. Raggi C., Correnti M., Sica A., et al., “Cholangiocarcinoma Stem‐Like Subset Shapes Tumor‐Initiating Niche by Educating Associated Macrophages,” Journal of Hepatology 66 (2017): 102–115. - PMC - PubMed
    1. Raggi C., Taddei M. L., Sacco E., et al., “Mitochondrial Oxidative Metabolism Contributes to a Cancer Stem Cell Phenotype in Cholangiocarcinoma,” Journal of Hepatology 74 (2021): 1373–1385. - PubMed
    1. Correnti M., Cappon A., Pastore M., et al., “The Protease‐Inhibitor SerpinB3 as a Critical Modulator of the Stem‐Like Subset in Human Cholangiocarcinoma,” Liver International 42 (2022): 233–248. - PMC - PubMed

Substances