Single-Cell RNA Sequencing Reveals the Tumor Heterogeneity and Immunosuppressive Microenvironment in Urothelial Carcinoma
- PMID: 39726326
- PMCID: PMC11875766
- DOI: 10.1111/cas.16436
Single-Cell RNA Sequencing Reveals the Tumor Heterogeneity and Immunosuppressive Microenvironment in Urothelial Carcinoma
Abstract
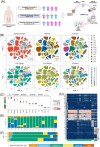
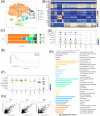
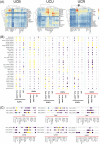
Urothelial carcinoma (UC) can arise from either the lower urinary tract or the upper tract; they represent different disease entities and require different clinical treatment strategies. A full understanding of the cellular characteristics in UC may guide the development of novel therapies. Here, we performed single-cell transcriptome analysis from four patients with UC of the bladder (UCB), five patients with UC of the ureter (UCU), and four patients with UC of the renal pelvis (UCRP) to develop a comprehensive cell atlas of UC. We found the rare epithelial cell subtype EP9 with epithelial-to-mesenchymal transition (EMT) and cancer stem cell (CSC) features, and specifically expressed SOX6, which was associated with poor prognosis. We also found that ACKR1+ endothelial cells and inflammatory cancer-associated fibroblasts (iCAFs) were more enriched in UCU, which may promote pathogenesis. While ESM1+ endothelial cells may more actively participate in UCB and UCRP tumorigenesis by promoting angiogenesis. Additionally, CD8 + effector T cells were more enriched in UCU and UCRP patients, while Tregs were mainly enriched in UCB tumors. C1QC+ macrophages and LAMP3+ dendritic cells were more enriched in UCB, which is closely related to the formation of the heterogeneous immunosuppressive microenvironment. Furthermore, we found strong interactions between iCAFs, EP9, and Endo_ESM1, and different degrees of activation of the FGF-FGFR3 axis and immune checkpoint pathway were observed in different UC subtypes. Our study elucidated the cellular heterogeneity and the components of the microenvironment in UC arising from the upper and lower urinary tracts and provided novel therapeutic targets.
Keywords: lower and upper urinary tract; single‐cell RNA sequencing; tumor heterogeneity; tumor microenvironment; urothelial carcinoma.
© 2024 The Author(s). Cancer Science published by John Wiley & Sons Australia, Ltd on behalf of Japanese Cancer Association.
Conflict of interest statement
The authors declare no conflicts of interest.
Figures


Similar articles
-
Single-cell sequencing uncovers a high ESM1-expression endothelial cell subpopulation associated with bladder cancer progression and the immunosuppressive microenvironment.Sci Rep. 2025 Mar 30;15(1):10946. doi: 10.1038/s41598-025-95731-2. Sci Rep. 2025. PMID: 40159545 Free PMC article.
-
Investigating cellular similarities and differences between upper tract urothelial carcinoma and bladder urothelial carcinoma using single-cell sequencing.Front Immunol. 2024 Jun 6;15:1298087. doi: 10.3389/fimmu.2024.1298087. eCollection 2024. Front Immunol. 2024. PMID: 38903524 Free PMC article.
-
Single-cell transcriptomic analysis of tumor heterogeneity and intercellular networks in human urothelial carcinoma.Chin Med J (Engl). 2023 Mar 20;136(6):690-706. doi: 10.1097/CM9.0000000000002573. Chin Med J (Engl). 2023. PMID: 36939254 Free PMC article.
-
Urothelial cancer stem cells and epithelial plasticity: current concepts and therapeutic implications in bladder cancer.Cancer Metastasis Rev. 2015 Dec;34(4):691-701. doi: 10.1007/s10555-015-9589-6. Cancer Metastasis Rev. 2015. PMID: 26328525 Review.
-
Synchronous and metachronous urothelial carcinoma of the upper urinary tract and the bladder: Are they clonally related? A systematic review.Urol Oncol. 2020 Jun;38(6):590-598. doi: 10.1016/j.urolonc.2020.01.008. Epub 2020 Feb 11. Urol Oncol. 2020. PMID: 32057596
Cited by
-
Advances in Genitourinary Tumor Genomics and Immunotherapy.Genes (Basel). 2025 May 30;16(6):667. doi: 10.3390/genes16060667. Genes (Basel). 2025. PMID: 40565559 Free PMC article. Review.
-
Single-cell sequencing uncovers a high ESM1-expression endothelial cell subpopulation associated with bladder cancer progression and the immunosuppressive microenvironment.Sci Rep. 2025 Mar 30;15(1):10946. doi: 10.1038/s41598-025-95731-2. Sci Rep. 2025. PMID: 40159545 Free PMC article.
-
Regulator of G protein signaling-1 facilitates ovarian cancer development by modulating NF-kB signal pathway.Sci Rep. 2025 Jan 5;15(1):864. doi: 10.1038/s41598-024-85071-y. Sci Rep. 2025. PMID: 39757280 Free PMC article.
References
-
- Siegel R. L., Miller K. D., Fuchs H. E., and Jemal A., “Cancer Statistics,” CA: a Cancer Journal for Clinicians 72, no. 1 (2022): 7–33. - PubMed
-
- Miyazaki J. and Nishiyama H., “Epidemiology of Urothelial Carcinoma,” International Journal of Urology 24, no. 10 (2017): 730–734. - PubMed
-
- Babjuk M., Böhle A., Burger M., et al., “EAU Guidelines on Non‐Muscle‐Invasive Urothelial Carcinoma of the Bladder: Update 2016,” European Urology 71, no. 3 (2017): 447–461. - PubMed
-
- Rouprêt M., Seisen T., Birtle A. J., et al., “European Association of Urology Guidelines on Upper Urinary Tract Urothelial Carcinoma: 2023 Update,” European Urology 84, no. 1 (2023): 49–64. - PubMed
-
- van Doeveren T., van de Werken H. J. G., van Riet J., et al., “Synchronous and Metachronous Urothelial Carcinoma of the Upper Urinary Tract and the Bladder: Are They Clonally Related? A Systematic Review,” Urologic Oncology 38, no. 6 (2020): 590–598. - PubMed
MeSH terms
Grants and funding
LinkOut - more resources
Full Text Sources
Medical
Research Materials
Miscellaneous

