. 2024 Dec 12:15:1485819.
doi: 10.3389/fpls.2024.1485819. eCollection 2024.

Biggest of tinies: natural variation in seed size and mineral distribution in the ancient crop tef [ Eragrostis tef (Zucc.) Trotter]

Affiliations

Biggest of tinies: natural variation in seed size and mineral distribution in the ancient crop tef [ Eragrostis tef (Zucc.) Trotter]

Eric D Whisnant et al. Front Plant Sci. .

Abstract

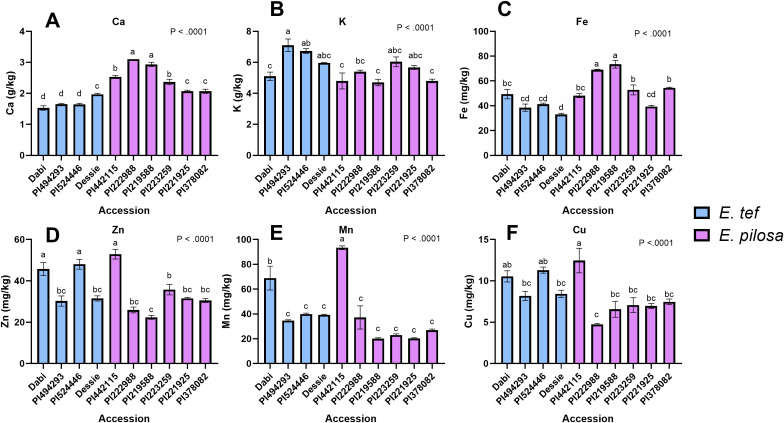
Tef [Eragrostis tef (Zucc.) Trotter] is the major staple crop for millions of people in Ethiopia and Eritrea and is believed to have been domesticated several thousand years ago. Tef has the smallest grains of all the cereals, which directly impacts its productivity and presents numerous challenges to its cultivation. In this study, we assessed the natural variation in seed size of 189 tef and 11 accessions of its wild progenitor Indian lovegrass (Eragrostis pilosa (L.) P. Beauv.) and explored the mineral distribution of representative accessions. Our findings revealed significant natural variation in seed size and mineral concentration among both the tef and E. pilosa accessions. We observed significant variation in seed length, seed width, and seed area among the accessions of both Eragrostis spp. we analyzed. Using representative accessions of both species, we also found significant variation in 1000-grain weight. The observed variation in seed size attributes prompted us to use comparative genomics to identify seed size regulating genes based on the well-studied and closely related monocot cereal rice [Oryza sativa (L.)]. Using this approach, we identified putative orthologous genes in the tef genome that belong to a number of key pathways known to regulate seed size in rice. Phylogenetic analysis of putative tef orthologs of ubiquitin-proteasome, G-protein, MAPK, and brassinosteroid (BR)-family genes indicate significant similarity to seed size regulating genes in rice and other cereals. Because tef is known to be more nutrient-dense than other more common cereals such as rice, wheat, and maize, we also studied the mineral concentration of selected accessions using ICP-OES and explored their distribution within the seeds using synchrotron-based X-ray fluorescence (SXRF) microscopy. The findings showed significant variation in seed mineral concentration and mineral distribution among the selected accessions of both Eragrostis spp. This study highlights the natural variation in seed size attributes, mineral concentration, and distribution, while establishing the basis for understanding the genetic mechanisms regulating these traits. We hope our findings will lead to a better understanding of the evolution of tef at the genetic level and for the development of elite tef cultivars to improve seed size, yield, and quality of the grains.

Keywords: Eragrostis pilosa; Eragrostis tef; mineral concentration; mineral distribution; seed size; seed size regulating genes.


Conflict of interest statement

The authors declare that the research was conducted in the absence of any commercial or financial relationships that could be construed as a potential conflict of interest. The author(s) declared that they were an editorial board member of Frontiers, at the time of submission. This had no impact on the peer review process and the final decision.

Figures

Figure 1
Figure 1
An example of how seed size attributes were measured in ImageJ. Images from left to right show measurement of seed length, seed width, and seed area. These measurements were converted to µm for seed length and seed width, and µm2 for seed area.
Figure 2
Figure 2
Measurements of tef seed area, length, width, and 1000-grain weight. (A) Frequency distribution of tef mean seed area (µm2), (B) Seed length (µm), (C) Seed width (µm), and (D) 1000-grain weight for representative tef varieties. Ten replicate measurements (n = 10) of seed length, seed width, and seed area were taken and averaged for each accession. Four replicates (n = 4) were weighed and averaged to generate the 1000-grain weight. Data was analyzed by one-way ANOVA and mean comparison using the Student-Newman-Keuls (SNK) post-hoc test. One-way ANOVA found that differences between accessions for all seed size attributes was statistically significant (p< 0.0001). Bars bearing the same letter are not statistically significant (p< 0.05). (E) Visual comparison of accessions with large (PI524446) and small (PI494453) seeds. Image was acquired under 1x magnification using a Nikon SMZ18 Stereoscope (Nikon, Kanagawa, Japan).
Figure 3
Figure 3
Seed size attributes of 30 representative tef accessions. Accessions were binned as high, medium, or low for seed area, length, and width. The data of 10 accessions representing the highest, medium, and lowest categories (30 total) are presented for mean seed area (A), length (B) and width (C). Ten replicate measurements (n = 10) of seed length, seed width, and seed area were taken and averaged for each accession. The 30 accessions were analyzed by one-way ANOVA. One-way ANOVA found that differences between accessions for all seed size attributes was statistically significant (p<0.0001). Statistical mean comparison used the SNK post-hoc test. Bars bearing the same letter are not significantly different (p< 0.05).
Figure 4
Figure 4
Seed size attributes of E. pilosa (A) Seed area (µm2), (B) Seed length (µm) (C) Seed width (µm), and (D) 1000-grain weight for representative E. pilosa varieties. Ten replicate measurements (n = 10) of seed length, width, and area were taken and averaged for each accession. Four replicates (n = 4) were taken and averaged to generate the 1000-grain weight. Data were analyzed by one-way ANOVA. One-way ANOVA found that differences between accessions for all seed size attributes was statistically significant (p<0.0001). The SNK post-hoc test was used for means comparison. Bars bearing different letters are significantly different (p< 0.05). (E) Visual comparison of accessions with the largest (PI442487) and smallest (PI442115) seeds by area. Seeds images were acquired under 1x magnification, taken on a Nikon SMZ18 Stereoscope (Nikon, Kanagawa, Japan).
Figure 5
Figure 5
Comparison of selected (A) tef and (B) E. pilosa genotypes. (C) Images highlight phenotypes observed from E. pilosa, including the reticulate-patterned seed coat observed in a few accessions (e.g., PI222988) compared to the smooth seed coat in others (e.g., PI211030). A diminished length-to-width ratio was observed in PI263510. We observed differences in seed shape in some E. pilosa accessions, including more oblong seeds with emarginated apices (e.g., PI222988) in comparison to the more ovular seed shape of PI211030.
Figure 6
Figure 6
Elemental analysis using ICP-OES. (A) Ca, (B) K, (C) Fe, (D) Zn, (E) Mn, and (F) Cu. Blue bars indicate tef accessions and purple bars indicate E. pilosa accessions. Data were analyzed by one-way ANOVA. One-way ANOVA found that differences in mineral concentration for Ca, K, Fe, Cu, Mn, and Zn among the tef and E. pilosa accessions were statistically significant (p< 0.0001).The SNK post-hoc test was used for mean comparison. Bars bearing different letters are significantly different (p< 0.05).
Figure 7
Figure 7
SXRF images of tef and E. pilosa seeds. Images show elemental localization of (A) Ca, (B) K, (C) Fe, (D) Zn, (E) Mn, and (F) Cu. Seeds of the same variety are aligned as a column. Accessions left-to-right: (1) Dabi; tef, (2) PI442115; E. pilosa (3) PI494293; tef (4) PI524446; tef.
Figure 8
Figure 8
Number of genes that are strongly enriched in various categories of Biological Processes GO term using rice (Oryza sativa var. japonica) as a model. Reported seed size regulating genes from rice were listed and analyzed against the rice genome background (Oryza sativa Japonica Group genes IRGSP-1.0; Taxonomy ID: 39947). Genes were sorted by GO Biological Processes using ShinyGO v0.80. The size of the circle indicates the number of genes grouped into the biological function. Fold enrichment indicates the genes from our list that are overrepresented in the given pathway as a relationship to the background (Ge et al., 2020).
Figure 9
Figure 9
Functional clusters of genes are strongly enriched in distinct categories based on biological function. The size of the circle indicates the number of genes enriched in the group. GO terms of similar biological functions are clustered together. The numerical value in front of the GO ID and term indicates the enrichment False Discovery Rate (FDR; FDR< 0.05), which is an adjusted p - value to test the statistical significance of the enrichment. Reported seed size regulating genes from rice were listed and analyzed against the rice genome background (Oryza sativa Japonica Group genes IRGSP-1.0; Taxonomy ID: 39947).
Figure 10
Figure 10
Gene phylogeny of ubiquitin-proteasome pathway genes regulating seed size. Genes were gathered from six monocot species (Oryza sativa: Os, Eragrostis tef; Et, Hordeum vulgare: Hv; Triticum aestivum: Ta; Sorghum bicolor: Sb; and Zea mays: Zm) and the model dicot species (Arabidopsis thaliana; At), using the rice sequence as the reference, unless otherwise noted. The first two letters in front of the gene ID represent the initials of the genus and species names. The Arabidopsis UBP15 homolog LUHQ01000001.1 refers to CDS of the protein OAP15376.1. The Arabidopsis GW6a/OslHAT homolog LUHQ01000004.1 refers to CDS of the protein OAO96749.1. Genes are sorted and colored based on the rice gene they were referenced from. In the legend, gene names separated with a forward slash (/) indicate synonymous names. Gene names separated with a plus sign (+) indicate genes that were referenced from more than one rice sequence. Branches on the tree are colored to highlight the bootstrap value.
Figure 11
Figure 11
Gene phylogeny of genes associated with MAPK-mediated regulation of seed size. Genes were gathered from six monocot species (Oryza sativa: Os, Eragrostis tef; Et, Hordeum vulgare: Hv; Triticum aestivum: Ta; Sorghum bicolor: Sb; and Zea mays: Zm) and the model dicot species (Arabidopsis thaliana; At), using the rice sequence as the reference, unless otherwise noted. The first two letters in front of the gene ID represent the initials of the genus and species names. No significantly similar sequences were identified for MKKK62 and MKKK70 in Arabidopsis thaliana. MKKK62 homolog Zm NCVQ01000004.1 represents the CDS associated with the protein PWZ31627.1 of Z. mays cultivar inbred line Mo17. The Arabidopsis homolog of MKP1, LUHQ01000003.1, encodes the protein OAP02192. Genes are sorted and colored based on the rice gene they were referenced from. In the legend, gene names separated with a forward slash (/) indicate synonymous names. Gene names separated with a plus sign (+) indicate genes that were referenced from more than one rice sequence. Branches on the tree are colored to highlight the bootstrap value.
Figure 12
Figure 12
Gene phylogeny of G-protein mediated signaling pathway genes reported to control seed size in rice. Genes were gathered from six monocot species (Oryza sativa: Os, Eragrostis tef; Et, Hordeum vulgare: Hv; Triticum aestivum: Ta; Sorghum bicolor: Sb; and Zea mays: Zm) and the model dicot species (Arabidopsis thaliana; At), using the rice sequence as the reference. The first two letters in front of the gene ID represent the initials of the genus and species names. For RGG1, no significant ortholog was identified for tef using the rice reference. For RGG1, the Sorghum bicolor sequence was used to generate the predicted sequence in tef. The Zea mays ortholog of RGG1 generated the same tef sequence. RGG2 ortholog Zm NCVQ01000006.1 here refers to the CDS associated with the protein PWZ21711.1 of Z. mays cultivar inbred line Mo17. Genes are sorted and colored based on the rice gene they were referenced from. In the legend, gene names separated with a forward slash (/) indicate synonymous names. Gene names separated with a plus sign (+) indicate genes that were referenced from more than one rice sequence. Branches on the tree are colored to highlight the bootstrap value.
Figure 13
Figure 13
Gene phylogeny of genes involved in brassinosteroid (BR) signaling and biosynthesis reported to control grain size in rice. Genes were gathered from six monocot species (Oryza sativa: Os, Eragrostis tef; Et, Hordeum vulgare: Hv; Triticum aestivum: Ta; Sorghum bicolor: Sb; and Zea mays: Zm) and the model dicot species (Arabidopsis thaliana; At). The first two letters in front ot the gene ID represent the initials of the genus and species names. No significantly similar sequences were identified in Arabidopsis for the AGO17 cluster. Some of the sequences in the tree above share a common label (gene ID). Here is the legend for those with common gene IDs: (Zm NCVQ01000006.1 (BRD1): PWZ55818.1) (Zm NCVQ01000004.1 (GL3.1): PWZ31897.1) (Zm NCVQ01000004.1 (BRI1): PWZ33145.1) (Zm NCVQ01000004.1 (LAC): PWZ31747.1) (Zm NCVQ01000004.1 (OFP8): PWZ31834.1) (Zm NCVQ01000006.1 (BRD2): PWZ21402.1) (Zm NCVQ01000006.1 (BRD2): PWZ22989.1) (BRI1/DG1: At LUHQ01000001.1: OAP19821.1) (GL3.1: At LUHQ01000002.1: OAP09351.1) (GW5: LUHQ01000003.1: OAP01951.1) (OFP1: LUHQ01000005.1: OAO94238.1). Genes are sorted and colored based on the rice gene they were referenced from. Genes names separated with a forward slash (/) indicate synonymous names. Gene names separated with a plus sign (+) indicate genes that were referenced from more than one rice sequence. Branches on the tree are colored to highlight the bootstrap value.

Similar articles

References

    1. Akinci C., Yıldırım M., Bahar B. (2008). The effects of seed size on emergence and yield of durum wheat. J. Food Agric. Environ. 6, 234–237.
    1. Alam I., Batool K., Huang Y., Liu J., Ge L. (2022). Developing genetic engineering techniques for control of seed size and yield. Int. J. Mol. Sci. 23, 13256. doi: 10.3390/ijms232113256 - DOI - PMC - PubMed
    1. Anderson B. E., Volesky J. D. (2012). Summer annual forage grasses. University of Nebraska. NebGuide G74-171.
    1. Arafsha S. M., Aslam M. F., Ellis P. R., Latunde-Dada G. O., Sharp P. A. (2023). Strategies to increase the bioaccessibility and bioavailability of iron and zinc from cereal products. Proc. Nutr. Soc., 1–7. doi: 10.1017/S0029665123003543 - DOI - PubMed
    1. Assefa K., Cannarozzi G., Girma D., Kamies R., Chanyalew S., Plaza-Wüthrich S., et al. . (2015). Genetic diversity in tef [Eragrostis tef (Zucc.) Trotter. Front. Plant Sci. 6. doi: 10.3389/fpls.2015.00177 - DOI - PMC - PubMed

LinkOut - more resources