

Identification of key genes related to growth of largemouth bass (Micropterus salmoides) based on comprehensive transcriptome analysis
- PMID: 39726434
- PMCID: PMC11670207
- DOI: 10.3389/fmolb.2024.1499220
Identification of key genes related to growth of largemouth bass (Micropterus salmoides) based on comprehensive transcriptome analysis
Abstract
Introduction: Largemouth bass is an economically important farmed freshwater fish species that has delicious meat, no intermuscular thorns, and rapid growth rates. However, the molecular regulatory mechanisms underlying the different growth and developmental stages of this fish have not been reported.
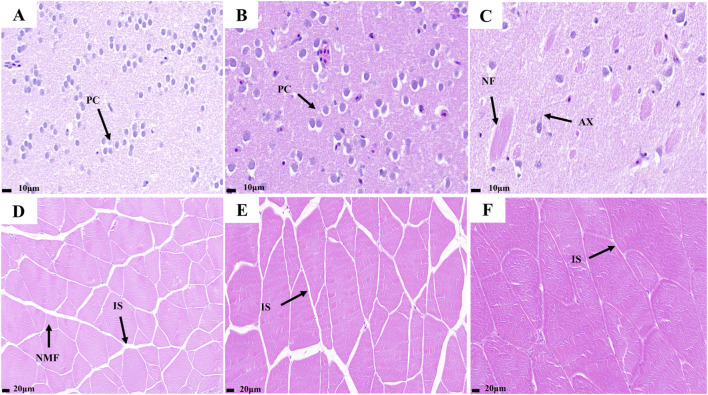
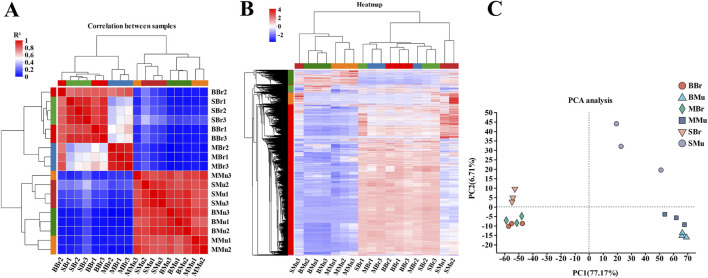
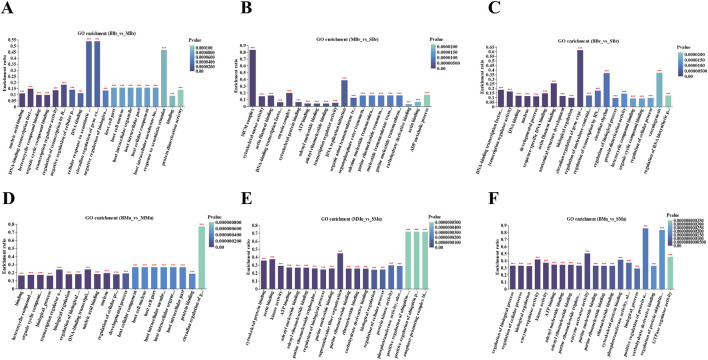
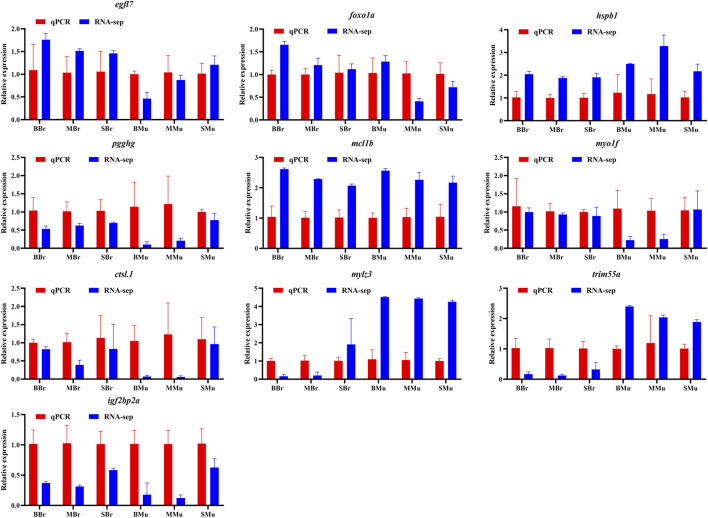
Methods: In this study, we performed histological and transcriptomic analyses on the brain and dorsal muscles of largemouth bass at different growth periods. The brain and muscle tissue were dehydrated, embedded, sliced and stained with hematoxylin-eosin. Images were captured under a microscope and acquired using a microphotographic system. Differential expression between groups was analyzed using DESeq2. GO functional analysis and KEGG pathway analysis were then performed for differentially expressed genes. RT-qPCR validates the reliability of transcriptome sequencing data.
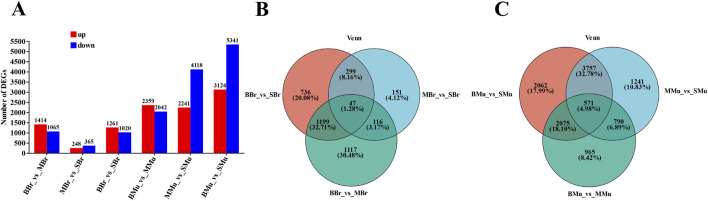
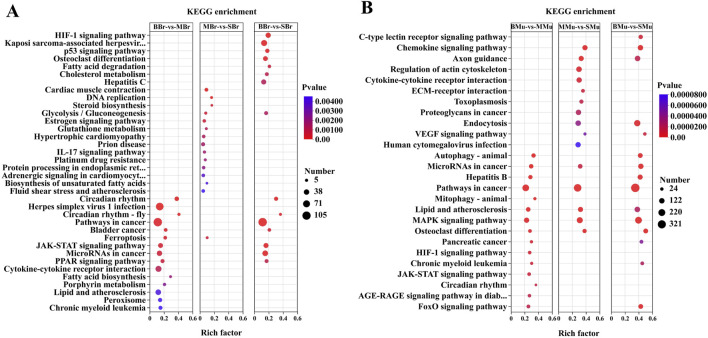
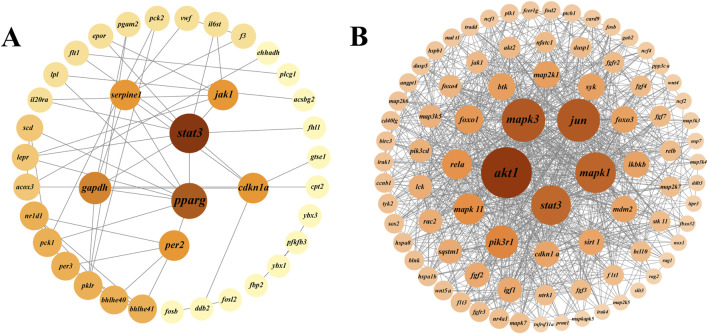
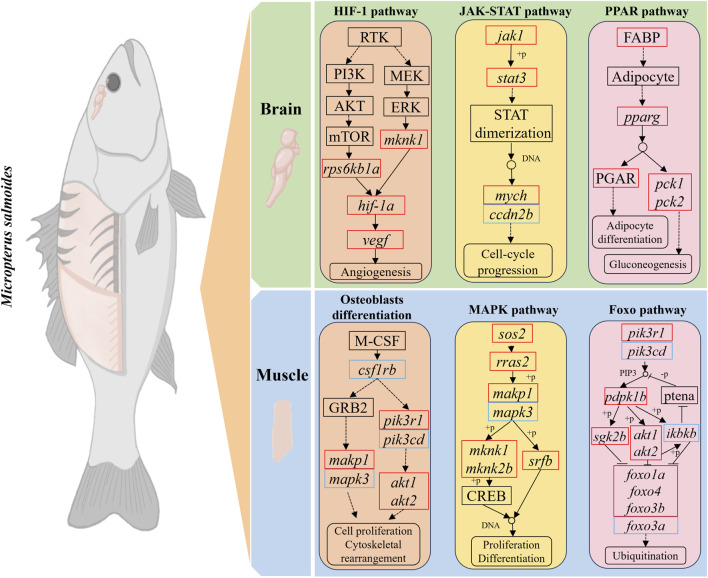
Result: Smaller fish had more new muscle fiber numbers and wider intermuscular spaces compared to big specimens. Axons and nerve fibers were more pronounced in the telencephalons of big fish than in small fish. A total of 19,225 differentially expressed genes (DEGs) were detected in the muscle tissue, among which 7,724 were upregulated and 11,501 were downregulated, while a total of 5,373 DEGs were detected in the brain, among which 2,923 were upregulated and 2,450 were downregulated. GO and KEGG enrichment analyses indicated that nucleic acid binding, cytoskeletal motor activity, DNA binding, circadian rhythm, glycolysis/gluconeogenesis, and osteoclast differentiation were related to brain development while binding, cytoskeletal protein binding, biological processes, c-type lectin receptors, mitogen-activated protein kinase (MAPK) signaling pathways, and osteoclast differentiation were related to muscle growth. Stat3, pparg, akt1, mapk3, and mapk1 genes were mainly involved in the growth and development of largemouth bass.
Conclusion: These results provide novel perspectives for deepening our understanding of the mechanisms underlying the growth and development and performing genetic selection in largemouth bass.
Keywords: DEGs; different growth periods; histological analysis; largemouth bass; transcriptome.
Copyright © 2024 Hu, Jian, Zhang, Xu, Wang, Gong, Zhang, Zhu, Gu and Guan.
Conflict of interest statement
Author PZ was employed by Huzhou Rongsheng Fishery Technology Company. The remaining authors declare that the research was conducted in the absence of any commercial or financial relationships that could be construed as a potential conflict of interest.
Figures
References
-
- Cao J., Li N., Rajalekshmi M., Cai C. F., LiuL L., Ren A. (2024). Effect of high plant protein diet supplemented with Lysophospholipids-butyrate on the growth performance, liver health and intestinal morphology of Largemouth bass (Micropterus salmoides). Aquac. Rep. 36, 102161. 10.1016/j.aqrep.2024.102161 - DOI
-
- Cao X., Cui H., Ji X., Li B., Lu R., Chen Y. Z. J., et al. (2023). Determining the potential roles of branched-chain amino acids in the regulation of muscle growth in common carp (Cyprinus carpio) based on transcriptome and MicroRNA sequencing. Aquac. Nutr. 2023, 7965735. 10.1155/2023/7965735 - DOI - PMC - PubMed
-
- Chen Q. K., Xing Y. F., Lei Y., Tong G. X., Lin X. B., He P. C., et al. (2024b). Genetic diversity, antibiotic resistance, and pathogenicity of Aeromonas veronii isolated from farmed largemouth bass (Micropterus salmoides) in the main aquaculture regions of China. Aquaculture 592, 741150. 10.1016/j.aquaculture.2024.741150 - DOI
LinkOut - more resources
Full Text Sources
Miscellaneous