. 2024 Dec 12:15:1492648.
doi: 10.3389/fimmu.2024.1492648. eCollection 2024.

m6A methylation profiling as a prognostic marker in nasopharyngeal carcinoma: insights from MeRIP-Seq and RNA-Seq

Affiliations

m6A methylation profiling as a prognostic marker in nasopharyngeal carcinoma: insights from MeRIP-Seq and RNA-Seq

Xiaochuan Chen et al. Front Immunol. .

Abstract

Background: Nasopharyngeal carcinoma (NPC) is a type of malignant tumors commonly found in Southeast Asia and China, with insidious onset and clinical symptoms. N6-methyladenosine (m6A) modification significantly contributes to tumorigenesis and progression by altering RNA secondary structure and influencing RNA-protein binding at the transcriptome level. However, the mechanism and role of abnormal m6A modification in nasopharyngeal carcinoma remain unclear.

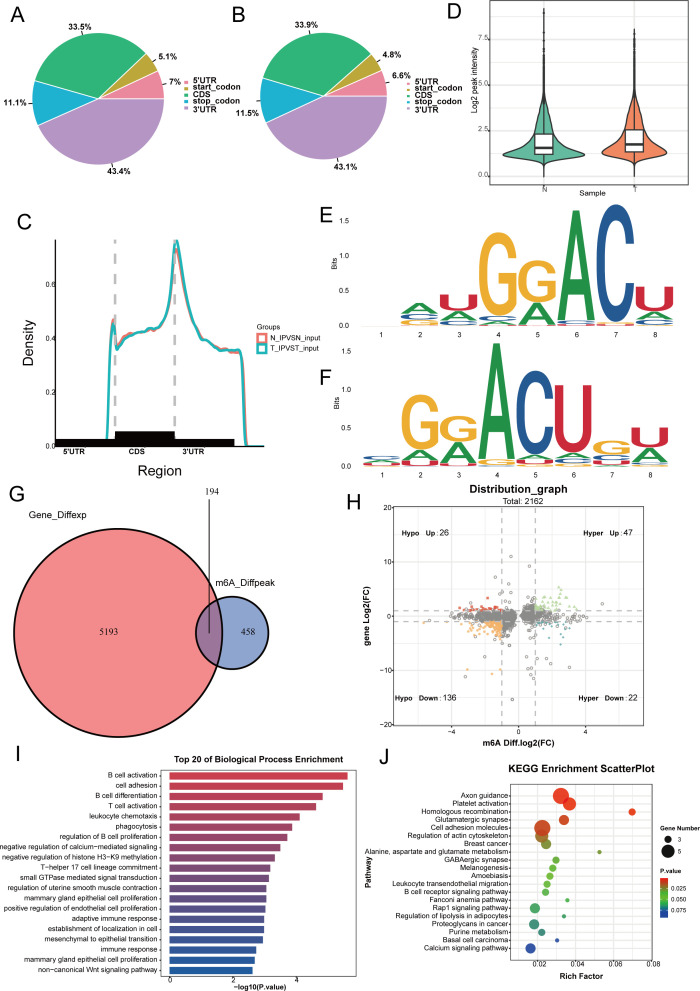
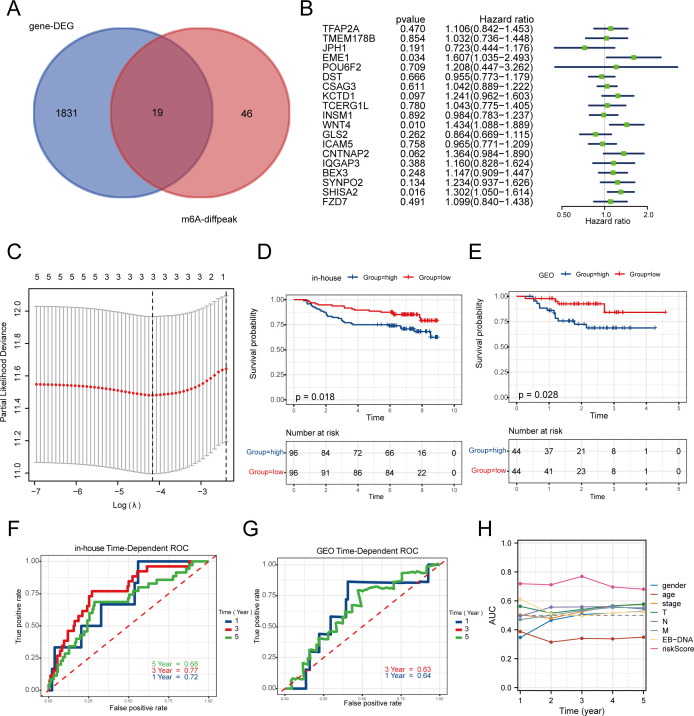
Methods: Nasopharyngeal Carcinoma tissues from 3 patients and non-cancerous nasopharyngeal tissues from 3 individuals, all from Fujian Cancer Hospital, were sequenced for m6A methylation. These were combined with transcriptome sequencing data from 192 nasopharyngeal cancer tissues. Genes linked to prognosis were discovered using differential analysis and univariate Cox regression. Subsequently, a prognostic model associated with m6A was developed through the application of LASSO regression analysis. The model's accuracy was verified using both internal transcriptome databases and external databases. An extensive evaluation of the tumor's immune microenvironment and signaling pathways was performed, analyzing both transcriptomic and single-cell data.

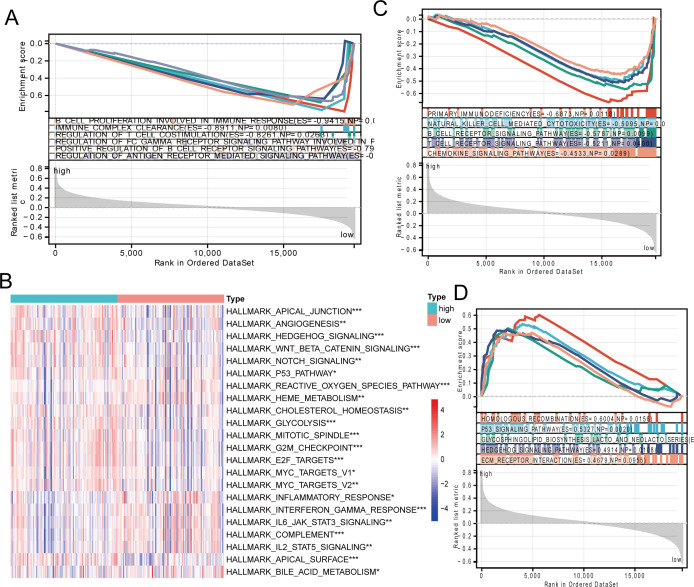
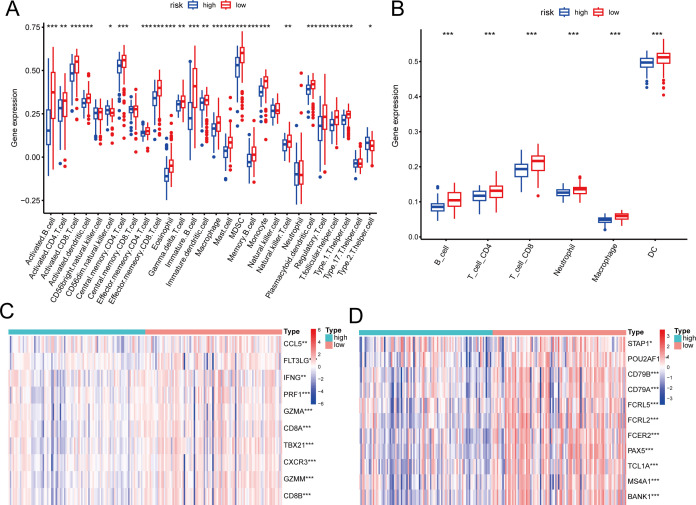
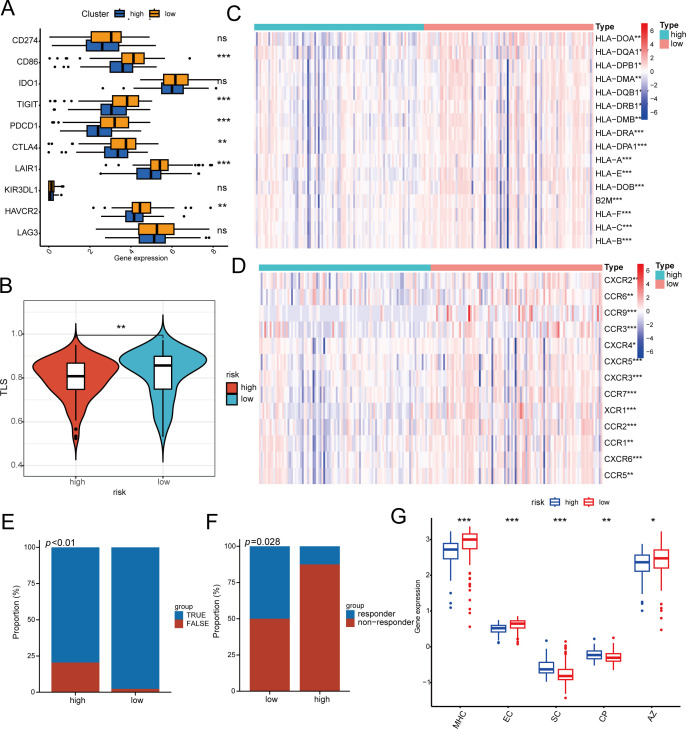
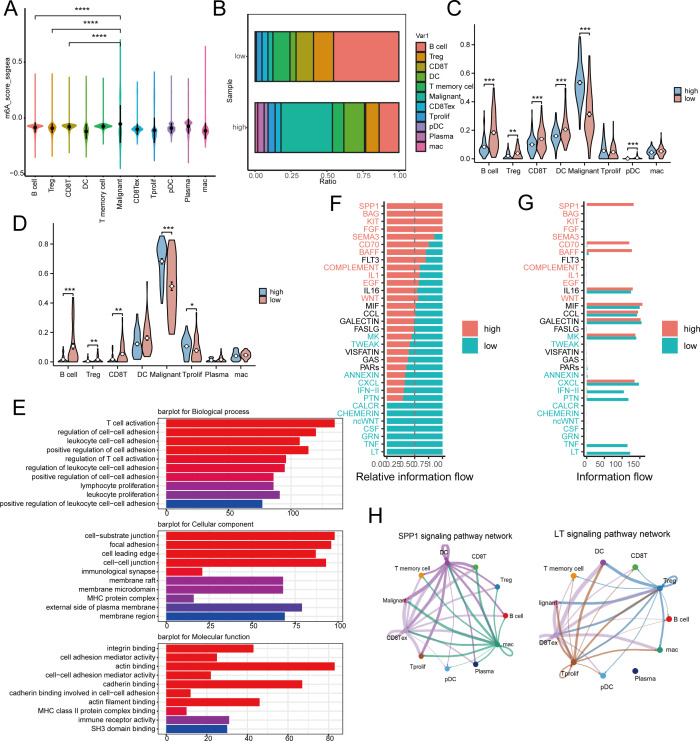
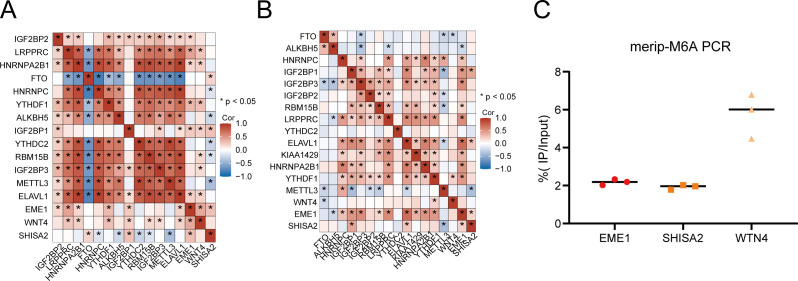
Results: The m6A methylation sequencing analysis revealed 194 genes with varying expression levels, many of which are predominantly associated with immune pathways. By integrating transcriptome sequencing data, 19 m6A-modified genes were found to be upregulated in tumor tissues, leading to the development of a three-gene (EME1, WNT4, SHISA2) risk prognosis model. The group with lower risk exhibited notable enrichment in pathways related to immunity, displaying traits like enhanced survival rates, stronger immune profiles, and increased responsiveness to immunotherapy when compared to the higher-risk group. Single-cell analysis revealed that malignant cells exhibited the highest risk score levels compared to immune cells, with a high-risk score indicating worse biological behavior. The three hub genes demonstrated significant correlation with m6A modification regulators, and MeRIP-RT-PCR confirmed the occurrence of m6A methylation in these genes within nasopharyngeal carcinoma cells.

Conclusions: A prognostic model for nasopharyngeal carcinoma risk based on m6A modification genes was developed, and its prognostic value was confirmed through self-assessment data. The study highlighted the crucial impact of m6A modification on the immune landscape of nasopharyngeal cancer.

Keywords: m6A modification; nasopharyngeal carcinoma; prognosis; transcriptome sequencing; tumor immune microenvironment.


Conflict of interest statement

The authors declare that the research was conducted in the absence of any commercial or financial relationships that could be construed as a potential conflict of interest.

Figures

Figure 1
Figure 1
Analysis of m6a modifier profiles and identification of differentially expressed genes in nasopharyngeal carcinoma. (A, B) We use pie charts to count the distribution of peaks on gene functional elements between non-cancerous (A) and cancerous tissues (B). (C) Density of differential m6A peaks along transcripts. Each transcript is divided into three sections: 5UTR, CDS, and 3UTR. (D) Levels of m6A methylation modification in tumor and non-tumor tissues. (E, F) Differential of the most conserved sequence motif in the m6A peak region. (G) Venn diagram showing differentially expressed genes undergoing m6a methylation modification between non-cancerous and cancerous tissues. (H) The four-quadrant diagram shows the changes in differentially methylated peaks. (I, J) The KEGG and GO enrichment pathway analysis of differential m6a methylated genes.
Figure 2
Figure 2
Construction and validation of a risk prognosis model for m6A related genes. (A) The intersection of m6A sequencing genes and 192 transcriptome data was used to screen for 19 19 m6A methylated genes upregulated in tumors. (B) Univariate Cox analysis was performed on these 19 genes with PFS. (C) Establishing prognostic biomarkers for three features (EME1, WNT4, SHISA2) identified in the in-house dataset using LASSO regression model. (D, E) In the in-house and GEO cohorts, low-risk group patients had a favorable PFS rate as opposed to those in the high-risk group formula. (F, G) The Receiver Operating Characteristic (ROC) curve for the 1-year and 3-year survival rates of in-house and GEO cohorts. (H) The ROC curve of clinical factors such as gender, age, stage, and risk score suggests that risk score has higher accuracy.
Figure 3
Figure 3
Signaling pathway enrichment analysis of risk models. (A) GO enrichment analysis of the low-risk group. (B) Heatmap showing HALLMARK pathway differences between high-risk and low-risk groups. (C, D) KEGG enrichment analysis in the low-risk group and high-risk group. * p < 0.05, ** p < 0.01, *** p < 0.001.
Figure 4
Figure 4
Association of the risk score with tumor immune microenvironment in nasopharyngeal carcinoma. (A, B) Differences in immune cell composition types between high-risk and low-risk groups by ssGSEA (A) and TIMER (B). (C, D) Differences in marker genes between CD8+T (C) cells and B cells (D) in high-risk and low risk groups. * p < 0.05, ** p < 0.01, *** p < 0.001.
Figure 5
Figure 5
The response of immunotherapy of low- and high-risk groups. (A) The relationship between risk score and 10 inhibitory immune checkpoints. (B) Differences in TLS between high- and high-risk groups. (C, D) Differential Expression of Immune Cell Regulators and MHC in High and Low Risk Groups. (E, F) Patients in the low-risk group had higher immune responses in the cohorts of patients with nasopharyngeal carcinoma (E) and non-small cell lung cancer (F). (G) Difference between low- and high-risk groups at ips score. MHC MHC molecules, EC effector cells, SC suppressor cells, CP immune checkpoints, * p < 0.05, ** p < 0.01, *** p < 0.001.
Figure 6
Figure 6
Risk model differences in immune landscapes and cellular communication at the single-cell level. (A) Risk scores for 11 different cell subgroup samples in the GSE150430 dataset. (B) The proportion of immune cell composition between high-risk and low-risk groups. (C, D) Detect immune cell infiltration in high-risk and low-risk groups in inhouse (C) and GEO (D) cohorts by CIBERSORTx tool. (E) The main pathways for accumulating differentially expressed genes between high-risk and low-risk populations. (F, G) Observing differences in active pathways between high-risk and low-risk groups. (H) SPP1 and LT signaling pathways in high-risk and low-risk groups. * p < 0.05, ** p < 0.01, *** p < 0.001, ****p < 0.0001.
Figure 7
Figure 7
m6A modification levels of hub genes and their relationship with m6A regulatory proteins in nasopharyngeal carcinoma. (A, B) Three hub genes have strong correlation with m6A modification regulatory factors in the in-house (A) and GEO (B) cohorts. (C) MeRIP-PCR results of three hub genes in HK1 cell.

Similar articles

References

    1. Chua MLK, Wee JTS, Hui EP, Chan ATC. Nasopharyngeal carcinoma. Lancet. (2016) 387:1012–24. doi: 10.1016/S0140-6736(15)00055-0 - DOI - PubMed
    1. Li Y, Xiao J, Bai J, Tian Y, Qu Y, Chen X, et al. . Molecular characterization and clinical relevance of m6A regulators across 33 cancer types. Mol Cancer. (2019) 18:137. doi: 10.1186/s12943-019-1066-3 - DOI - PMC - PubMed
    1. Han D, Liu J, Chen C, Dong L, Liu Y, Chang R, et al. . Anti-tumour immunity controlled through mRNA m6A methylation and YTHDF1 in dendritic cells. Nature. (2019) 566:270–4. doi: 10.1038/s41586-019-0916-x - DOI - PMC - PubMed
    1. Lin Z, Niu Y, Wan A, Chen D, Liang H, Chen X, et al. . RNA m(6) A methylation regulates sorafenib resistance in liver cancer through FOXO3-mediated autophagy. EMBO J. (2020) 39:e103181. doi: 10.15252/embj.2019103181 - DOI - PMC - PubMed
    1. Wang L, Hui H, Agrawal K, Kang Y, Li N, Tang R, et al. . m(6) A RNA methyltransferases METTL3/14 regulate immune responses to anti-PD-1 therapy. EMBO J. (2020) 39:e104514. doi: 10.15252/embj.2020104514 - DOI - PMC - PubMed

MeSH terms

LinkOut - more resources