. 2024 Dec 11:15:1499731.
doi: 10.3389/fimmu.2024.1499731. eCollection 2024.

TLS and immune cell profiling: immunomodulatory effects of immunochemotherapy on tumor microenvironment in resectable stage III NSCLC

Affiliations

TLS and immune cell profiling: immunomodulatory effects of immunochemotherapy on tumor microenvironment in resectable stage III NSCLC

Chaopin Yang et al. Front Immunol. .

Abstract

Background: The use of programmed death-1 (PD-1) inhibitors in the neoadjuvant setting for patients with resectable stage III NSCLC has revolutionized this field in recent years. However, there is still 40%-60% of patients do not benefit from this approach. The complex interactions between immune cell subtypes and tertiary lymphoid structures (TLSs) within the tumor microenvironment (TME) may influence prognosis and the response to immunochemotherapy. This study aims to assess the relationship between immune cells subtypes and TLSs to better understand their impact on immunotherapy response.

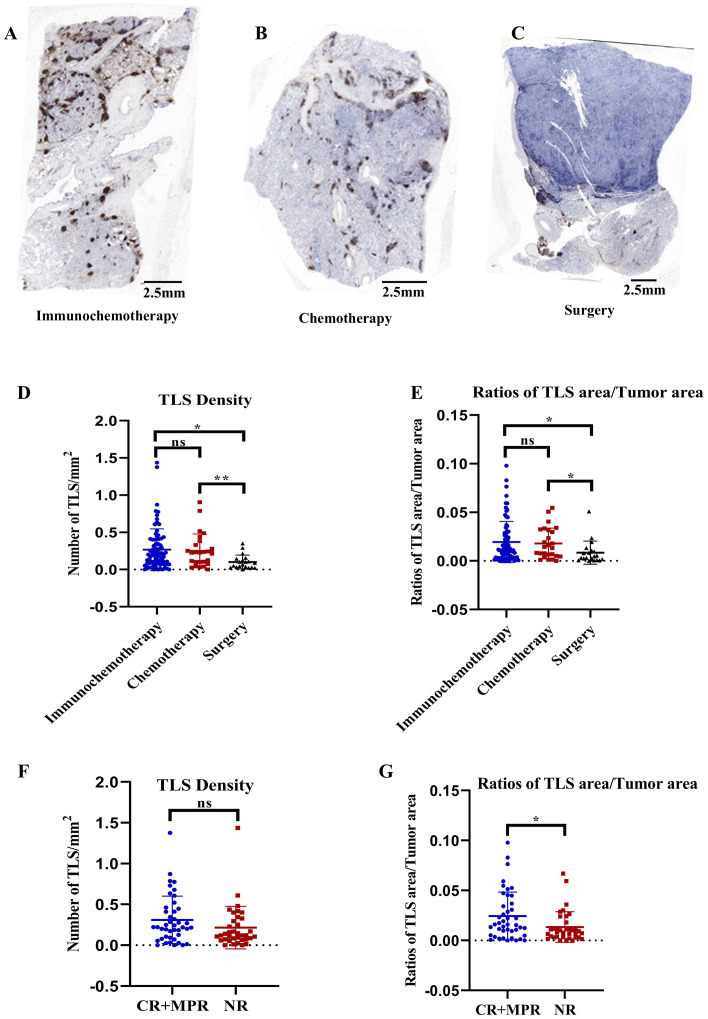
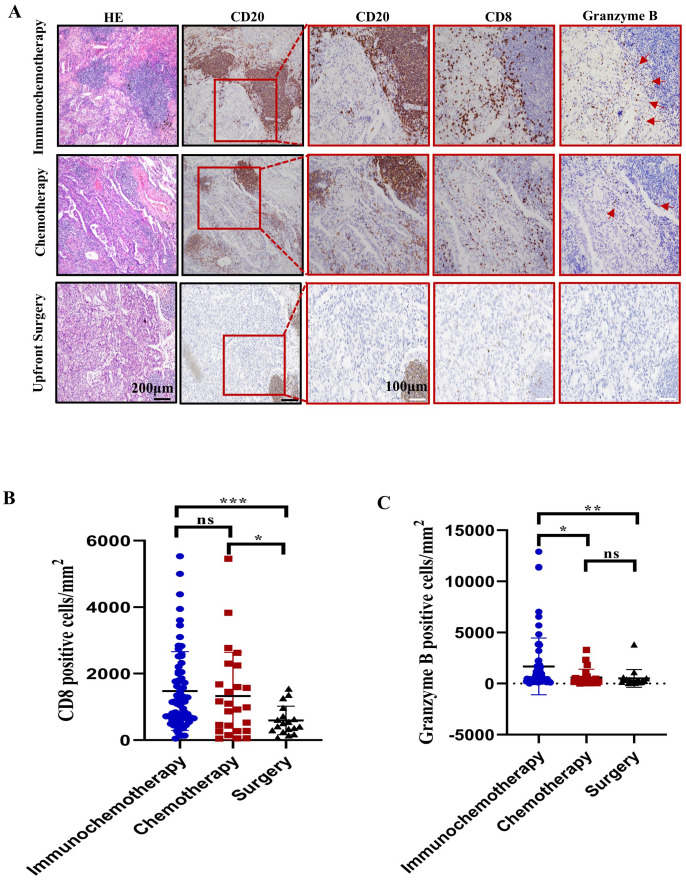
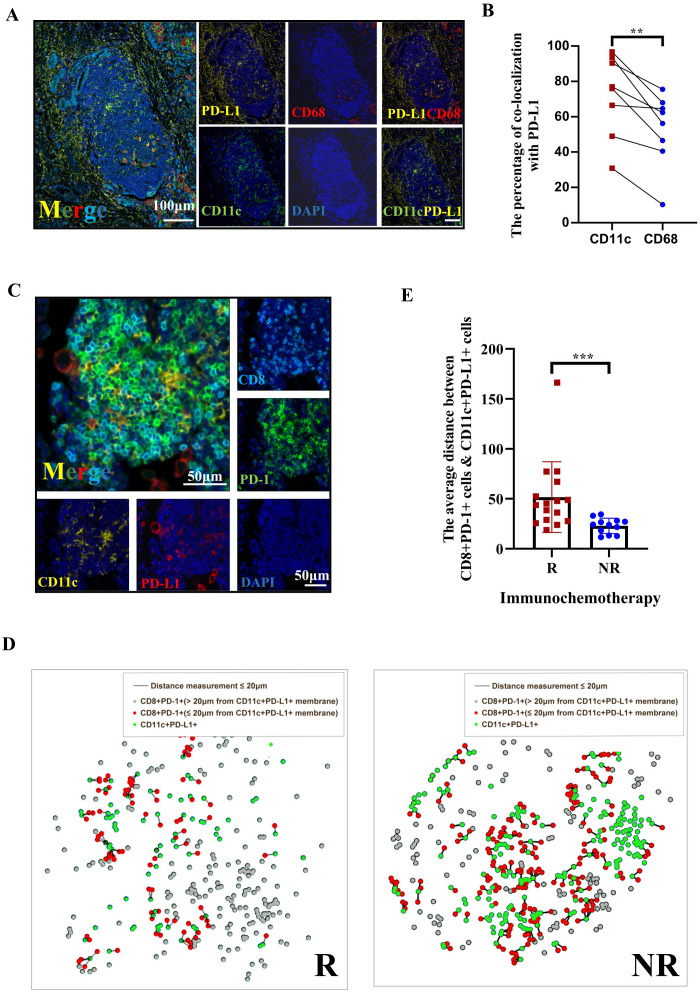
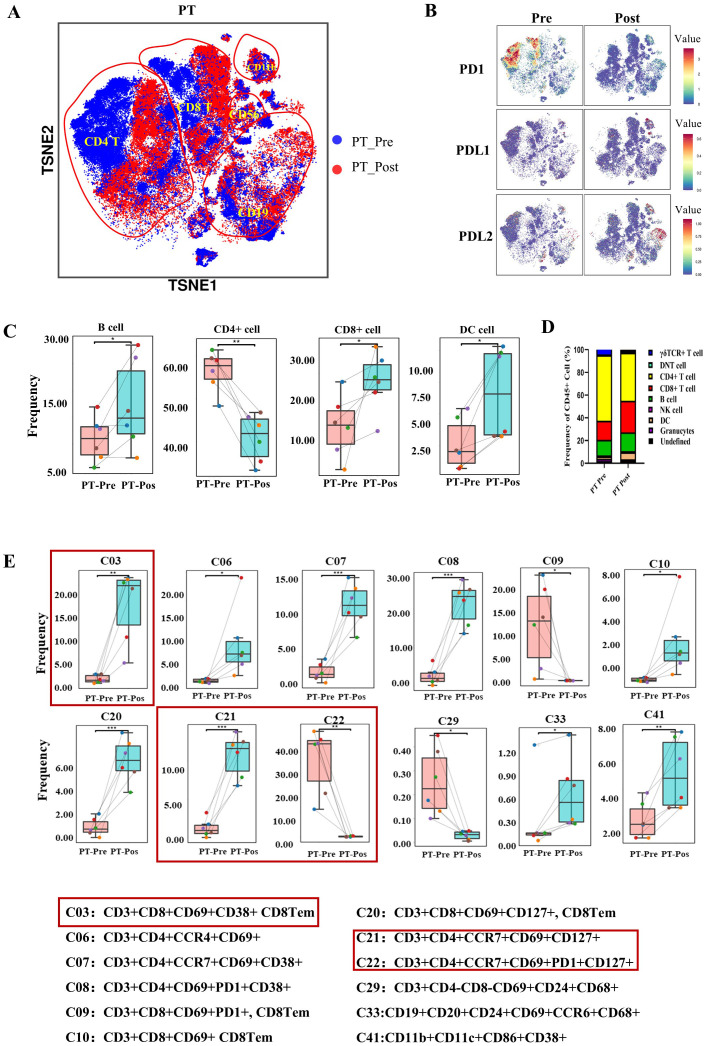
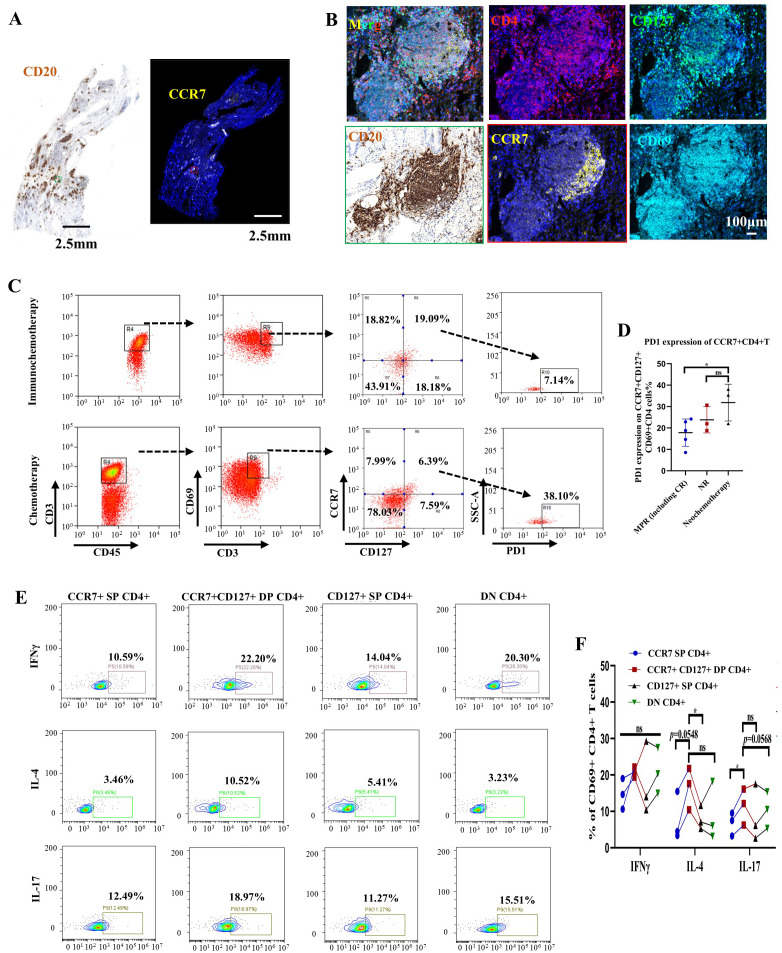
Methods: This study initially compared the tertiary lymphoid structures (TLSs) density among patients who underwent immunochemotherapy, chemotherapy and upfront surgery using 123 tumor samples from stage-matched patients. Multiplex immunohistochemistry (mIHC) was employed to analyze the spatial distribution of PD-L1+CD11c+ cells and PD1+CD8+ T cells within TLSs. Cytometry by time-of-flight (CyTOF) was used to assess immune cell dynamics in paired biopsy and resection specimens from six patients who underwent immunochemotherapy. Key immune cells were validated in newly collected samples using flow cytometry, mIHC, and in vitro CAR-T cells model.

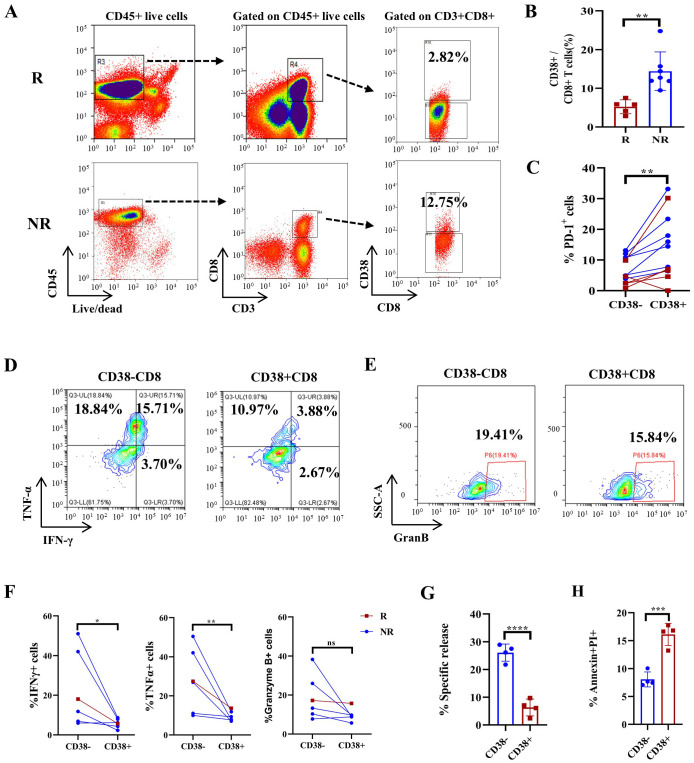
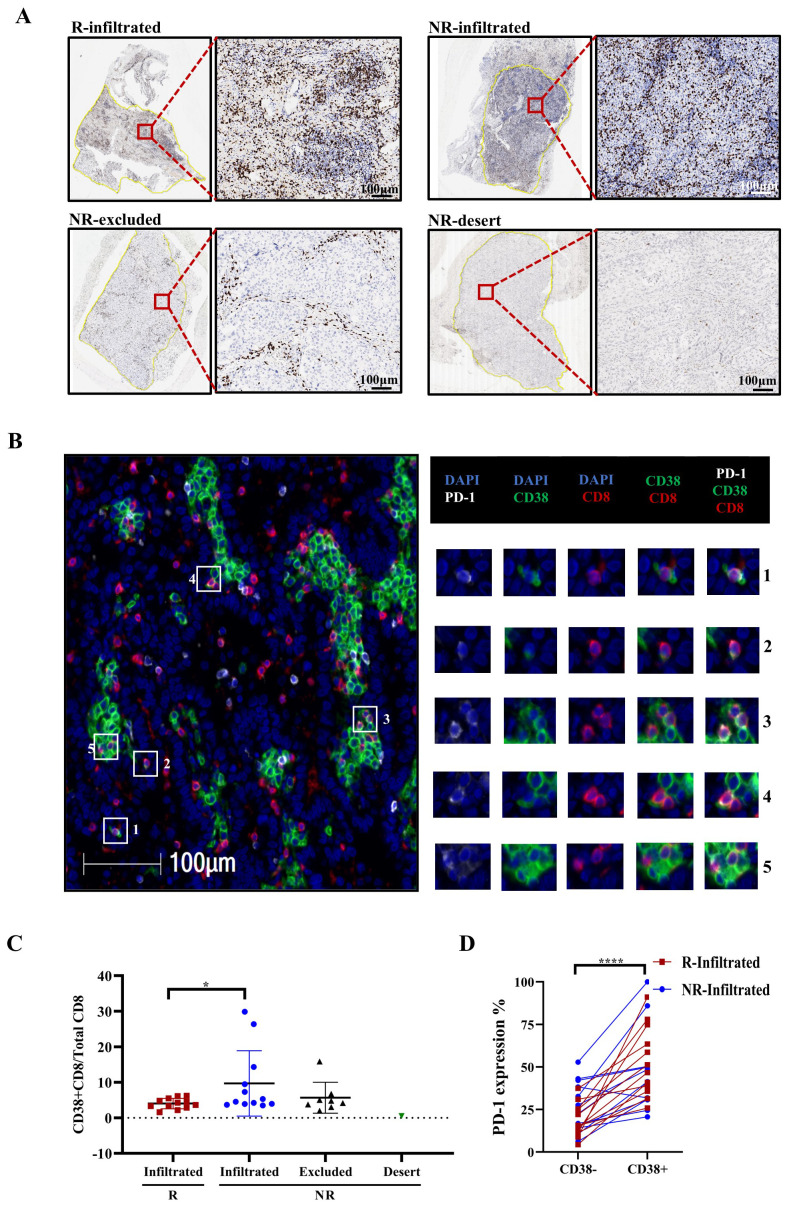
Results: Patients who underwent neoadjuvant chemotherapy or immunochemotherapy exhibited increased TLSs compared to those who opted for upfront surgery. The TLS area-to-tumor area ratio distinguished pCR+MPR and NR patients in the immunochemotherapy group. Spatial analysis revealed variations in the distance between PD-L1+CD11c+ cells and PD1+CD8+ T cells within TLSs in the immunochemotherapy group. CyTOF analysis revealed an increase in the frequency of key immune cells (CCR7+CD127+CD69+CD4+ and CD38+CD8+ cells) following combined therapy. Treatment responders exhibited an increase in CCR7+CD4+ T cells, whereas CD38+CD8+ T cells were associated with compromised treatment effectiveness.

Conclusions: Immunochemotherapy and chemotherapy increase TLSs and granzyme B+ CD8+ T cells in tumors. The TLS area-to-tumor ratio distinguishes responders from non-responders, with PD-L1+ dendritic cells near CD8+PD-1+ T cells linked to efficacy, suggesting that PD-1 inhibitors disrupt harmful interactions. Post-immunochemotherapy, CD8+ T cells increase, but CD38+CD8+ T cells show reduced functionality. These findings highlight the complex immune dynamics and their implications for NSCLC treatment.

Keywords: CCR7+CD4+ T cells; CD38+CD8+ T cells; NSCLC; immunochemotherapy; tertiary lymphoid structures (TLSs); the axis of PD-L1+CD11c+ cells and PD1+CD8+ T cells.


Conflict of interest statement

The authors declare that the research was conducted in the absence of any commercial or financial relationships that could be construed as a potential conflict of interest.

Figures

Figure 1
Figure 1
Correlations between pathological response and TLS characteristics. (A–C) Representative immunohistochemistry (IHC) images of tumor sections stained with CD20 from patients who received immunochemotherapy, chemotherapy, or upfront surgery, respectively. (D, E) Comparison of TLS density and TLS/tumor area ratios among the immunochemotherapy, chemotherapy, and upfront surgery groups. n≥21. (F, G) Comparison of TLS density and ratios of TLS/tumor area between responders (major pathological response [MPR] or pathological complete response [pCR]) and nonresponders in the immunochemotherapy group. The data are shown as the means ± SDs; n ≥25. Statistical significance was determined using one-way ANOVA with multiple comparisons in (D, E). Mann−Whitney tests were performed to determine statistical significance (F, G). *p < 0.05, **p < 0.01, ***p < 0.001, ns, not significant.
Figure 2
Figure 2
Characterization of CD8+ cells near tertiary lymphoid structures (TLSs) in the immunochemotherapy, chemotherapy and upfront surgery groups. (A) Representative images of HE, CD20, CD8, and granzyme B staining in the immunochemotherapy, chemotherapy, and upfront surgery groups at various magnifications. Black scale bars=200 μm, white scale bars=100 μm. (B) Bar plot showing the quantification of CD8+ lymphocytes in tumors corresponding to CD8+ T cells per square millimetre. (C) Bar plot showing the quantification of granzyme B in tumors per square millimetre. The data are shown as the means ± SDs; n ≥21. Statistical significance was determined using one-way ANOVA with multiple comparisons in (B, C). *p < 0.05, **p < 0.01, ***p < 0.001, ns, not significant.
Figure 3
Figure 3
The spatial distribution of PD1 CD8+ DC PDL1 colocalization in tertiary lymphoid structures (TLSs) is an indicator of the response of patients with NSCLC following neoadjuvant immunochemotherapy. (A) Multiplex immunohistochemistry (mIHC) staining of a representative tumor section showing the coexpression of PD-L1 (yellow), CD68 (red), and CD11c (green) in TLSs, with nuclei counterstained with DAPI (blue). White scale bars=100 μm. (B) The percentages of CD11c+ cells and CD68+ cells among PD-L1+ cells. n=8. (C) Representative image of IHC and immunofluorescence staining of serial tissue sections after immunochemotherapy. The red arrow in the IHC image indicates the TLSs shown in the immunofluorescence images. The arrow indicates the area with high magnification/TLS. Digital markup image showing the color coding of CD8+ (cyan), PD-1 (green), PD-L1 (red), and CD11c (yellow). The peritumoral (PT) TLSs and intratumoral (IT) TLSs were annotated. Black and white scale bars=500 μm (left) and 50 μm (right), respectively. (D) Representative composite image depicting proximity analysis between CD8+PD-1+ and CD11c+PD-L1+ cells using the HALO software spatial analysis module in responders and nonresponders after treatment with immunochemotherapy. (E) Immunofluorescence analysis of the distance between CD8+PD-1/CD11c+PD-L1 interactions in PTs. n≥12. Paired t tests were performed to determine statistical significance, as shown in (B). Mann−Whitney tests were performed, and the results are shown in (E). *p < 0.05, **p < 0.01, ***p < 0.001, ****p < 0.0001, ns, not significant.
Figure 4
Figure 4
The immune landscape of patients with NSCLC before and after preoperative immunochemotherapy, as determined using CyTOF. (A) The t-distributed stochastic neighbour embedding (t-SNE) plot displays the overall distribution of different immune cell clusters between pre- and posttreatment in the primary tumor. (B) t-SNE plots showing PD-1, PD-L1 and PD-L2 expression on immune cells in primary tumors in the pre- and posttreatment groups. (C) Box plot comparing the relative abundance of 9 immune cell clusters pre- and posttreatment in primary tumors. (D) Composition of CD45+ immune cells (except for neutrophils) in primary tumors before and after treatment. (E) Bar plot showing the immune cell phenotype with a significant difference between pre- and posttreatment values in the primary tumor. The refined phenotypes identified from CyTOF analyses with significance are shown below the bar plots. The data are shown as the mean ± SD, n = 6. Paired t tests were performed to determine statistical significance. *p < 0.05, **p < 0.01, ***p < 0.001, ****p < 0.0001, ns, not significant.
Figure 5
Figure 5
CCR7+CD127+CD4+ T cells near tertiary lymphoid structures (TLSs) might be involved in maintaining B-cell function in patients with NSCLC following immunochemotherapy. (A) Representative image of immunohistochemical (IHC) and immunofluorescence staining of serial tumor sections after treatment with a PD-1 inhibitor plus chemotherapy. Black scale bar=2.5 mm, white scale bar=2.5 mm. (B) Multiplex IHC staining of a representative tumor section showing the coexpression of CD4 (red), CD69 (cyan), CD127 (green), and CCR7 (yellow). White scale bar=100 μm. (C) Gating strategy for identifying PD-1 expression in CCR7+CD127+CD4 T cells subjected to immunochemotherapy (upper) or chemotherapy (lower). (D) Statistical analysis showing PD-1 expression on CCR7+CD127+CD4 subsets in primary tumors following immunochemotherapy (grouped according to pathological response) or chemotherapy. n≥3. (E) Representative flow cytometry plots showing IFNγ, IL-4, and IL-17 expression in different CD4+ T-cell subsets (CCR7+ SP CD4+, CCR7+CD127+ DP CD4+, CD127+ SP CD4+ and DN CD4+) isolated from primary tumors. (F) Statistical analysis showing IFNγ, IL-4, and IL-17 expression. n=3. Each dot represents an independent data point as determined by flow cytometry. The data are shown as the means ± SDs; n ≥3. Statistical significance was determined using one-way ANOVA with multiple comparisons in (D, F). p < 0.05, **p < 0.01, ***p < 0.001, ns, not significant.
Figure 6
Figure 6
FACS-based quantification of CD38+CD8+ T cells predicts treatment response in an NSCLC cohort and CD38 overexpression-induced T-cell apoptosis and dysfunction. (A) Representative gating strategy for CD38+CD8+ T cells in responders (R) and nonresponders (NR) after immunochemotherapy. (B) Boxplots showing the proportion of CD38-positive CD8+ T cells in tumor tissue. n=12. (C) The proportion of PD-1-expressing CD38+ and CD38- T cells in tumor tissues. n=12. (D) Representative flow cytometry plots showing the expression of IFNγ and TNFα in CD38+ CD8+ and CD38- CD8+ T cells. (E) Representative flow cytometry plots showing the expression of granzyme B in CD38+ CD8+ and CD38- CD8+ T cells. (F) Statistical analysis showing IFNγ, TNFα and granzyme B expression in responsive patients and nonresponsive patients. n=6. (G) Specific analyses using EuTDA cytotoxicity assays. (H) Boxplots showing the proportions of PI/Annexin-V+ cells among control CAR-T cells and CD38 OE CAR-T cells in (G) The data are shown as the means ± SDs, n = 6. Mann−Whitney tests were performed to determine statistical significance. Paired t tests were performed to determine statistical significance in (C, F) *p < 0.05, **p < 0.01, ***p < 0.001, ****p < 0.0001, ns, not significant.
Figure 7
Figure 7
Multiplex immunohistochemistry (mIHC) revealed that the proportion of CD38+ CD8+/CD8+ T cells corresponded with no response. (A) T-cell infiltration defined by immunohistochemistry (IHC) staining. Representative IHC images of CD8+ T cells in different patient groups, classified according to CD8+ T-cell density and distribution. The black and white scale bars represent 100 μm, respectively. (B) mIHC staining of a representative tumor section showing the co-expression of PD-1 (white), CD38 (green), and CD8 (red). Squares 1-5 show representative CD38+CD8+ T cells with PD-1 colocalization. White scale bars=100 μm. (C) Frequency of CD38 expression on CD8+ T cells in different patient groups. R=responder, NR=non-responder. Mann−Whitney tests were performed to determine statistical significance. n=12. ns = not significant, *p < 0.05, **p < 0.01, ***p < 0.001, ****p < 0.0001; ns, not significant. (D) Frequency of PD-1 expression on CD38- and CD38+ CD8+ T cells. n=24 (n=12 for both R and NR-infiltrated groups). ns = not significant, *p < 0.05, **p < 0.01, ***p < 0.001, ****p < 0.0001; ns, not significant.

Similar articles

Cited by

References

    1. Masago K, Seto K, Fujita S, Sasaki E, Hosoda W, Kuroda H. Long-term recurrence of completely resected NSCLC. JTO Clin Res Rep. (2020) 1:100076. doi: 10.1016/j.jtocrr.2020.100076 - DOI - PMC - PubMed
    1. Uprety D, Mandrekar SJ, Wigle D, Roden AC, Adjei AA. Neoadjuvant immunotherapy for NSCLC: current concepts and future approaches. J Thorac Oncol. (2020) 15:1281–97. doi: 10.1016/j.jtho.2020.05.020 - DOI - PubMed
    1. Fruh M, Betticher DC, Stupp R, Xyrafas A, Peters S, Ris HB, et al. . Multimodal treatment in operable stage III NSCLC: a pooled analysis on long-term results of three SAKK trials (SAKK 16/96, 16/00, and 16/01). J Thorac Oncol. (2019) 14:115–23. doi: 10.1016/j.jtho.2018.09.011 - DOI - PubMed
    1. Provencio M, Nadal E, Insa A, Garcia-Campelo MR, Casal-Rubio J, Domine M, et al. . Neoadjuvant chemotherapy and nivolumab in resectable non-small-cell lung cancer (NADIM): an open-label, multicentre, single-arm, phase 2 trial. Lancet Oncol. (2020) 21:1413–22. doi: 10.1016/S1470-2045(20)30453-8 - DOI - PubMed
    1. Provencio M, Nadal E, Gonzalez-Larriba JL, Martinez-Marti A, Bernabe R, Bosch-Barrera J, et al. . Perioperative nivolumab and chemotherapy in stage III non-small-cell lung cancer. N Engl J Med. (2023) 389:504–13. doi: 10.1056/NEJMoa2215530 - DOI - PubMed

MeSH terms

Substances