. 2024 Dec:7:100101.
doi: 10.1016/j.brain.2024.100101. Epub 2024 Oct 1.

Quantifying CSF Dynamics disruption in idiopathic normal pressure hydrocephalus using phase lag between transmantle pressure and volumetric flow rate

Affiliations

Quantifying CSF Dynamics disruption in idiopathic normal pressure hydrocephalus using phase lag between transmantle pressure and volumetric flow rate

Pragalv Karki et al. Brain Multiphys. 2024 Dec.

Abstract

Background and purpose: Idiopathic normal pressure hydrocephalus (iNPH) is a cerebrospinal fluid (CSF) dynamics disorder as evidenced by the delayed ascent of radiotracers over the cerebral convexity on radionuclide cisternography. However, the exact mechanism causing this disruption remains unclear. Elucidating the pathophysiology of iNPH is crucial, as it is a treatable cause of dementia. Improving the diagnosis and treatment prognosis rely on the better understanding of this disease. In this study, we calculated the pulsatile transmantle pressure and investigated the phase lag between this pressure and the volumetric CSF flow rate as a novel biomarker of CSF dynamics disruption in iNPH.

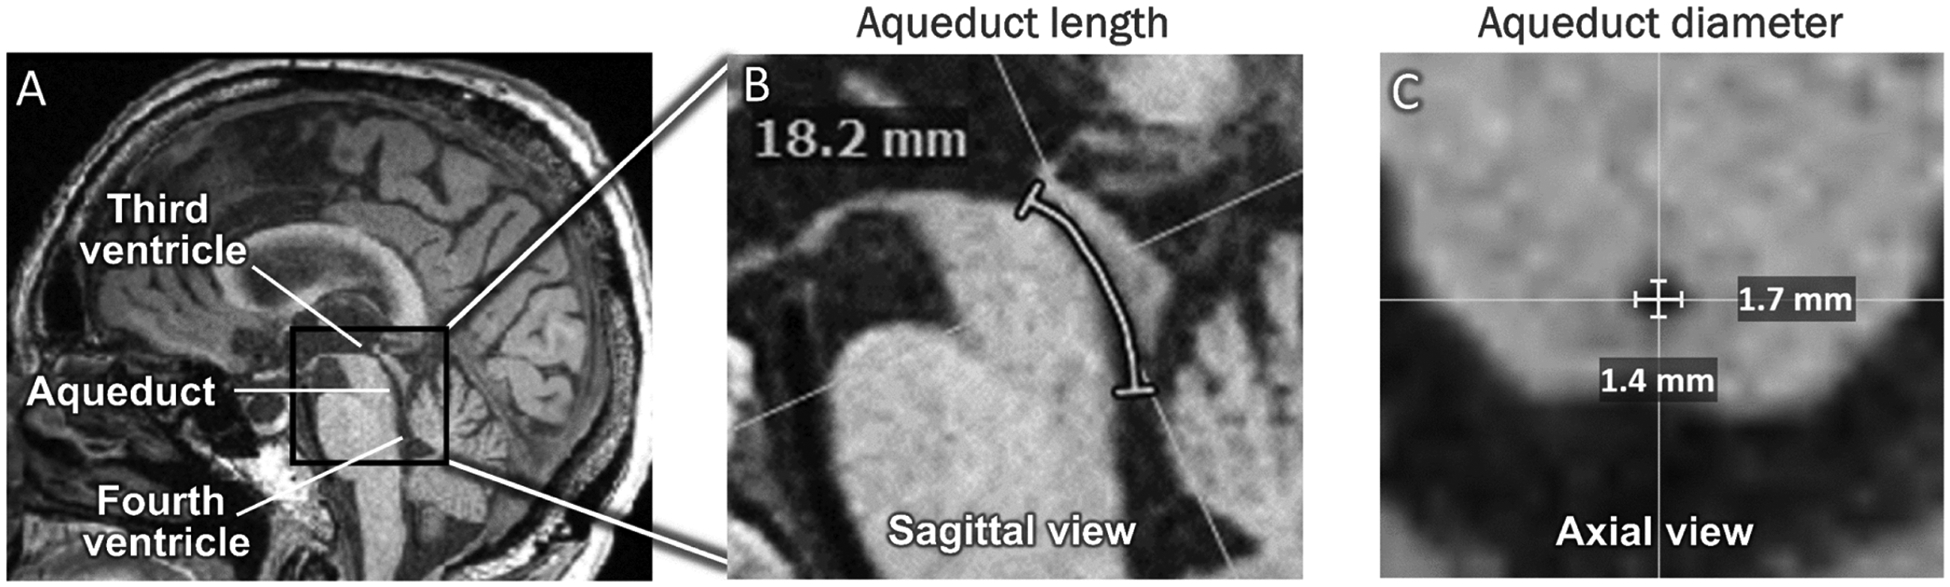
Methods: 44 iNPH patients and 44 age- and sex-matched cognitively unimpaired (CU) control participants underwent MRI scans on a 3T Siemens scanner. Pulsatile transmantle pressure was calculated analytically and computationally using volumetric CSF flow rate, cardiac frequency, and aqueduct dimensions as inputs. CSF flow rate through the aqueduct was acquired using phase-contrast MRI. The aqueduct length and radius were measured using 3D T1-weighted anatomical images.

Results: Peak pressure amplitudes and the pressure load (integrated pressure exerted over a cardiac cycle) were similar between the groups, but the non-dimensionalized pressure load (adjusted for anatomical factors) was significantly lower in the iNPH group ( p < 0.001 , Welch's t-test). The phase lag between the pressure and the flow rate, arising due to viscous drag, was significantly higher in the iNPH group ( p < 0.001 ).

Conclusion: The increased phase lag is a promising new biomarker for quantifying CSF dynamics dysfunction in iNPH.

Statement of significance: The exact mechanism causing the disruption of CSF circulation in idiopathic normal pressure hydrocephalus (iNPH) remains unclear. Elucidating the pathophysiology of iNPH is crucial, as it is a treatable cause of dementia. In this study, we provided an analytical and a computational method to calculate the pulsatile transmantle pressure and the phase lag between the pressure and the volumetric CSF flow rate across the cerebral aqueduct. The phase lag was significantly higher in iNPH patients than in controls and may serve as a novel biomarker of CSF dynamics disruption in iNPH.

Keywords: Csf dynamics disorder; Normal pressure hydrocephalus; Phase lag; Phase-contrast mri; Transmantle pressure; Womersley number.


Conflict of interest statement

Declaration of competing interest The authors declare that they have no known competing financial interests or personal relationships that could have appeared to influence the work reported in this paper.

Figures

Fig. 1.
Fig. 1.
A) A T1-weighted anatomical image in a sagittal view showing the third ventricle, cerebral aqueduct, and fourth ventricle. B) An expanded view showing the length measurement using the multi-planar reformatting tool. C) Measurements of the aqueduct diameter in the anterior-posterior and left-right directions. The radius was half the average of the two diameters.
Fig. 2.
Fig. 2.
Input quantities: A) Aqueduct radius R, which is significantly higher in iNPH, B) Aqueduct length L, which is significantly reduced in iNPH, and C) Cardiac frequency ω, which is similar between the groups. D) and E) CSF volumetric flow rate across the aqueduct over the cardiac cycle in CU and iNPH participants, respectively. The scale of the y-axis in plots D) and E) indicate that the flow rate is on average higher in iNPH participants.
Fig. 3.
Fig. 3.
Other relevant parameters: A) Stroke length across the aqueduct is significantly higher in iNPH. B) Womersley number α=Rω/ν is also significantly higher in iNPH.
Fig. 4.
Fig. 4.
Output quantities: A) and B) Transmantle pressure calculated using the computational method in CU and iNPH participants, respectively. The pressure is shown in the units of Pascal (Pa). C) Peak pressure in the cranio-caudal cycle, D) peak pressure in the caudo-cranial cycle, and E) pressure load (the integrated pressure exerted over the cardiac cycle) are all similar between the groups.
Fig. 5.
Fig. 5.
Non-dimensionalized volumetric flow rate Q¯(τ) and transmantle pressures Π(τ) and Πw(τ) for (A) a control and (B) an iNPH case. Π(τ) was calculated using the computational method and Πw(τ) using the analytical solution. Q¯(τ) was fitted to PC-MRI datapoints (black markers) using three Fourier modes. The non-dimensionalized time τ ranges from 0 to 2π, corresponding to 0 – 100 in % cardiac cycle. The time delay varies throughout the cardiac cycle prompting the use of a fast Fourier transform method to estimate the overall phase lag Δϕ.
Fig. 6.
Fig. 6.
(A) Dimensionless pressure load Πload, (B) phase lag Δϕ, and (C) inverse relation between the two quantities. Non-dimensionalized pressure load is significantly reduced in iNPH whereas the phase lag is significantly elevated. (C) Inverse relation between the two quantities is demonstrated with a high 2 of a linear fit.
Fig. 7.
Fig. 7.
(A) Phase lag Δϕ as a function of the square of the Womersley number (Stokes number). The fit line is based on numerical values from Womersley’s original manuscript and are reproduced in Table 2. The open (black) markers are phase lag calculated using analytical solution for the transmantle pressure in the limit Ls/L1 (reducing to Womersley’s problem), yielding solutions closer to the fit line. Colored markers are phase lags computed using the computational method which included the convective term. (B) The discrepancy in the phase lag between the computational method and the analytical method increases with increasing Stokes number. The discrepancy is larger in iNPH cases due to increased stroke length Ls and the effect of convective flow as shown by percentage error bars.

Similar articles

Cited by

References

    1. Cogswell PM, et al., CSF dynamics disorders: Association of brain MRI and nuclear medicine cisternogram findings, NeuroImage: Clin 28 (2020) 102481, 10.1016/j.nicl.2020.102481, 2020/01/01/. - DOI - PMC - PubMed
    1. Patten DH, Benson DF, Diagnosis of normal-pressure hydrocephalus by RISA cisternography, J. Nucl. Med 9 (8) (1968) 457–461. - PubMed
    1. David CM, John CH, Giovanni Di C, Ayub KO, Prognostic criteria for cerebrospinal fluid shunting from isotope cisternography in communicating hydrocephalus, Neurology 20 (6) (1970) 594, 10.1212/WNL.20.6.594. - DOI - PubMed
    1. Luetmer PH, et al., Measurement of cerebrospinal fluid flow at the cerebral aqueduct by use of phase-contrast magnetic resonance imaging: technique validation and utility in diagnosing idiopathic normal pressure hydrocephalus (in eng), Neurosurg. 50 (3) (2002) 534–543, 10.1097/00006123-200203000-00020. discussion 543–4, Mar. - DOI - PubMed
    1. Lindstrøm EK, Ringstad G, Mardal K-A, Eide PK, Cerebrospinal fluid volumetric net flow rate and direction in idiopathic normal pressure hydrocephalus, NeuroImage Clin 20 (2018) 731–741, 10.1016/j.nicl.2018.09.006, 2018/01/01/. - DOI - PMC - PubMed

LinkOut - more resources