

CT-based radiomics features for the differential diagnosis of nodular goiter and papillary thyroid carcinoma: an analysis employing propensity score matching
- PMID: 39726704
- PMCID: PMC11669662
- DOI: 10.3389/fonc.2024.1465941
CT-based radiomics features for the differential diagnosis of nodular goiter and papillary thyroid carcinoma: an analysis employing propensity score matching
Abstract
Purpose: This study aims to evaluate the effectiveness of CT-based radiomics features in discriminating between nodular goiter (NG) and papillary thyroid carcinoma (PTC).
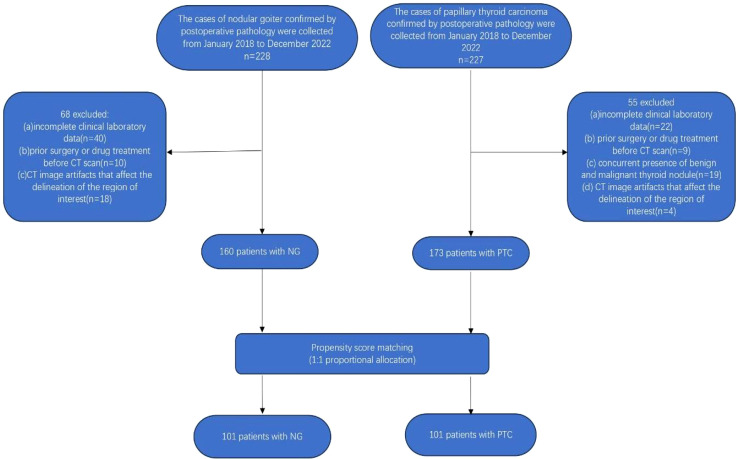
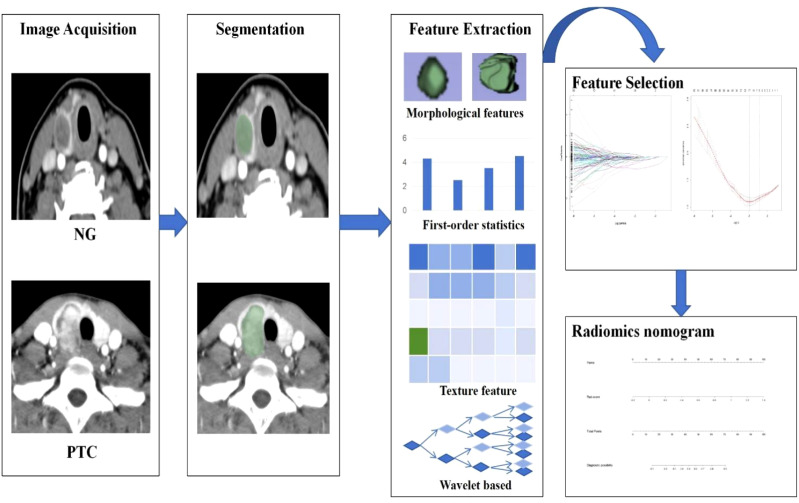
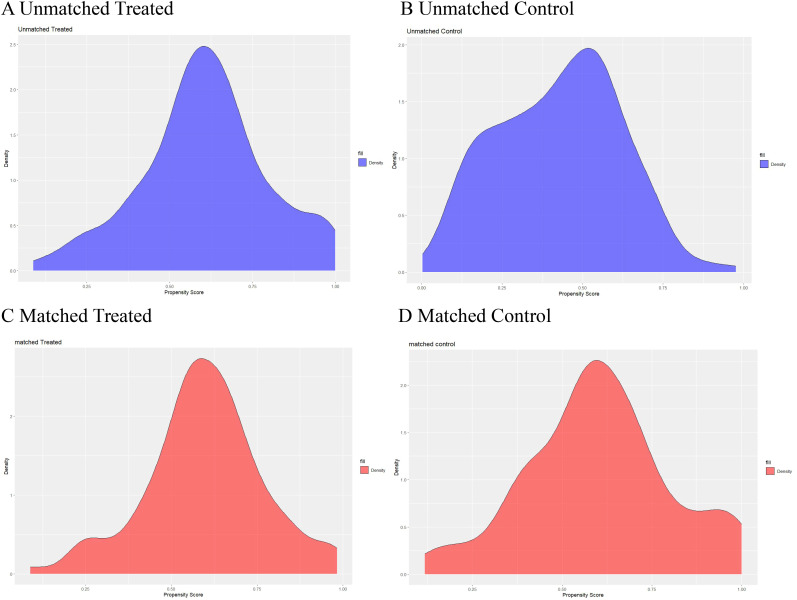
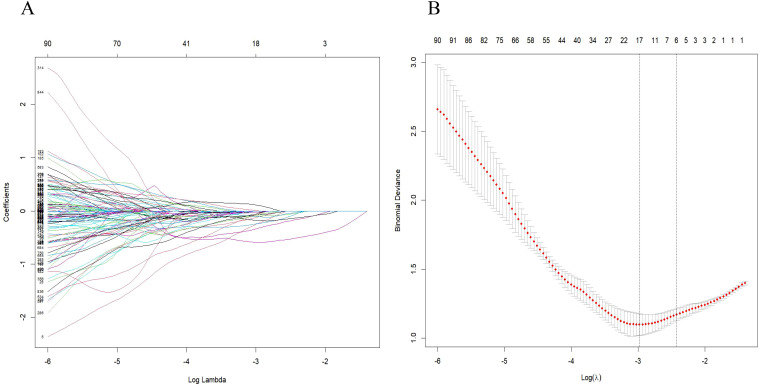
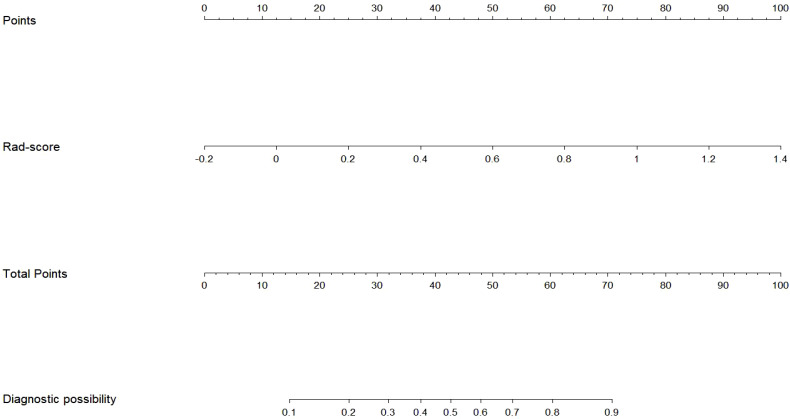
Methods: A retrospective cohort comprising 228 patients with nodular goiter (NG) and 227 patients with papillary thyroid carcinoma (PTC) diagnosed between January 2018 and December 2022 was consecutively enrolled. Propensity score matching (PSM) was applied to align patients with NG and PTC. A total of 851 radiomics features were extracted from CT images acquired during the arterial phase for each individual. Feature selection was carried out utilizing the least absolute shrinkage and selection operator (LASSO) logistic regression algorithm to generate the radiomics score (Rad-score). Subsequently, the Rad-score was incorporated into a multivariate logistic regression analysis to construct a radiomics nomogram for visual representation.
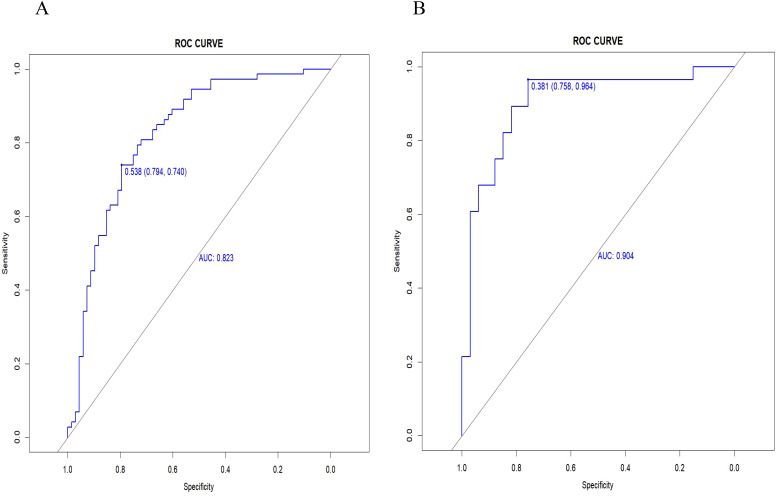
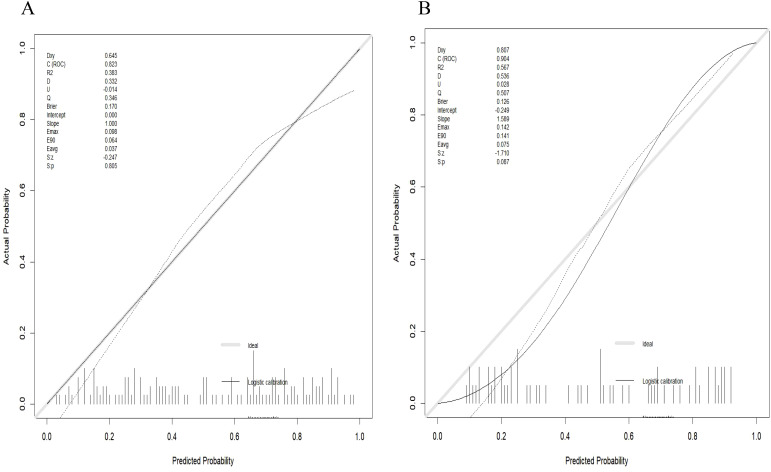
Results: Following PSM implementation, 101 patients diagnosed with NG were matched with an equivalent number of patients diagnosed with PTC. The developed radiomics score exhibited excellent predictive performance in distinguishing between NG and PTC, with high values of AUC, sensitivity, and specificity in both the training cohort (AUC = 0.823, accuracy = 0.759, sensitivity = 0.794, specificity = 0.740) and validation cohort (AUC = 0.904, accuracy = 0.820, sensitivity = 0.758, specificity = 0.964).
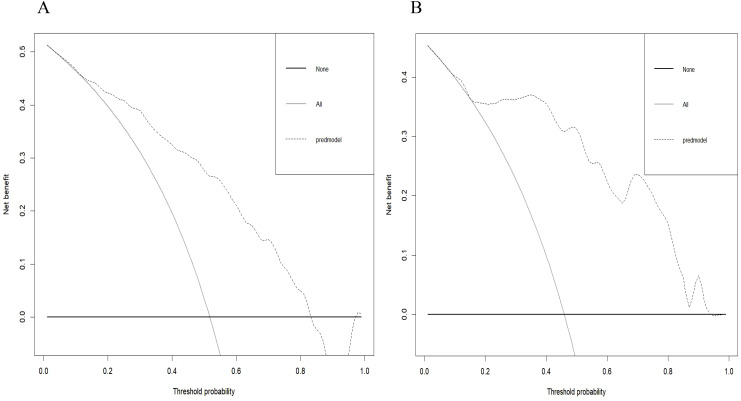
Conclusion: The utilization of CT-based radiomics analysis following PMS offers a quantitative and data-driven approach to enhance the accuracy of distinguishing between nodular goiter (NG) and papillary thyroid carcinoma (PTC).
Keywords: computed tomography; nodular goiter; papillary thyroid carcinoma; propensity score matching; radiomics.
Copyright © 2024 Zhang, Li, Zhang and Li.
Conflict of interest statement
The authors declare that the research was conducted in the absence of any commercial or financial relationships that could be construed as a potential conflict of interest.
Figures
Similar articles
-
Contrast-Enhanced CT-Based Radiomics for the Differentiation of Nodular Goiter from Papillary Thyroid Carcinoma in Thyroid Nodules.Cancer Manag Res. 2022 Mar 14;14:1131-1140. doi: 10.2147/CMAR.S353877. eCollection 2022. Cancer Manag Res. 2022. PMID: 35342307 Free PMC article.
-
CT Radiomics-Based Nomogram for Predicting the Lateral Neck Lymph Node Metastasis in Papillary Thyroid Carcinoma: A Prospective Multicenter Study.Acad Radiol. 2023 Dec;30(12):3032-3046. doi: 10.1016/j.acra.2023.03.039. Epub 2023 May 18. Acad Radiol. 2023. PMID: 37210266
-
A CT based radiomics analysis to predict the CN0 status of thyroid papillary carcinoma: a two- center study.Cancer Imaging. 2024 May 15;24(1):62. doi: 10.1186/s40644-024-00690-y. Cancer Imaging. 2024. PMID: 38750551 Free PMC article.
-
Ultrasound-based nomogram to predict the recurrence in papillary thyroid carcinoma using machine learning.BMC Cancer. 2024 Jul 7;24(1):810. doi: 10.1186/s12885-024-12546-6. BMC Cancer. 2024. PMID: 38972977 Free PMC article.
-
T1 mapping and reduced field-of-view DWI at 3.0 T MRI for differentiation of thyroid papillary carcinoma from nodular goiter.Clin Physiol Funct Imaging. 2023 May;43(3):137-145. doi: 10.1111/cpf.12803. Epub 2022 Dec 3. Clin Physiol Funct Imaging. 2023. PMID: 36440541 Review.
References
LinkOut - more resources
Full Text Sources
Miscellaneous