. 2022 Dec 21;9(12):4017-4029.
doi: 10.1021/acsphotonics.2c01493. Epub 2022 Dec 9.

Label-Free Metabolic Imaging In Vivo by Two-Photon Fluorescence Lifetime Endomicroscopy

Affiliations

Label-Free Metabolic Imaging In Vivo by Two-Photon Fluorescence Lifetime Endomicroscopy

Wenxuan Liang et al. ACS Photonics. .

Abstract

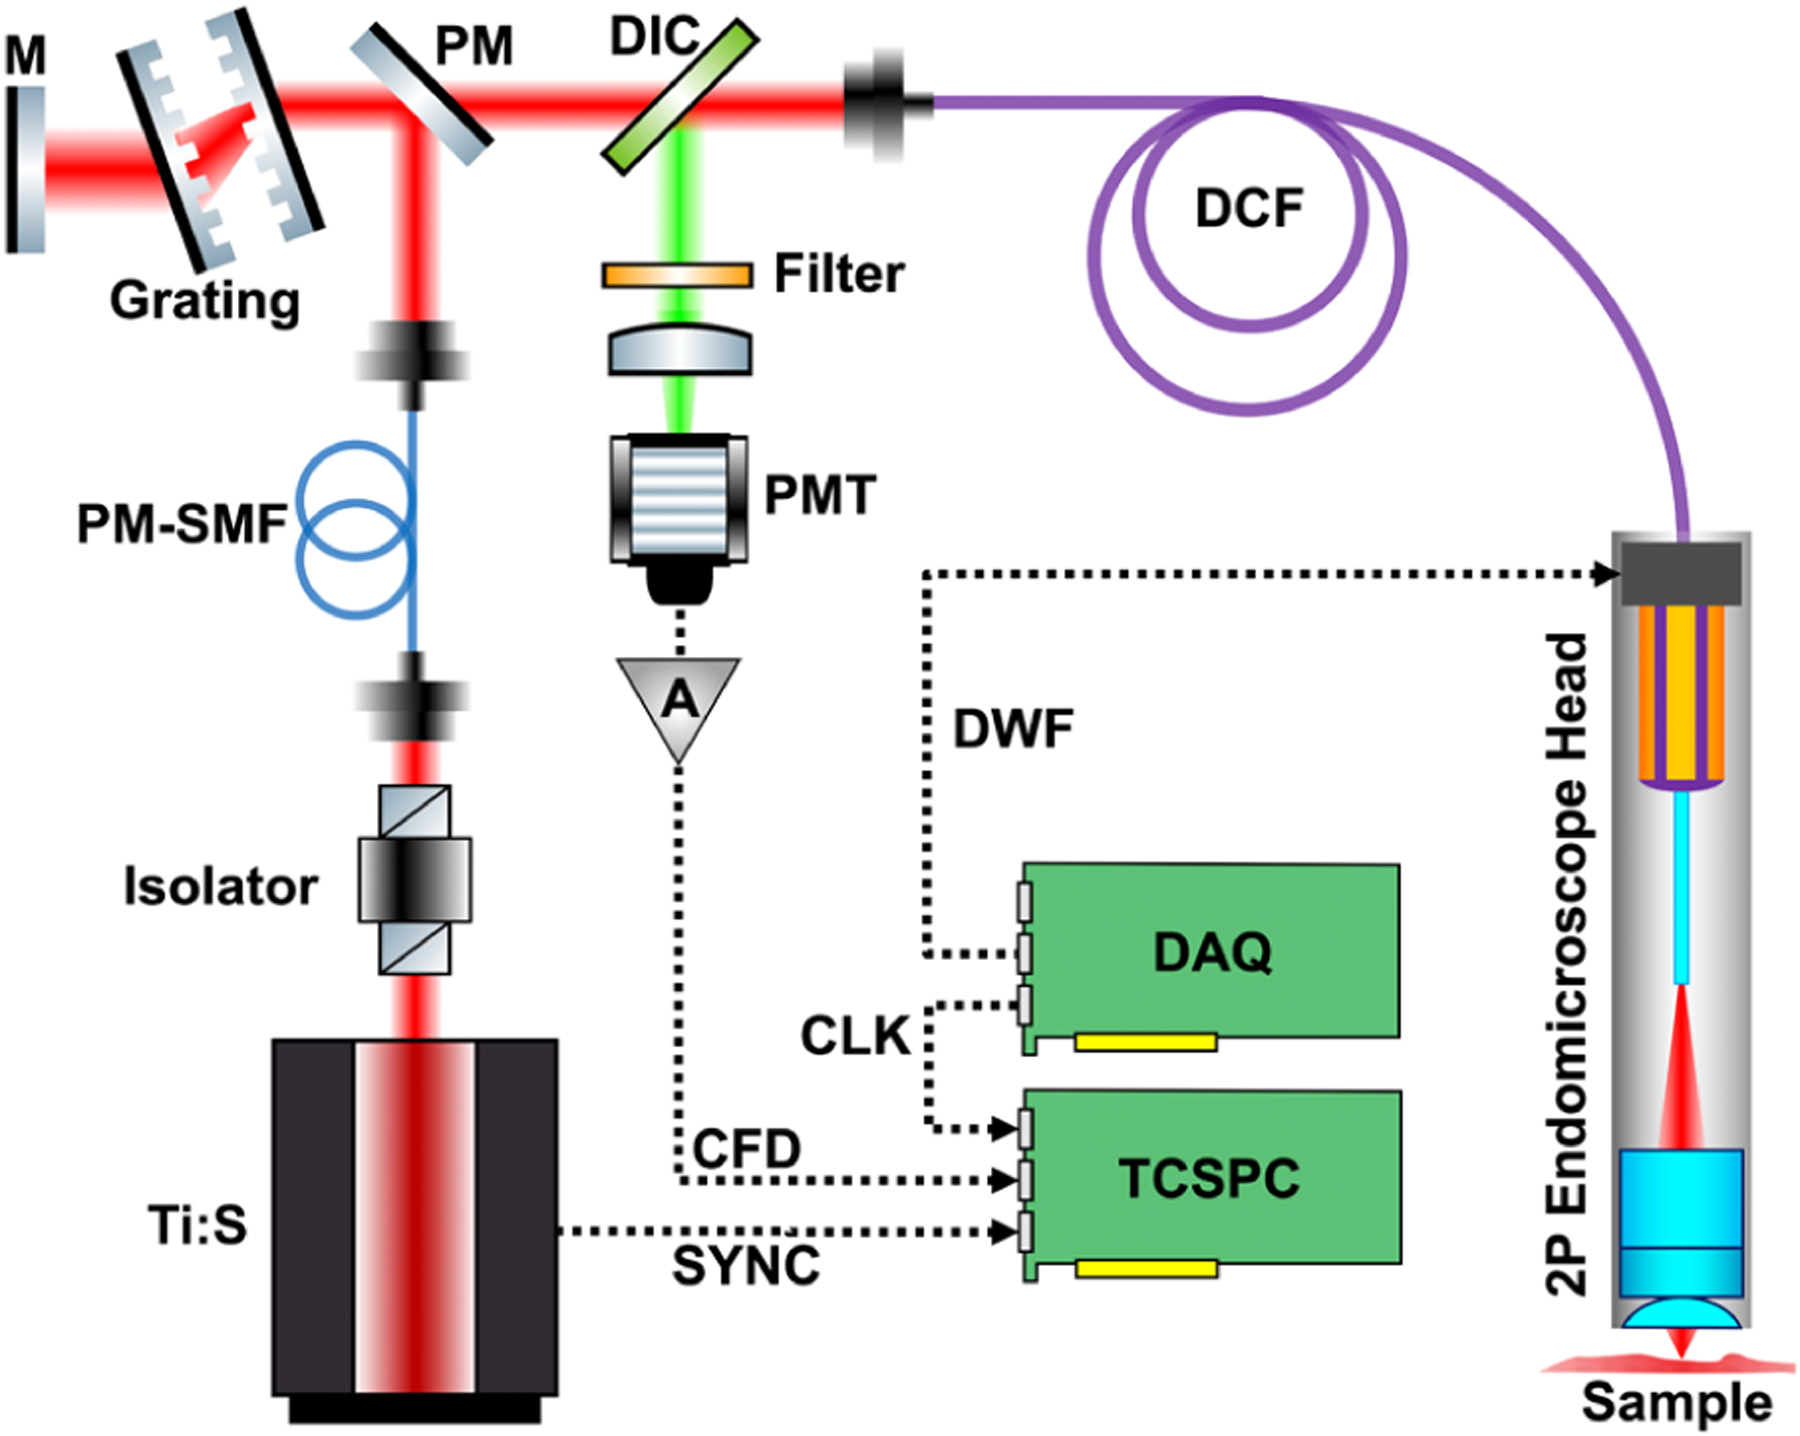
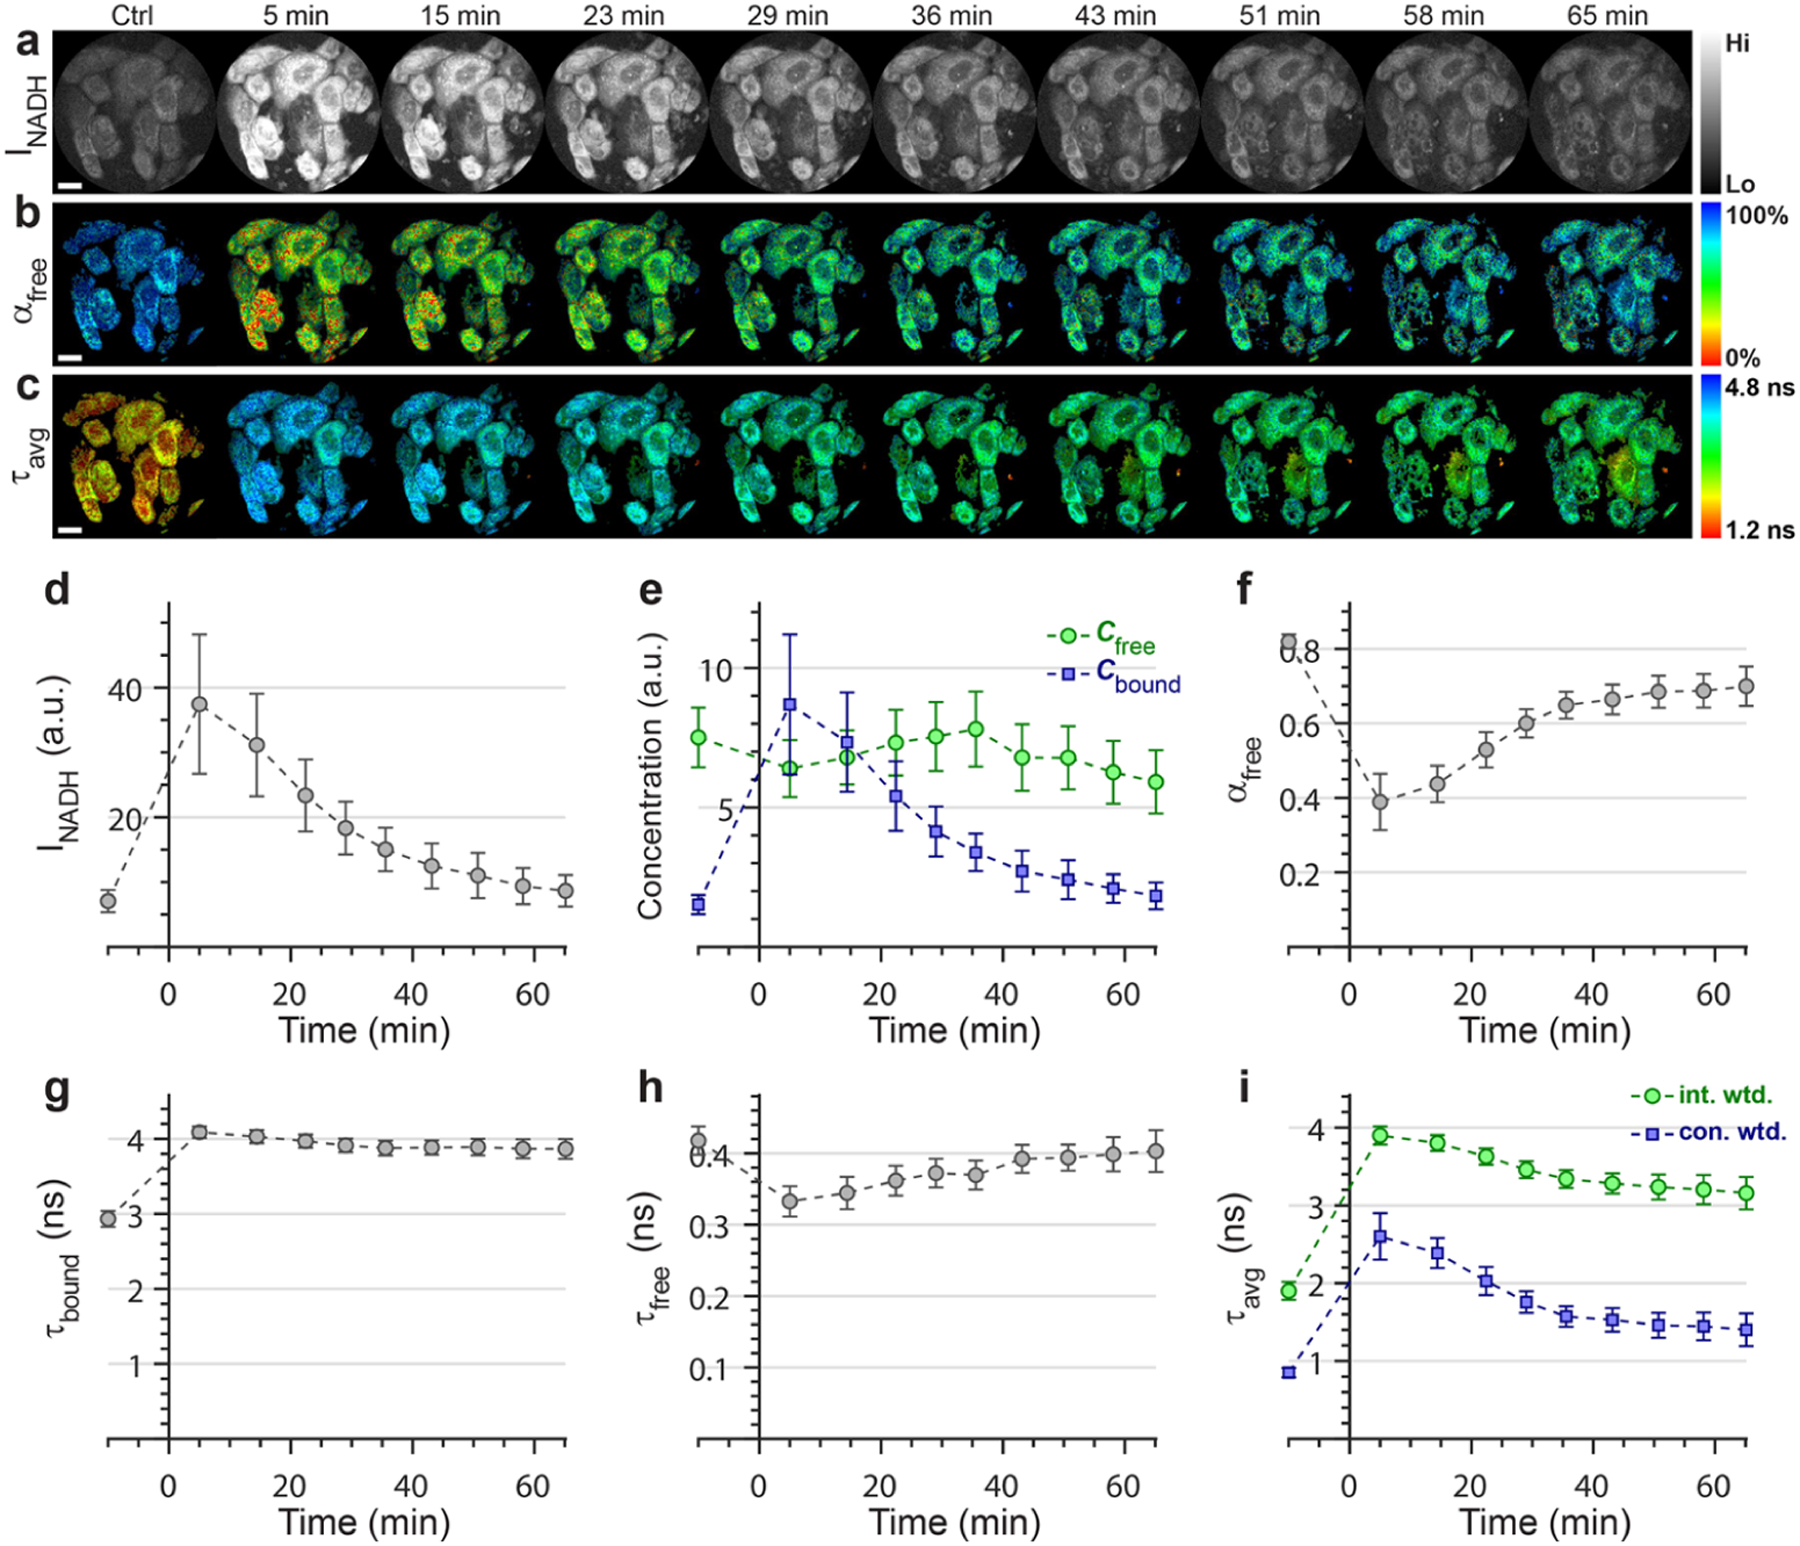
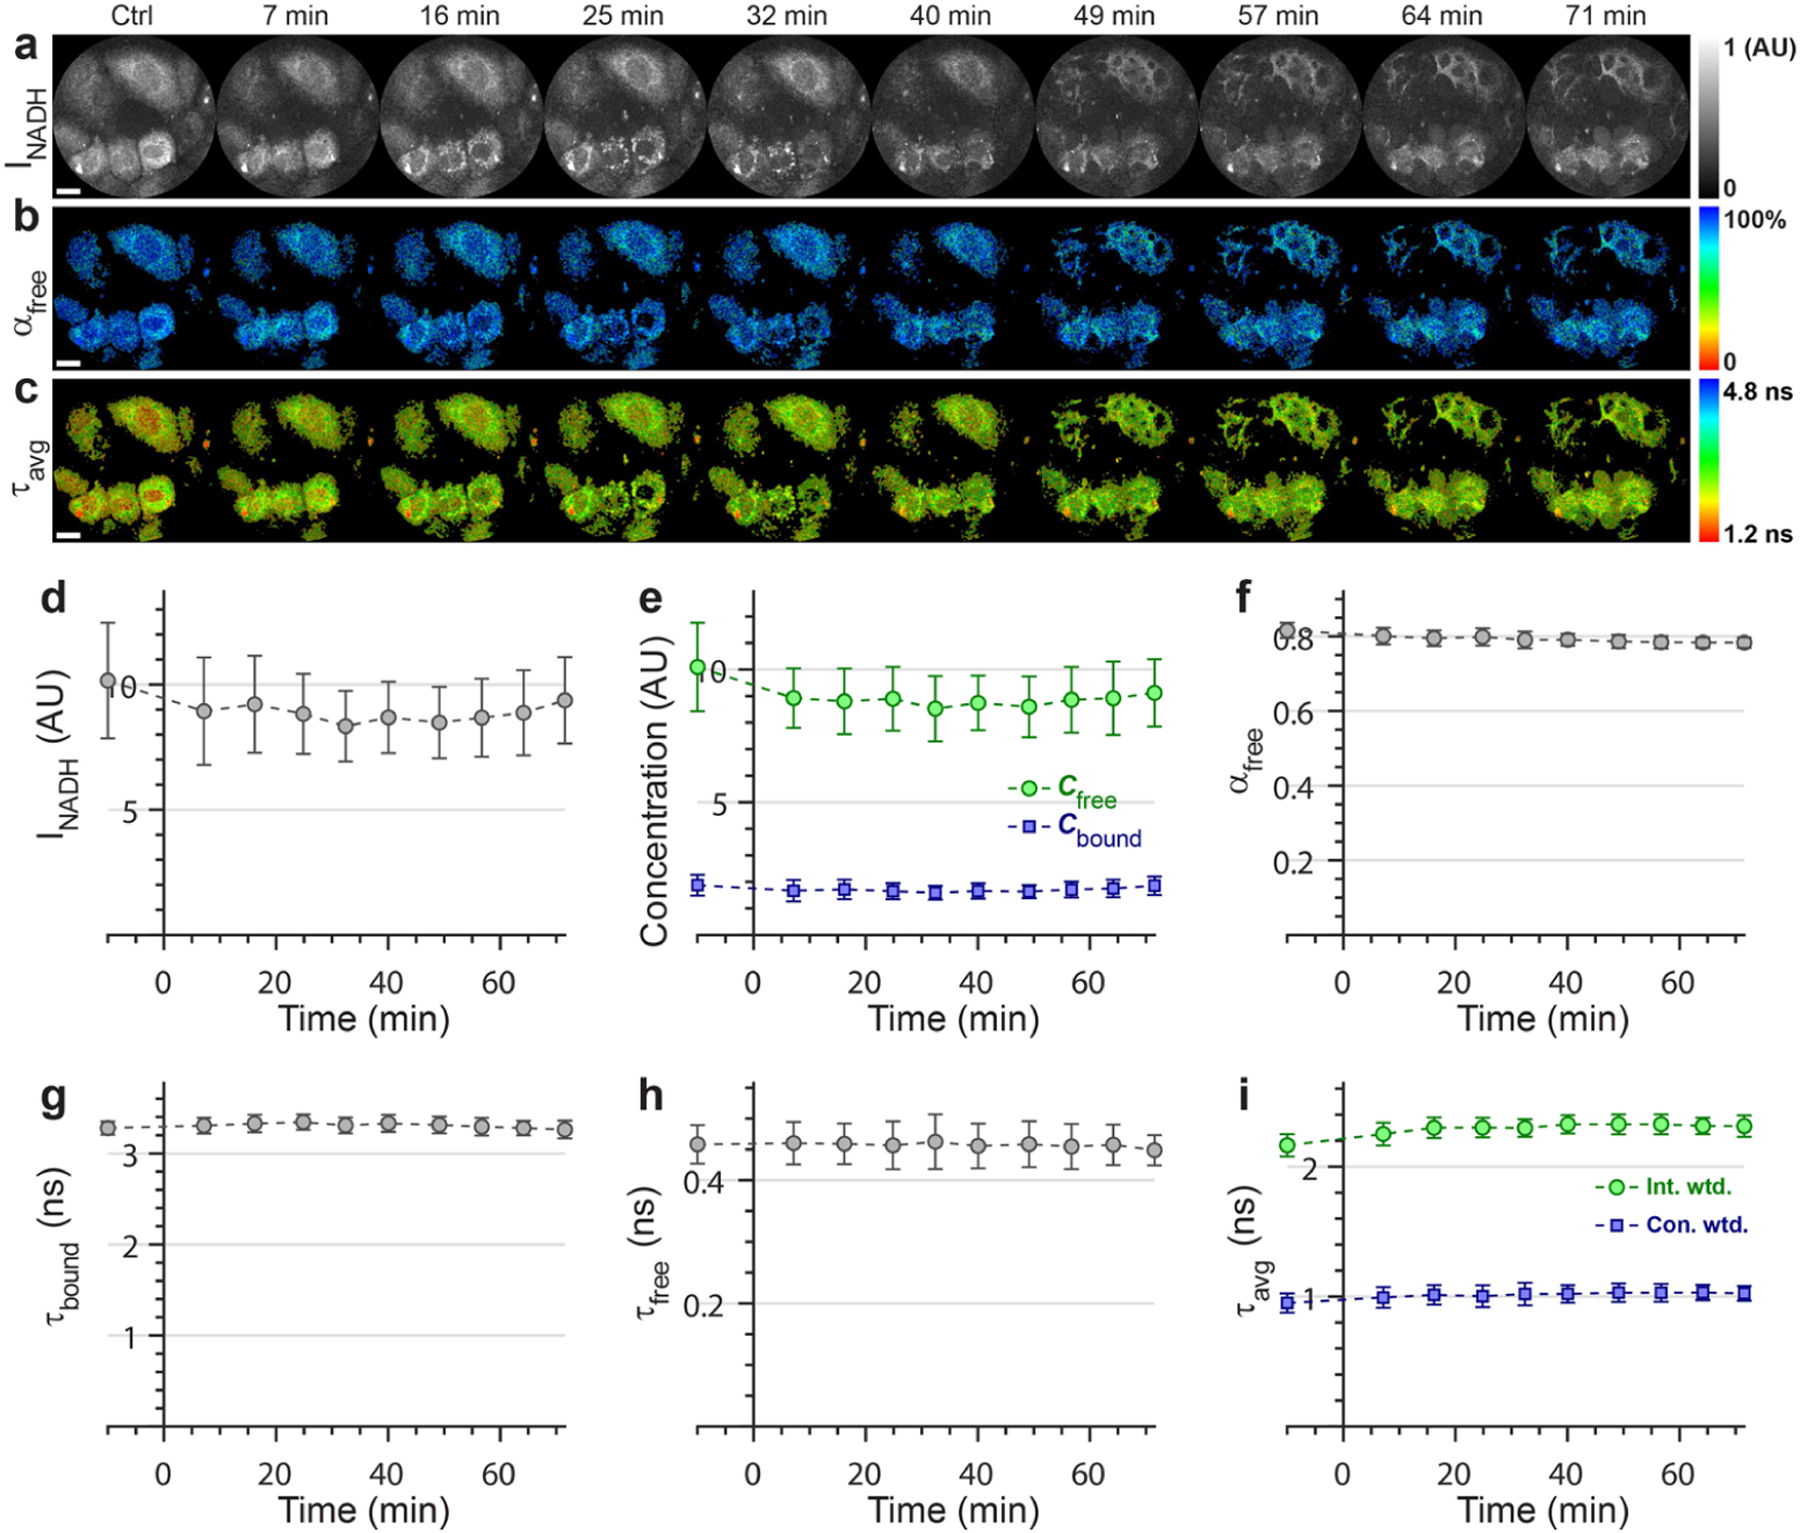
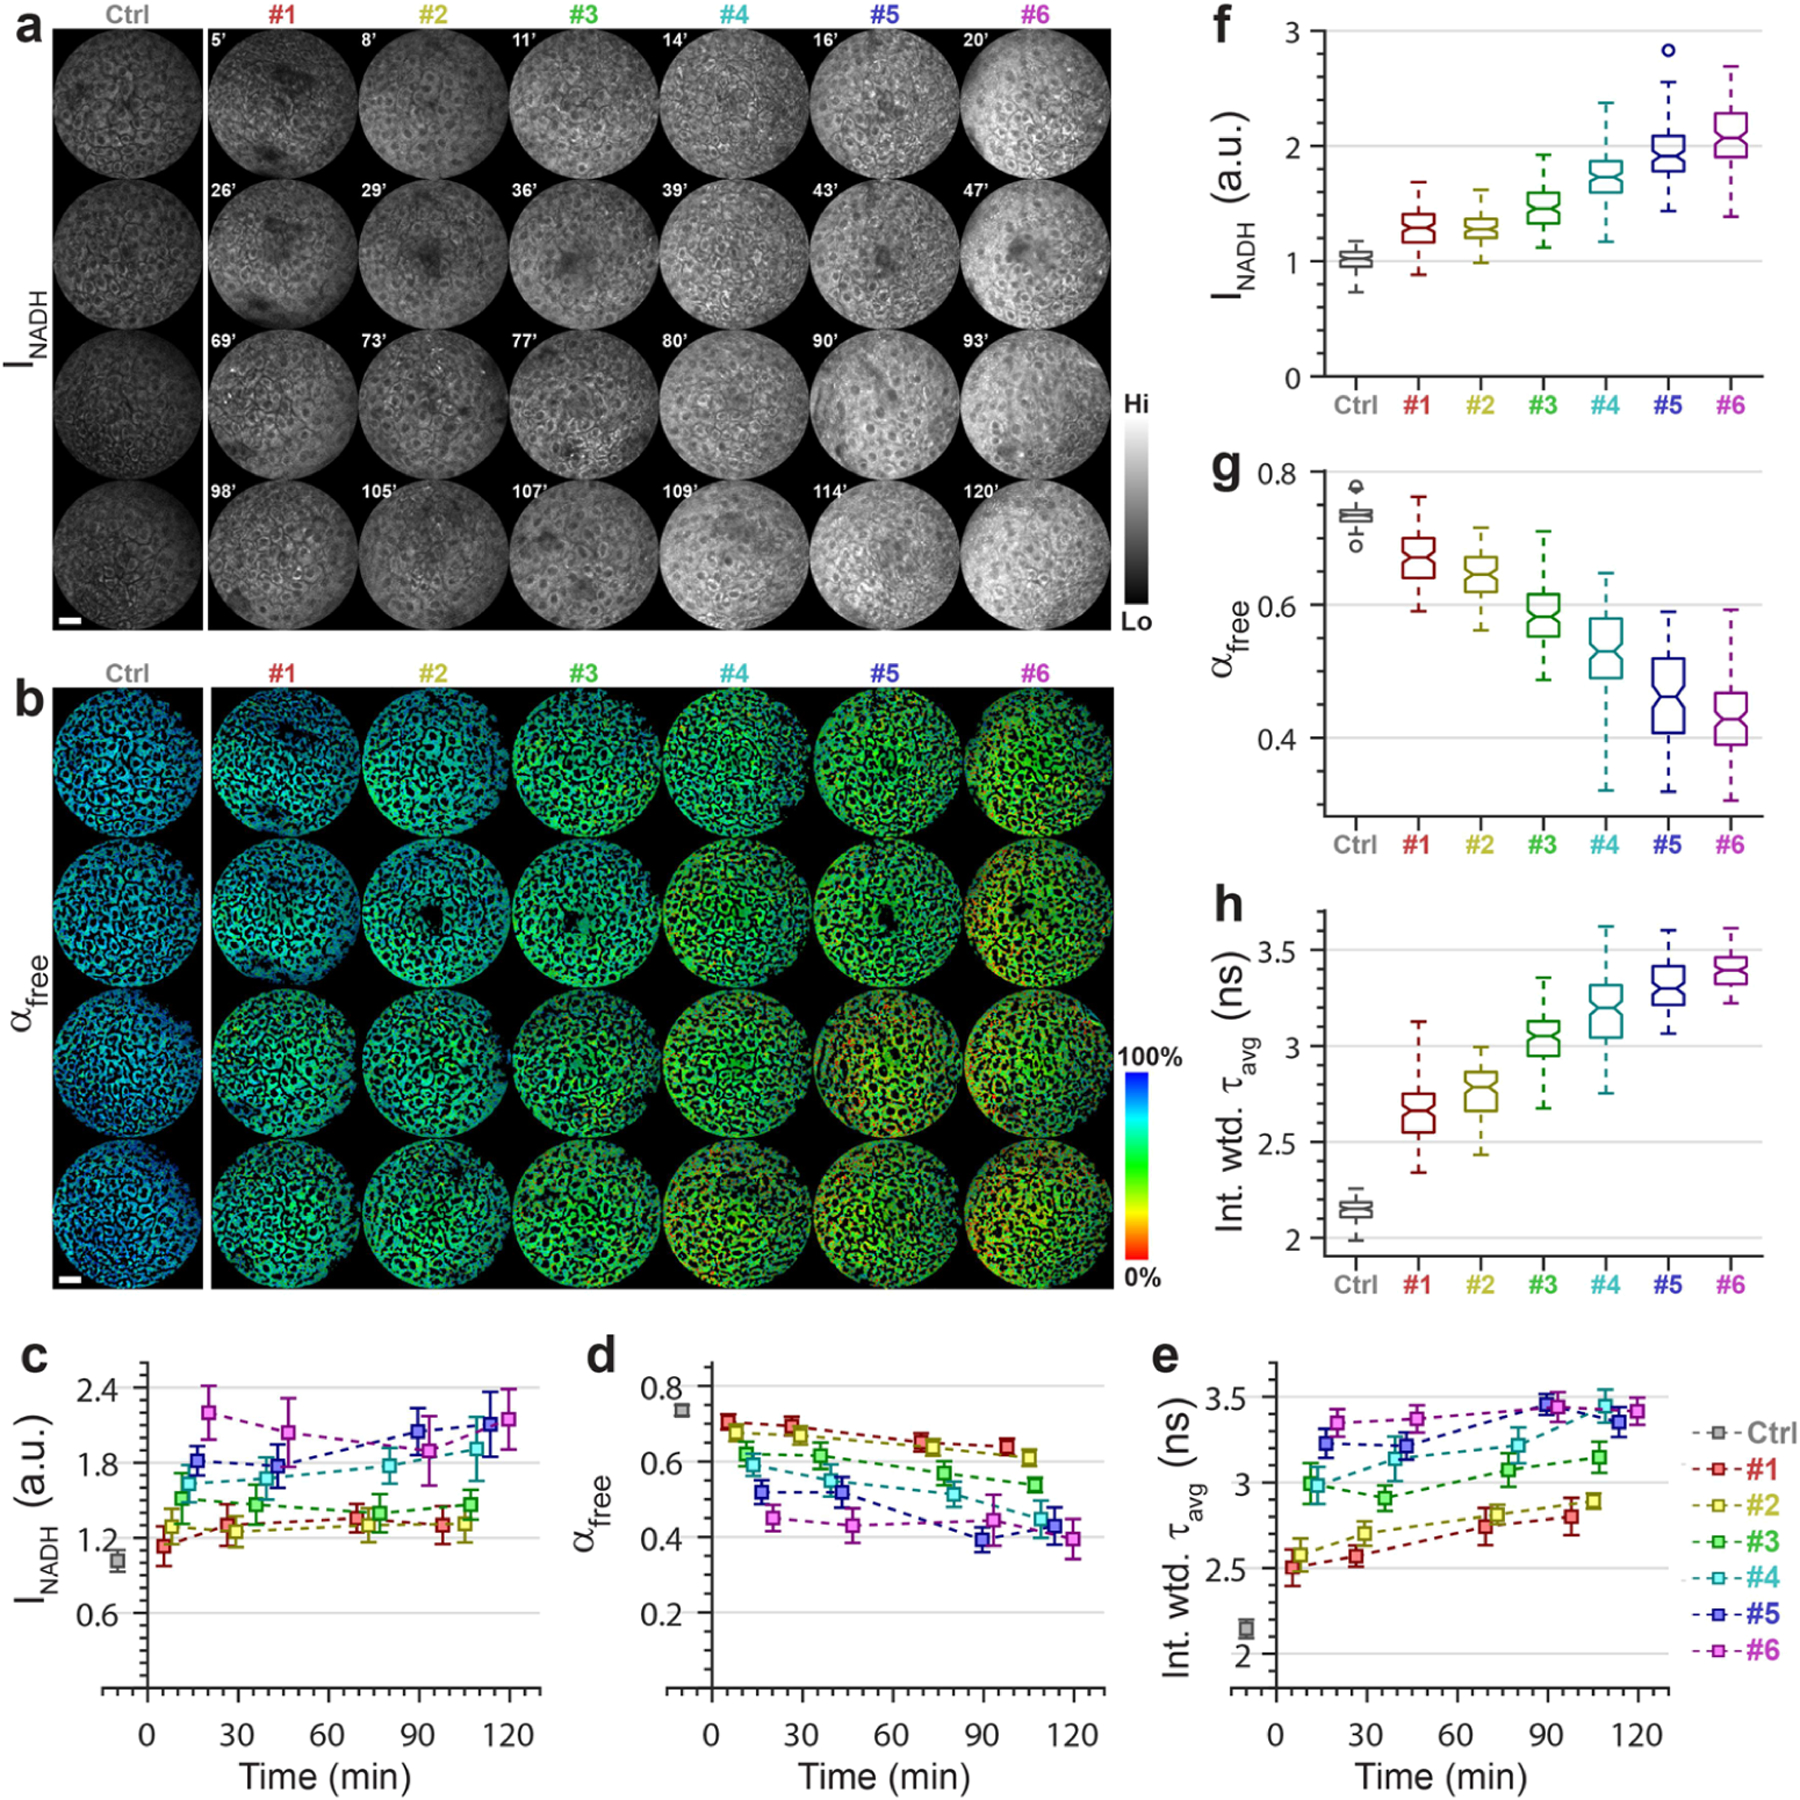
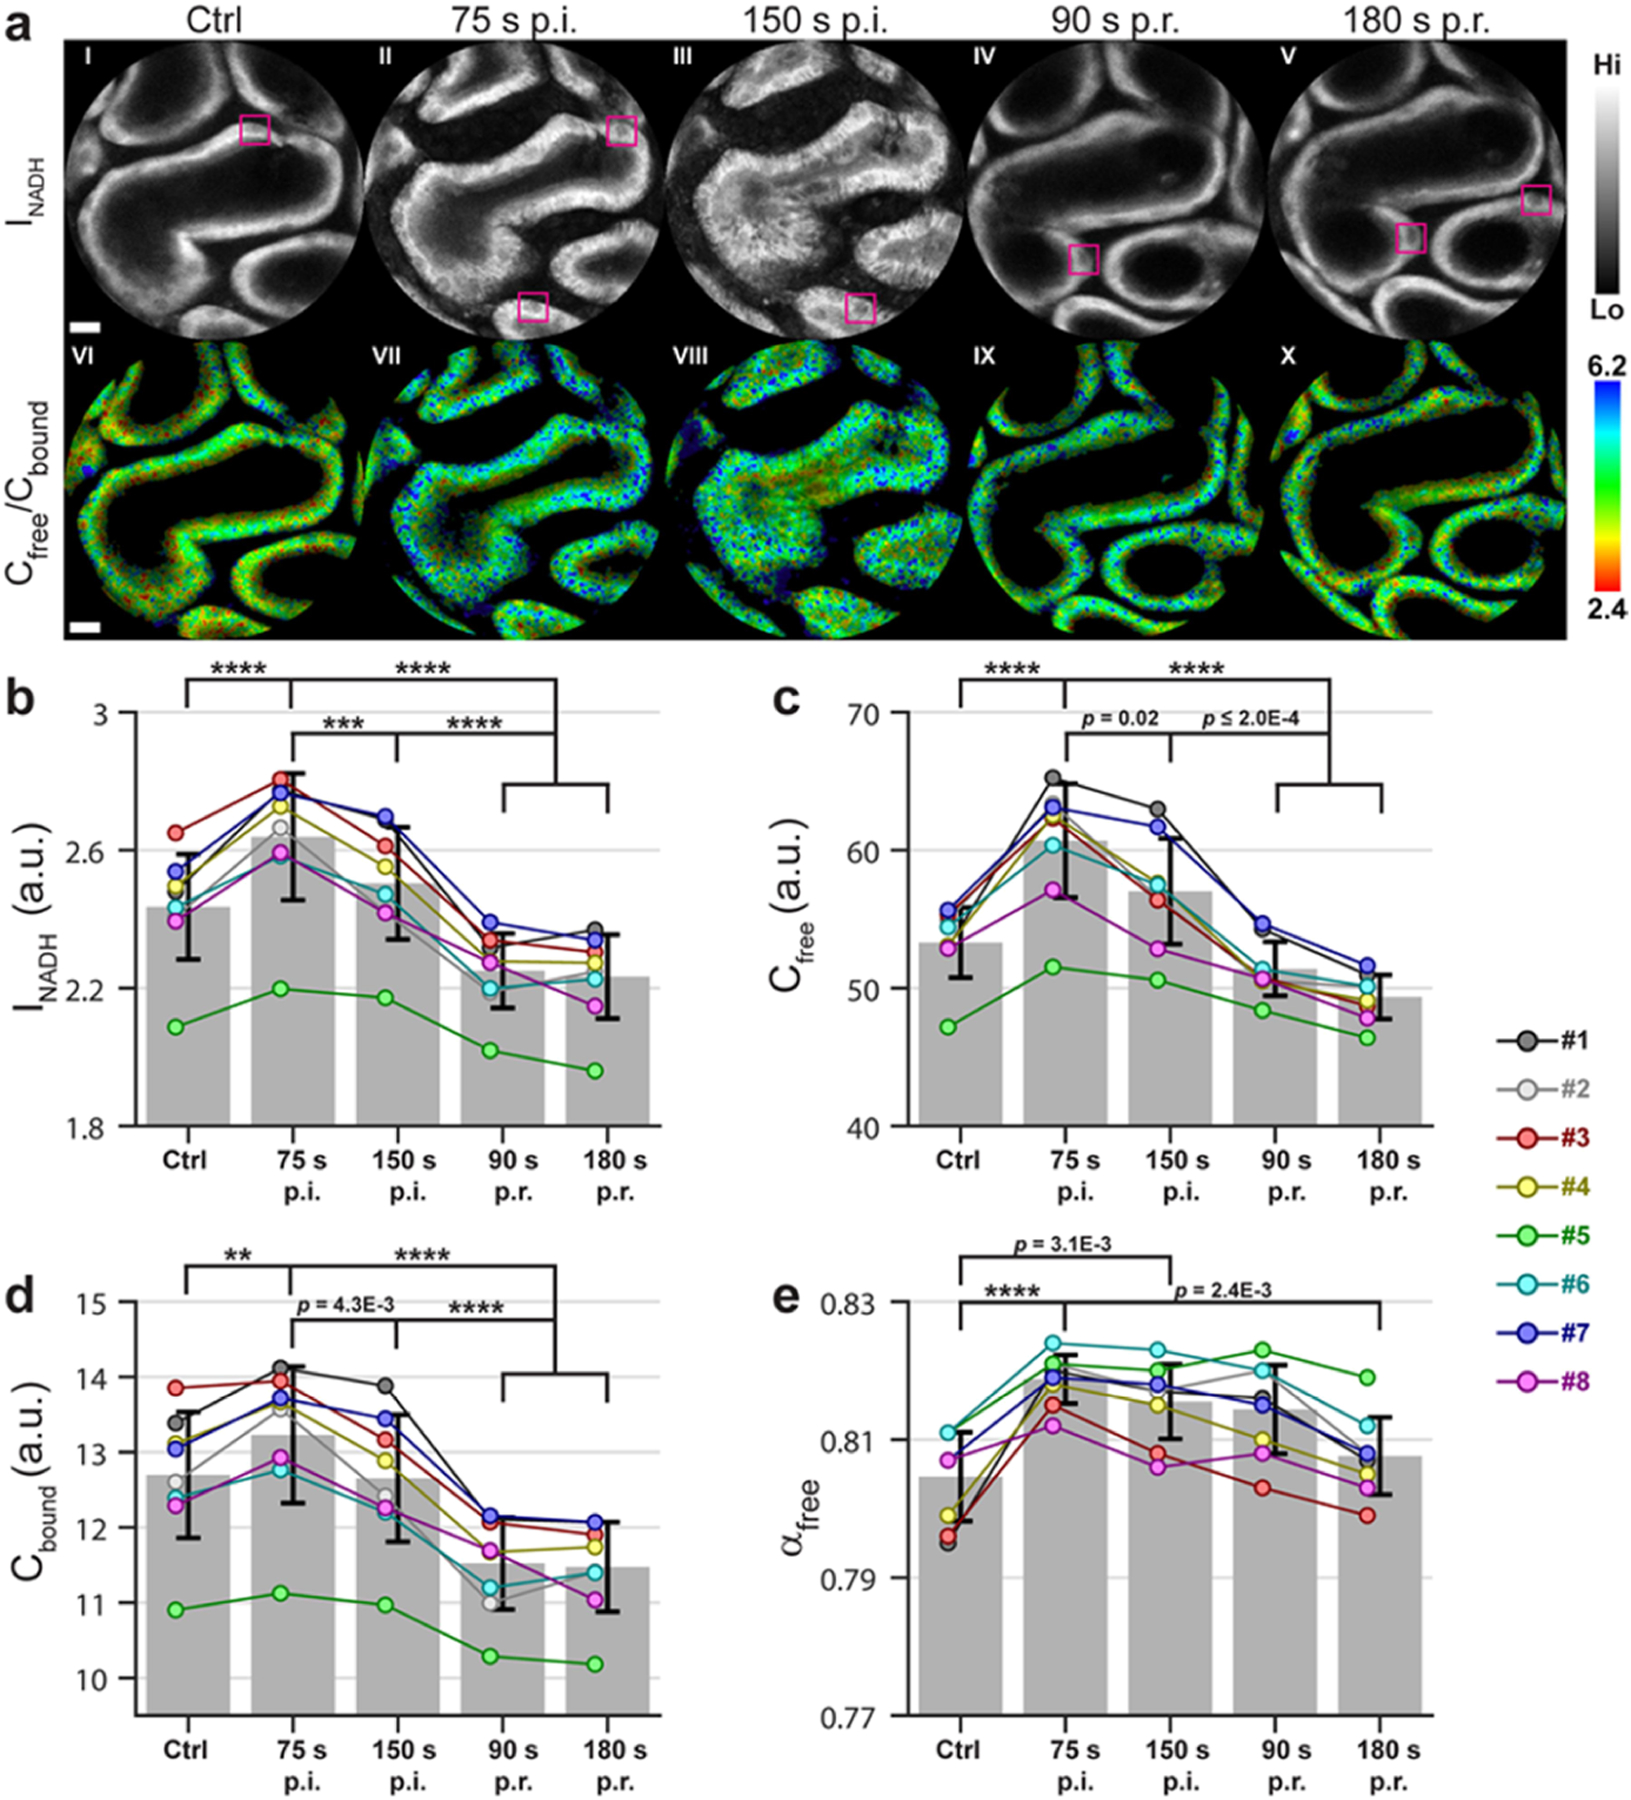
NADH intensity and fluorescence lifetime characteristics have proved valuable intrinsic biomarkers for profiling the cellular metabolic status of living biological tissues. To fully leverage the potential of NADH fluorescence lifetime imaging microscopy (FLIM) in (pre)clinical studies and translational applications, a compact and flexible endomicroscopic embodiment is essential. Herein we present our newly developed two-photon fluorescence (2PF) lifetime imaging endomicroscope (2p-FLeM) that features an about 2 mm diameter, subcellular resolution, and excellent emission photon utilization efficiency and can extract NADH lifetime parameters of living tissues and organs reliably using a safe excitation power (~30 mW) and moderate pixel dwelling time (≤10 μs). In vivo experiments showed that the 2p-FLeM system was capable of tracking NADH lifetime dynamics of cultured cancer cells and subcutaneous mouse tumor models subject to induced apoptosis, and of a functioning mouse kidney undergoing acute ischemia-reperfusion perturbation. The complementary structural and metabolic information afforded by the 2p-FLeM system promises functional histological imaging of label-free internal organs in vivo and in situ for practical clinical diagnosis and therapeutics applications.

Keywords: NADH lifetime imaging; fluorescence lifetime imaging microscopy (FLIM); label-free imaging; metabolic imaging; two-photon endomicroscopy.


Conflict of interest statement

The authors declare no competing financial interest.

Figures

Figure 1.
Figure 1.
2p-FLeM system schematic. See Methods for detailed description of the optical setup. A: high-speed transimpedance amplifier; CFD: constant fraction discriminator input of the TCSPC board; CLK: frame clock signal; DAQ: data acquisition board; DCF: double-clad fiber; DIC: dichroic mirror; M: retroreflector mirror; DWF: drive waveform to the piezoelectric tubular actuator; PM: pickup mirror; PM-SMF: polarization-maintaining single-mode fiber; PMT: photomultiplier tube; SYNC: synchronization input of the TCSPC board; TCSPC: time-correlated single-photon counting board; and Ti:S: Ti:sapphire ultrafast laser.
Figure 2.
Figure 2.
Metabolic dynamics of cultured A431 cancer cells under induced apoptosis captured by the 2p-FLeM system. (a–c) NADH intensity images on square root scale (a), and color-coded αfree- (b) and intensity-weighted τavg-images (c) are shown for a representative FOV at preinduction (control) and different post STS induction time points. Scale bar: 20 μm. (d–i) Average and standard deviation of cell-wide mean values of NADH fluorescence intensity (d), free and bound NADH concentrations (e), free NADH fraction (f), bound NADH lifetime (g), free NADH lifetime (h), and concentration- or intensity-weighted average NADH lifetime (i) are calculated across multiple cells (43 ≤ n ≤ 66 depending on time points) picked from all four FOVs combined and plotted against the postinduction time (with the preinduction data point set to–10 min nominally).
Figure 3.
Figure 3.
Metabolic dynamics of cultured A431 cancer cells under induced necrosis captured by the 2p-FLeM system. (a–c) Grayscale NADH intensity images (a), and color-coded αfree- (b) and intensity-weighted τavg-images (c) are shown for a representative FOV at preinduction (control) and different post-H2O2 induction time points. Scale bar: 20 μm. (d–i) Average and standard deviation of cell-wide mean NADH fluorescence intensity (d), free or bound NADH concentration (e), free NADH fraction (f), bound NADH lifetime (g), free NADH lifetime (h), and concentration- or intensity-weighted average NADH lifetime (i) are calculated across multiple cells (22 ≤ n ≤ 48 depending on time points) picked from all five FOVs combined and plotted against the postinduction time (with the preinduction data point plotted at −10 min nominally).
Figure 4.
Figure 4.
Metabolic dynamics of a subcutaneous tumor graft under STS treatment captured by the 2p-FLeM system. (a,b) Grayscale NADH intensity images (a), and color-coded αfree-images (b) for four example control FOVs and 24 post STS injection FOVs arranged so that (1) each column corresponds to one imaging location (from #1 the farthest to #6 the closest from the injection position) and (2) the postinjection time of acquisition (labeled at the top-left corner of each image) increases from the top to the bottom row. Scale bar: 20 μm. (c–e) Average and standard deviation of cell-wide mean values of INADH (c), αfree (d), and intensity-weighted τavg (e) calculated across multiple cells from all control images combined (ctrl) or from each postinjection image, color-coded according to the imaging location (#1-#6), and plotted against the postinjection time (with the control group set to −10 min nominally). (f–h) Distribution of cell-wide mean values of INADH (f), αfree (g), and intensity-weighted τavg (h) across multiple cells from all control images combined (for ctrl) or from all four images collected at each imaging location through the posttreatment time. For each box, the central mark indicates the median and the bottom and top edges of the box indicate the 25th and 75th percentiles, respectively. The whiskers, with length set to 2.0× the respective interquartile ranges, extend to the most extreme data points not considered outliers; and outliers are plotted individually using the “o” symbol.
Figure 5.
Figure 5.
Metabolic dynamics of a mouse kidney ischemia–reperfusion model. (a) Grayscale NADH intensity (top row) and color-coded free-to-bound (Cfree/Cbound) ratio images (bottom row) at different time points (p.i. stands for postischemia and p.r. for postreperfusion) from an example FOV. Scale bar: 10 μm. (b–e) Mean values of NADH intensity (b), free NADH (c) and bound NADH (d) concentration, and free NADH fraction (e) over all bright foreground pixels (with intensity signal above a global threshold; see Methods) are plotted in connected circles with each FOV represented by a distinct color (as listed to the right). Average and standard deviation of these FOV-wide mean values across all eight FOVs are represented by the gray bar chart and black error bars, respectively. Note that the y-axes of the free and bound NADH concentration plots (c and d) share a common, albeit arbitrary, reference unit. ** denotes p < 0.01, ***p < 0.001, and ****p < 0.0001 (ANOVA analysis followed by Tukey–Kramer multicomparison).

Similar articles

Cited by

References

    1. Nelson DL; Cox MM; Lehninger AL Lehninger principles of biochemistry; W.H. Freeman, 2013.
    1. Lakowicz JR; Szmacinski H; Nowaczyk K; Johnson ML Fluorescence lifetime imaging of free and protein-bound NADH. Proc. Natl. Acad. Sci. U. S. A 1992, 89, 1271–1275. - PMC - PubMed
    1. Vishwasrao HD; Heikal AA; Kasischke KA; Webb WW Conformational dependence of intracellular NADH on metabolic state revealed by associated fluorescence anisotropy. J. Biol. Chem 2005, 280, 25119–25126. - PubMed
    1. Blinova K; Carroll S; Bose S; Smirnov AV; Harvey JJ; Knutson JR; Balaban RS Distribution of mitochondrial NADH fluorescence lifetimes: steady-state kinetics of matrix NADH interactions. Biochemistry 2005, 44, 2585–2594. - PubMed
    1. Bird DK; Yan L; Vrotsos KM; Eliceiri KW; Vaughan EM; Keely PJ; White JG; Ramanujam N Metabolic mapping of MCF10A human breast cells via multiphoton fluorescence lifetime imaging of the coenzyme NADH. Cancer Res 2005, 65, 8766–8773. - PubMed

LinkOut - more resources