. 2024 Dec 12:18:1519558.
doi: 10.3389/fnbeh.2024.1519558. eCollection 2024.

Shifts in naturalistic behaviors induced by early social isolation stress are associated with adult binge-like eating in female rats

Affiliations

Shifts in naturalistic behaviors induced by early social isolation stress are associated with adult binge-like eating in female rats

Timothy B Simon et al. Front Behav Neurosci. .

Abstract

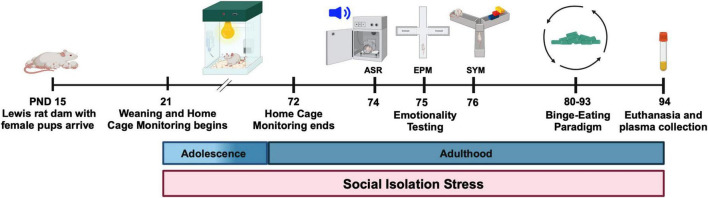
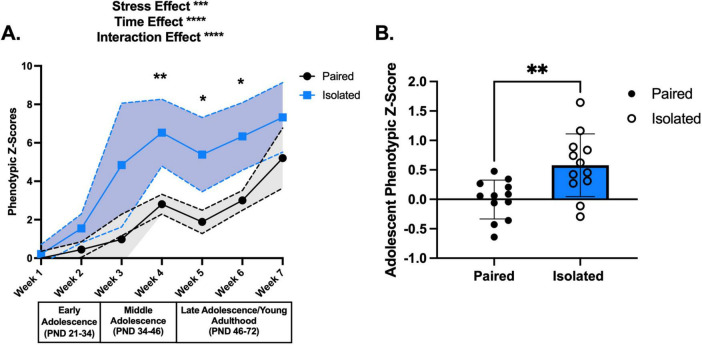
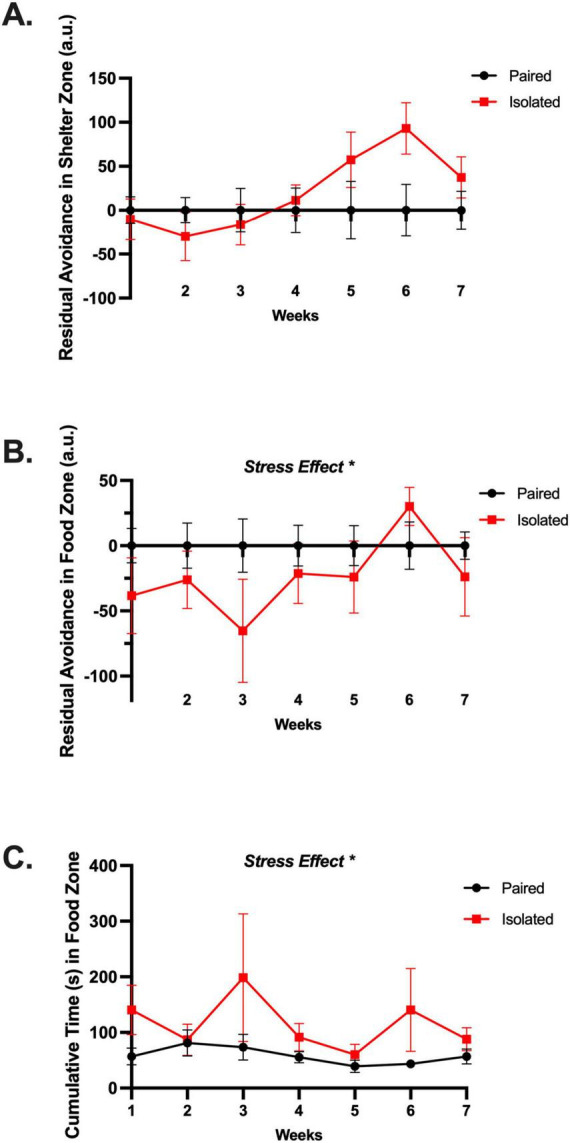
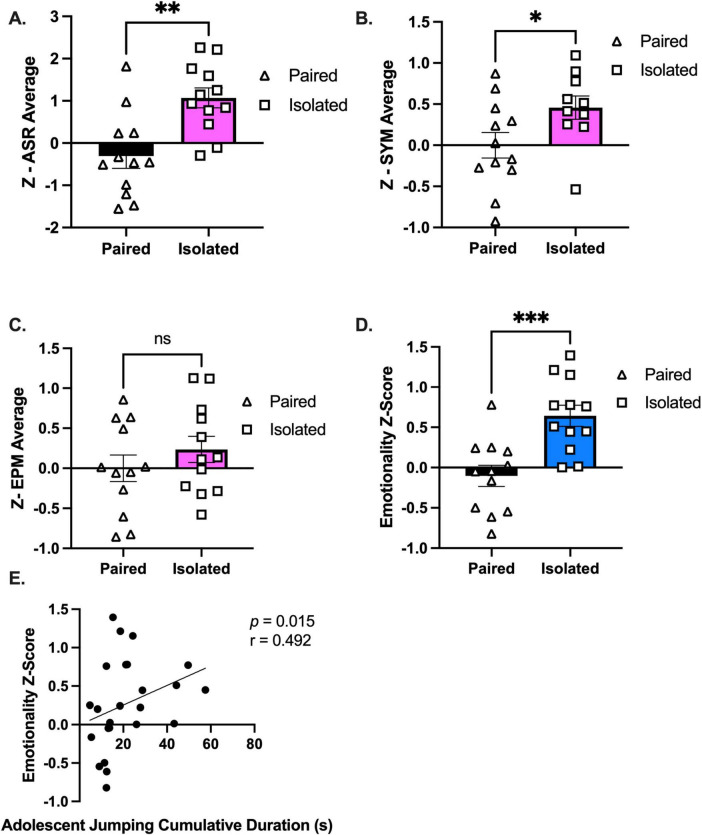
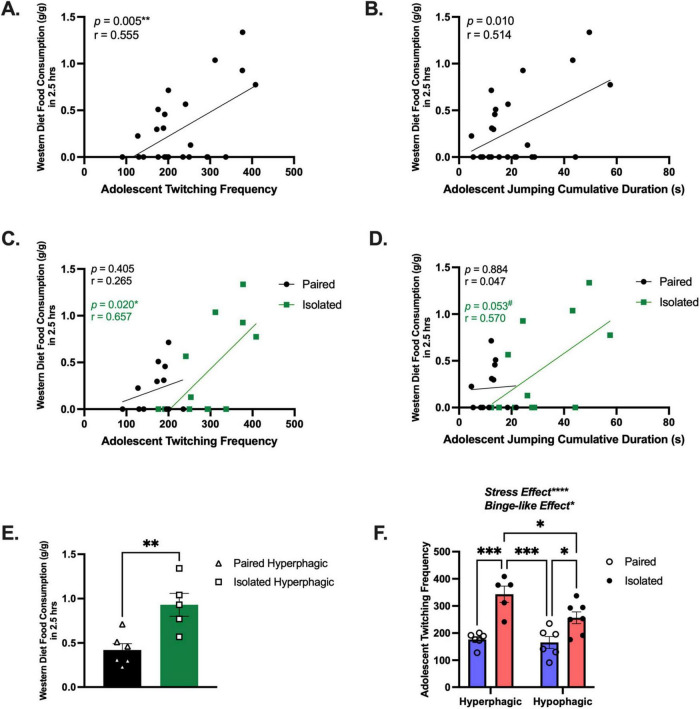
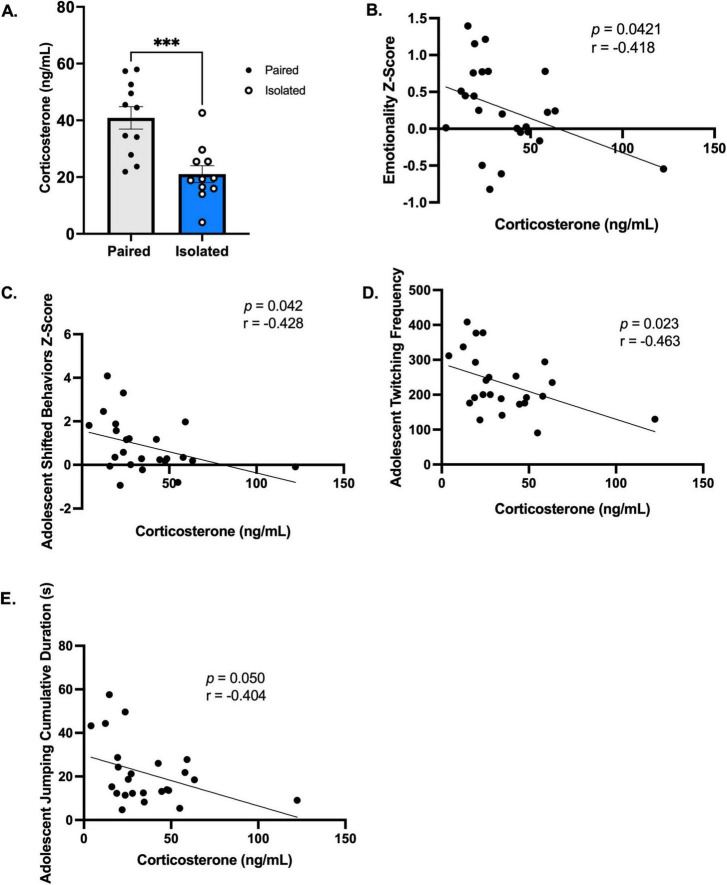
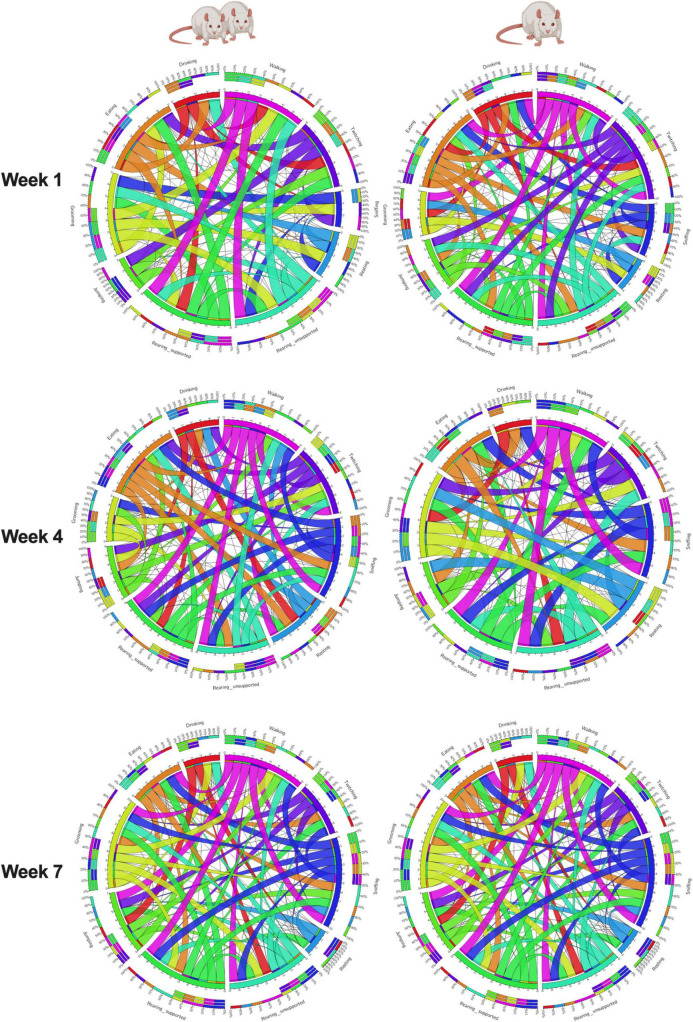
Binge eating (BE) is a highly pervasive maladaptive coping strategy in response to severe early life stress such as emotional and social neglect. BE is described as repeated episodes of uncontrolled eating and is tightly linked with comorbid mental health concerns. Despite social stressors occurring at a young age, the onset of BE typically does not occur until adulthood providing an interval for potential therapeutic intervention. Currently, our knowledge of longitudinal noninvasive digital biomarkers predictive of BE needs further development. Monitoring longitudinal impacts of adolescent social isolation stress on naturalistic behaviors in rats will enable the identification of noninvasive digital markers of disease progression to predict adult eating strategies. Recognizing adolescent naturalistic behaviors shaped by social stress informs our understanding of the underlying neurocircuits most effected. This study aimed to monitor and identify longitudinal behavioral shifts to enhance predictive capabilities in a rat model of social isolation stress-induced BE. We placed Paired (n = 12) and Socially Isolated (SI, n = 12) female rats in observational home cages weekly for seven weeks to evaluate the effect of SI on 10 naturalistic behaviors. All 10 naturalistic behaviors were simultaneously detected and tracked using Noldus Ethovision XT automated recognition software. Composite phenotypic z-scores were calculated by standardizing all 10 behaviors. When transitioning into adulthood, all rats underwent conventional emotionality testing and were exposed to a Western-like high fat diet (WD, 43% kcal from fat) to evaluate BE. Longitudinal assessments revealed SI-induced shifts in adolescent phenotypic z-scores and that sniffing, unsupported rearing, jumping, and twitching were the most susceptible to SI. SI increased emotionality compared to the Paired controls. Finally, we identified adolescent twitching as a digital biomarker of adult WD consumption. Our findings suggest that home cage monitoring can detect disrupted naturalistic behaviors associated with maladaptive coping.

Keywords: binge eating; early life adversity; female rodents; longitudinal; naturalistic behavior; observational cages; phenotyping; social isolation stress.


Conflict of interest statement

The authors declare that the research was conducted in the absence of any commercial or financial relationships that could be construed as a potential conflict of interest.

Figures

FIGURE 1
FIGURE 1
Experimental timeline. Female Lewis rat pups acclimated for 1 week prior to weaning at PND 21. All animals were placed in Paired or Isolation housing. They were immediately placed into home cages for continuous overnight and weekly monitoring. After 7 weeks, all animals underwent behavioral testing and subsequently engaged in our binge eating protocol.
FIGURE 2
FIGURE 2
Isolation housing induces greater shifts in phenotypic z scores throughout adolescence compared to Paired housing. (A) Shows the phenotypic z scores for each week for the Paired (black) and Isolated (blue) animals using Paired week 1 as the population baseline. Dashed lines and shaded areas reflect 95% confidence intervals. (B) Adolescent phenotypic z scores calculated from all the behaviors demonstrated statistically significant increase in the isolated compared to the Paired animals. Paired and Isolated, n = 12. Asterisks (*) signify statistically significant differences when comparing Paired and Isolated animals for that week. Data presented with SEM unless otherwise stated. *p < 0.05, **p < 0.01, ***p < 0.001, ****p < 0.0001; mixed effects ANOVA, Sidak Post hoc comparisons. See Supplementary Table 1 for detailed statistics.
FIGURE 3
FIGURE 3
Isolated animals endure as aversive spotlight area in favor of the food zone with no differences in shelter zone preference. (A) Isolated and Paired animals do not show any differential preferences for the shelter zone once the spotlight has been turned off. (B) Isolated animals endure the spotlight zone in favor of the food zone after when the spotlight is discontinued. (C) Isolated animals spend more time in the food zone when the spotlight is turned on. See residual avoidance formula in section “Materials and Methods.” Paired and isolated, n = 12. Data presented with SEM. Asterisks (*) signify statistically significant differences when comparing Paired and Isolated animals for that week. *p < 0.05; TWO-WAY ANOVA, Sidak Post-hoc comparisons.
FIGURE 4
FIGURE 4
Isolated animals display an increased emotionality composite z-score compared to Paired animals. (A–C) Average of standardized z-scores for ASR, EPM, and SYM, respectively. (D) Overall emotionality z score. (E) Emotionality z score is correlated with adolescent jumping behaviors when analyzed with all the animals. Paired and Isolated, n = 12. Data presented with SEM. *p < 0.05, **p < 0.01, ***p < 0.001; Student t- and Mann-Whitney tests were used for parametric and nonparametric data, respectively. Spearman Correlations were used for emotionality z score correlation analyses. p and r-values are presented.
FIGURE 5
FIGURE 5
Isolation exacerbates binging and is predicted by twitching behavior. (A) Correlation using all animals between adolescent twitching frequency and the 2.5 h WD consumption measurement (n = 24). (B) Correlation between adolescent jumping cumulative duration and the 2.5 h WD consumption measurement (n = 24). (C) Correlation between adolescent twitching frequency and the 2.5 h WD consumption measurement for Isolated (n = 12) and Paired (n = 12). (D) Correlation between Adolescent jumping cumulative duration and the 2.5 h WD consumption measurement for Isolated (n = 12) and Paired (n = 12). (E) These data demonstrate subpopulations of animals more likely to consume the WD. (F) Adolescent twitching frequency can distinguish high and low eaters (n = 5–6) for each group and Paired and Isolated animals (n = 12) for each group. Data presented with SEM. # is approaching significance, *p < 0.05, **p < 0.01, ***p < 0.001, ****p < 0.0001; Student t- and Mann-Whitney tests were used for parametric and nonparametric data, respectively. Pearson correlations were used when comparing naturalistic behaviors with food consumption. p and r-values are presented. TWO-WAY ANOVA, Sidak Post-hoc comparisons. We called the statistically significant increase between high and low eaters a Binge-like Effect.
FIGURE 6
FIGURE 6
Corticosterone is blunted in Isolated animals and is correlated behavior and emotionality. (A) Isolation housing blunts corticosterone levels (n = 11, Paired and Isolated). (B–E) Corticosterone levels are correlated with emotionality z scores, adolescent shifted behaviors, twitching frequency, and jumping cumulative duration. Data presented with SEM. *p < 0.05, **p < 0.01, ***p < 0.001, ****p < 0.0001; Student t- and Mann-Whitney tests were used for parametric and nonparametric data, respectively. Pearson Correlations were used when comparing naturalistic behaviors and Spearman for Emotionality z scores. p and r-values are presented.
FIGURE 7
FIGURE 7
Organism-level ethological associations. This study evaluated a naturalistic behaviorome of Paired and Isolated animals and then connected these behaviors with emotionality, coping, and hormone levels. The connectogram 1 illustrates the feasibility of associating organism-level behaviors monitored through time, and 2 social isolation stress changes the way behaviors correlate without one another. A thinker ribbon designates a stronger association.

Similar articles

References

    1. Agorastos A., Pervanidou P., Chrousos G. P., Baker D. G. (2019). Developmental trajectories of early life stress and trauma: A narrative review on neurobiological aspects beyond stress system dysregulation. Front. Psychiatry 10:118. 10.3389/fpsyt.2019.00118 - DOI - PMC - PubMed
    1. Ajayi A. F., Akhigbe R. E. (2020). Staging of the estrous cycle and induction of estrus in experimental rodents: An update. Fertil. Res. Pract. 6:5. 10.1186/s40738-020-00074-3 - DOI - PMC - PubMed
    1. Algamal M., Ojo J. O., Lungmus C. P., Muza P., Cammarata C., Owens M. J., et al. (2018). Chronic hippocampal abnormalities and blunted HPA axis in an animal model of repeated unpredictable stress. Front. Behav. Neurosci. 12:150. 10.3389/fnbeh.2018.00150 - DOI - PMC - PubMed
    1. American Psychiatric Association (2013). Diagnostic and statistical manual of mental disorders: DSM-5, 5th Edn. Washington, DC: American Psychiatric Association.
    1. Anversa R. G., Campbell E. J., Ch’ng S. S., Gogos A., Lawrence A. J., Brown R. M. (2020). A model of emotional stress-induced binge eating in female mice with no history of food restriction. Genes Brain Behav. 19:e12613. 10.1111/gbb.12613 - DOI - PubMed

LinkOut - more resources