. 2024;12(1):1184.
doi: 10.47739/pharmacology1184. Epub 2024 Sep 20.

A Pharmacokinetic/Toxicodynamic Model of Cisplatin Nephrotoxicity Using the Kidney Injury Molecule-1 Biomarker

Affiliations

A Pharmacokinetic/Toxicodynamic Model of Cisplatin Nephrotoxicity Using the Kidney Injury Molecule-1 Biomarker

Lauren E Thompson et al. J Pharmacol Clin Toxicol. 2024.

Abstract

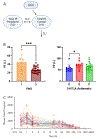
Cisplatin is a platinum-based chemotherapeutic that causes acute kidney injury in over 30% of patients. The aim of this study was to develop a population pharmacokinetic/toxicodynamic (PKTD) model of cisplatin-induced kidney injury that incorporated plasma total platinum and urinary kidney injury molecule-1 (KIM-1) concentrations. Cancer patients receiving their first or second round of cisplatin-containing chemotherapy (n=39) were prospectively randomized to a 5-HT3 antagonist (5-HT3A) antiemetic (ondansetron, granisetron, or palonosetron) and had blood and urine collected over 10 days. Plasma concentrations of total platinum and urinary concentrations of KIM-1 were used in the development of a nonlinear mixed effect population PKTD model using Phoenix® NLME (v8.3, Certara Inc.). A stepwise search was used to test potential covariates that influenced PKTD parameters. A two-compartment model best described the plasma total platinum concentration vs. time data and was expanded to an effect compartment PKTD model incorporating urinary KIM-1 concentrations. Significant covariate effects for the PKTD model included previous cisplatin exposure on the volume of the central compartment (V1), 5-HT3A antiemetic treatment on the volume of the peripheral compartment (V2), and baseline urinary KIM-1 levels on the maximum effect (Emax) parameter. The model demonstrated that ondansetron-treated subjects had a 163% increase in exposure to plasma total platinum, a 94% increase in urinary KIM-1 maximum concentrations, and a 235% increase in total urinary KIM-1 excretion compared to palonosetron-treated subjects, suggesting that palonosetron may be a preferred 5-HT3A to reduce the risk of cisplatin-induced kidney injury.

Keywords: 5-HT3 Antagonist; Cisplatin; Kidney Injury; Nephrotoxicity; Pharmacodynamics; Pharmacokinetics; Toxicodynamics.


Conflict of interest statement

CONFLICT OF INTEREST The authors declare no conflicts of interest. Lauren M. Aleksunes is a member of the scientific advisory board of RenaSym® Simulations Plus.

Figures

Figure 1
Figure 1
Total platinum (Pt) and urinary kidney injury molecule-1 (KIM-1) concentrations following cisplatin infusions. (A) – Plasma total platinum concentrations. (B) – Urinary KIM-1 concentrations normalized by urinary creatinine (UCr). (C) – Cumulative urinary KIM-1/UCr amount. (D) – Plasma total platinum compared to urinary KIM-1/UCr concentrations. Each line represents an individual patient profile. For (A-C), ondansetron-randomized patients are represented in blue, granisetron-randomized patients are represented in red, and palonosetron-randomized patients are represented in green. For (D), plasma total platinum concentrations are color coded by 5-HT3A (ondansetron: blue; granisetron: red; palonosetron: green) and urinary KIM-1/UCr concentrations are represented in black.
Figure 2
Figure 2
Population PK model of total platinum. (A) – Base population PK model diagram of plasma total platinum. (B) – Covariate plots for the plasma total platinum model. V1 was significantly influenced by which visit the patient was studied during – first cisplatin dose (1) or second cisplatin dose (2) (p=0.0003). Which 5-HT3A antiemetic the patient was taking significantly altered V2 (O vs. G: p=0.045; O vs. P: p=0.311; G vs. P: p>0.999). Data represented as mean ± SD; *p<0.05, ***p<0.001. (C) – Individual predicted total platinum levels (lines) compared to observed data (red circles) as estimated by the final covariate model. PK: pharmacokinetic; Pt: platinum; V1: volume of central compartment; V2: volume of peripheral compartment; CL1: central clearance; CL2: intercompartmental clearance; SD: standard deviation. Figure 2A was made using BioRender.com.
Figure 3
Figure 3
Total platinum PK parameters are correlated with urinary KIM-1 TD parameters. (A) – Plasma total platinum Cmax levels were significantly correlated with urinary KIM-1/UCr Emax levels (p=0.010, R2=0.178). (B) – Plasma total platinum AUCc values were significantly correlated with urinary KIM-1/UCr AUCe values (p<0.0001, R2=0.688). Ondansetron-randomized patients are represented in blue, granisetron-randomized patients are represented in red, and palonosetron-randomized patients are represented in green. PK: pharmacokinetic; TD: toxicodynamic; Pt: platinum; Cmax: maximum concentration; Emax: maximum effect; KIM-1: kidney injury molecule-1; UCr: urinary creatinine; AUCc: area under the concentration versus time curve; AUCe: area under the concentration versus effect curve.
Figure 4
Figure 4
Population PKTD model of cisplatin-induced kidney injury. (A) – Effect compartment population PKTD model diagram of cisplatin-induced kidney injury. (B) – Covariate plot for the PKTD model. Emax was significantly influenced by baseline urinary KIM-1/UCr concentrations. Emax estimates from the base PKTD model (p<0.0001, R2=0.415). (C) – Individual predicted urinary KIM-1/UCr levels (lines) compared to observed data (red circles) as estimated by the final covariate model. PKTD: pharmacokinetic/toxicodynamic; Pt: platinum; Cmpt: compartment; V1: volume of central compartment of total Pt; V2: volume of peripheral compartment of total Pt; CL1: central clearance of total Pt; CL2: intercompartmental clearance of total Pt; Ke0: effect-site equilibrium rate constant; Emax: maximum effect; Ce: effect compartment concentration; EC50: half maximum effective concentration; KIM-1: kidney injury molecule-1; UCr: urinary creatinine. Figure 4A was made using BioRender.com.
Figure 5
Figure 5
Simulated plasma total platinum (Pt) concentrations over time based on the final plasma total platinum covariate model. (A) – A single 50 mg cisplatin dose stratified based on 1st or 2nd cisplatin dose and 5-HT3A antiemetic prescription. (B) – 50 mg cisplatin dosed once per week for six weeks stratified based on 5-HT3A antiemetic prescription. (C) – 50 mg cisplatin dosed once per day for five days stratified based on 5-HT3A antiemetic prescription. Each simulation included 1000 simulated data points.
Figure 6
Figure 6
Simulated urinary KIM-1/UCr concentrations over time based on the final PKTD covariate model. (A) – A single 50 mg cisplatin dose stratified based on baseline urinary KIM-1/UCr (mean ± SD: 0.49 ± 0.51 ng/mg; low: <0.5 ng/mg, average: 0.5–1 ng/mg, high: >1 ng/mg). (B) – 50 mg cisplatin dosed once per week for six weeks stratified based on baseline urinary KIM-1/UCr. (C) – 50 mg cisplatin dosed once per day for five days stratified based on baseline urinary KIM-1/UCr. Each simulation included 1000 simulated data points. PKTD: pharmacokinetic/toxicodynamic; KIM-1: kidney injury molecule-1; UCr: urinary creatinine; SD: standard deviation.
Figure 7
Figure 7
Total platinum PK and urinary KIM-1 TD parameters by 5-HT3A antiemetic. (A) – AUCc for plasma total platinum. (B) –AUCc_d for plasma total platinum. (C) – Emax of urinary KIM-1 normalized by UCr. (D) – AUCe for urinary KIM-1/UCr. (E) – AUCe_d for urinary KIM-1/UCr. Data represented as mean ± SD; *p<0.05. O: ondansetron; G: granisetron; P: palonosetron; PK: pharmacokinetic; TD: toxicodynamic; Pt: platinum; KIM-1: kidney injury molecule-1; AUCc: area under the concentration versus time curve; AUCc_d: AUCc normalized to a 100 mg cisplatin dose; Emax: maximum effect; UCr: urinary creatinine; AUCe: area under the concentration versus effect curve; AUCe_d: AUCe normalized to a 100 mg cisplatin dose; SD: standard deviation.
Figure 8
Figure 8
Proposed mechanism of altered cisplatin toxicity by 5-HT3As. Proposed mechanism for cisplatin toxicity by 5-HT3As due to preferential inhibition of MATE1 by ondansetron and subsequent reduced secretion of the highly electrophilic parent and aquated cisplatin species. GSH: glutathione; MATE1: multidrug and toxin extrusion protein 1; MRP2: multidrug resistance-associated protein 2; OCT2: organic cation transporter 2. Figure was made using BioRender.com.

Similar articles

Cited by

References

    1. Dasari S, Tchounwou PB. Cisplatin in cancer therapy: molecular mechanisms of action. Eur J Pharmacol. 2014; 740: 364–378. - PMC - PubMed
    1. Akcay A, Turkmen K, Lee D, Edelstein CL. Update on the diagnosis and management of acute kidney injury. Int J Nephrol Renovasc Dis. 2010; 3: 129–140. - PMC - PubMed
    1. George B, Joy MS, Aleksunes LM. Urinary protein biomarkers of kidney injury in patients receiving cisplatin chemotherapy. Exp Biol Med (Maywood). 2018; 243: 272–282. - PMC - PubMed
    1. Einhorn LH. Curing metastatic testicular cancer. Proc Natl Acad Sci U S A. 2002; 99: 4592–4595. - PMC - PubMed
    1. Ozkok A, Edelstein CL. Pathophysiology of cisplatin-induced acute kidney injury. Biomed Res Int. 2014; 2014: 967826. - PMC - PubMed

LinkOut - more resources