

Association between anthropometric indices and hypertension: identifying optimal cutoff points for U.S. adults across different populations
- PMID: 39726779
- PMCID: PMC11669579
- DOI: 10.3389/fphar.2024.1503059
Association between anthropometric indices and hypertension: identifying optimal cutoff points for U.S. adults across different populations
Abstract
Objective: This study compares the relationships between five anthropometric indices, a body shape index (ABSI), body roundness index (BRI), waist circumference (WC), body mass index (BMI) and waist-to-height ratio (WHtR), and hypertension, assessing their predictive capacities. The aim is to determine the specific numerical changes in hypertension incidence, systolic blood pressure (SBP) and diastolic blood pressure (DBP) for each increase in standard deviation of these indices, and to identify the optimal predictive indicators for different populations, including the calculation of cutoff values.
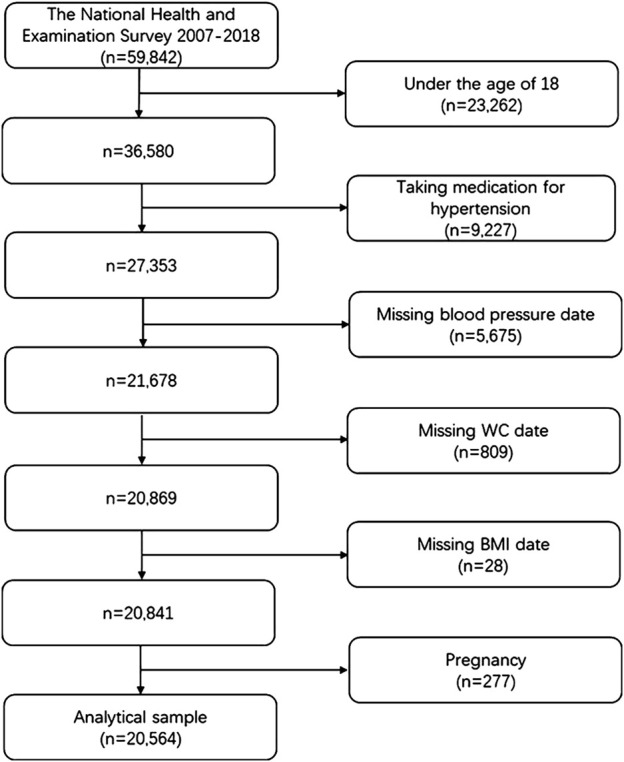
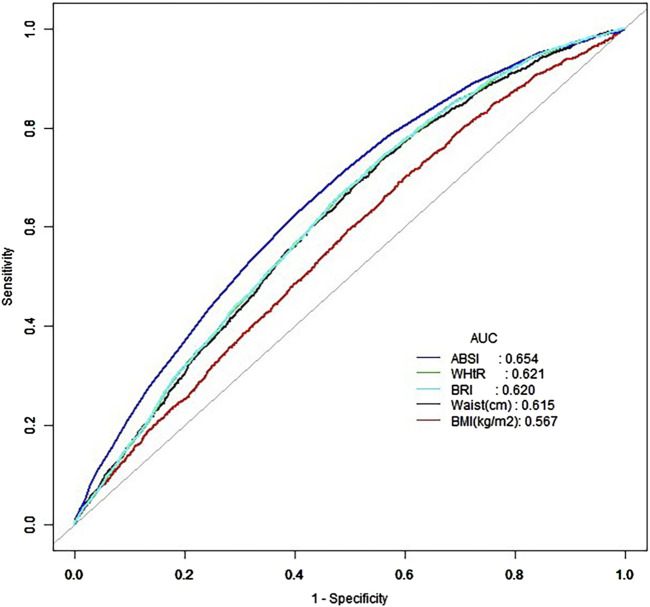
Methods: This study used data from the NHANES datasets spanning 2007 to 2018. Logistic regression analysis was used to quantify the associations between these anthropometric indices and hypertension, calculating β coefficients and odds ratios (ORs). Receiver operating characteristic (ROC) analysis was used to evaluate the predictive ability of each index for hypertension.
Results: For each increase in standard deviation in WC, BMI, WHtR, ABSI and BRI, the prevalence of hypertension increased by 33% (95% CI: 27%-40%), 32% (95% CI: 26%-38%), 35% (95% CI: 28%-42%), 9% (95% CI: 4%-16%) and 32% (95% CI: 26%-38%), respectively. The SBP correspondingly increased by 2.36 mmHg (95% CI: 2.16-2.56), 2.41 mmHg (95% CI: 2.21-2.60), 2.48 mmHg (95% CI: 2.28-2.68), 0.42 mmHg (95% CI: 0.19-0.66) and 2.46 mmHg (95% CI: 2.26-2.66), respectively. Similarly, DBP increased by 1.83 mmHg (95% CI: 1.68-1.98), 1.72 mmHg (95% CI: 1.58-1.87), 1.72 mmHg (95% CI: 1.57-1.88), 0.44 mmHg (95% CI: 0.27-0.62) and 1.64 mmHg (95% CI: 1.48-1.79). In the youth and middle-aged groups, WC had the best predictive ability, with AUCs of 0.749 and 0.603, respectively. Among the elderly group, the AUCs for all five indices ranged between 0.5 and 0.52.
Conclusion: Increases in WC, BMI, WHtR and BRI are significantly associated with higher incidences of hypertension and increases in SBP and DBP, while the impact of ABSI on blood pressure is relatively weak. Stratified analysis indicates significant age-related differences in the predictive value of these indices, with the strongest associations observed in the youth group, followed by the middle age group, and the weakest in the elderly. WC demonstrates excellent predictive ability across youth populations.
Keywords: anthropometric indices; cutoff points; hypertension; hypertension prediction; stratified analysis.
Copyright © 2024 Zhang, Nie, Li and Zhou.
Conflict of interest statement
The authors declare that the research was conducted in the absence of any commercial or financial relationships that could be construed as a potential conflict of interest.
Figures


Similar articles
-
Comparisons of Various Anthropometric Indices for Incident Hypertension in Military Young Adults: The CHIEF Cohort Study.Endocr Metab Immune Disord Drug Targets. 2025;25(5):411-420. doi: 10.2174/0118715303303679240611120022. Endocr Metab Immune Disord Drug Targets. 2025. PMID: 39075958
-
[Different anthropometric indices and incident risk of hypertension in elderly population: a prospective cohort study].Zhonghua Yu Fang Yi Xue Za Zhi. 2019 Mar 6;53(3):272-278. doi: 10.3760/cma.j.issn.0253-9624.2019.03.007. Zhonghua Yu Fang Yi Xue Za Zhi. 2019. PMID: 30841666 Chinese.
-
Feasibility of body roundness index for identifying a clustering of cardiometabolic abnormalities compared to BMI, waist circumference and other anthropometric indices: the China Health and Nutrition Survey, 2008 to 2009.Medicine (Baltimore). 2016 Aug;95(34):e4642. doi: 10.1097/MD.0000000000004642. Medicine (Baltimore). 2016. PMID: 27559964 Free PMC article.
-
Obesity- and lipid-related indices as a predictor of obesity metabolic syndrome in a national cohort study.Front Public Health. 2023 Feb 14;11:1073824. doi: 10.3389/fpubh.2023.1073824. eCollection 2023. Front Public Health. 2023. PMID: 36875382 Free PMC article.
-
Effectiveness of body roundness index in predicting metabolic syndrome: A systematic review and meta-analysis.Obes Rev. 2020 Jul;21(7):e13023. doi: 10.1111/obr.13023. Epub 2020 Apr 8. Obes Rev. 2020. PMID: 32267621
References
LinkOut - more resources
Full Text Sources