

JiangyaTongluo decoction ameliorates tubulointerstitial fibrosis via regulating the SIRT1/PGC-1α/mitophagy axis in hypertensive nephropathy
- PMID: 39726785
- PMCID: PMC11669701
- DOI: 10.3389/fphar.2024.1491315
JiangyaTongluo decoction ameliorates tubulointerstitial fibrosis via regulating the SIRT1/PGC-1α/mitophagy axis in hypertensive nephropathy
Abstract
Introduction: With the increasing prevalence of hypertension, the incidence of kidney diseases is also increasing, resulting in a serious public burden. Jiangya Tongluo decoction (JYTL), a recognized prescription in traditional Chinese medicine (TCM), is commonly used to calm an overactive liver and reduce excess yang, while also promoting blood flow to alleviate obstructions in the meridians. Previous research has indicated that JYTL may help mitigate kidney damage caused by hypertension; however, the underlying mechanisms have not been thoroughly assessed.
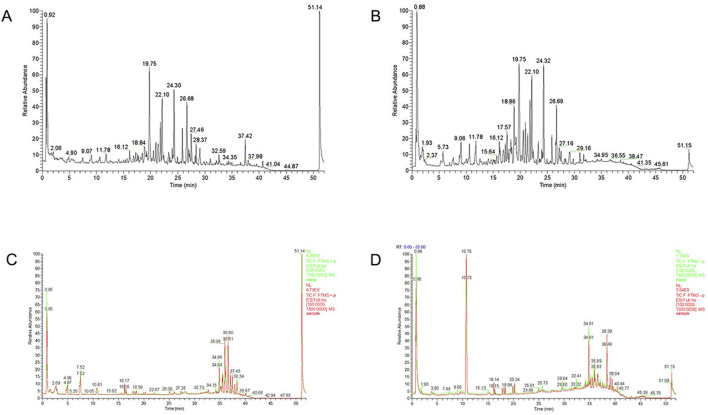
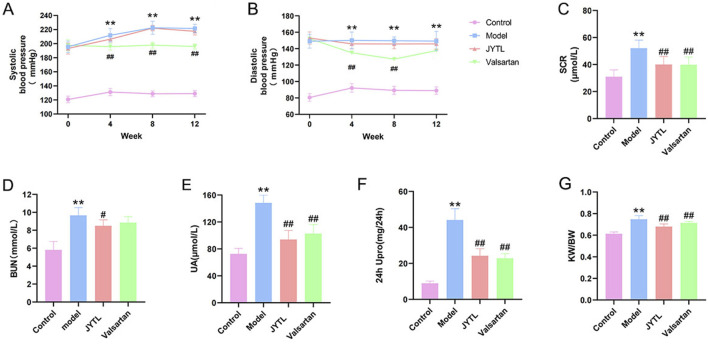
Methods: First, an amalgamation of UPLC-QE/MS and network pharmacology techniques was employed to pinpoint potential active components, primary targets, and crucial action mechanisms of JYTL in treating hypertensive nephropathy (HN). Then, we used spontaneous hypertensive rats (SHRs) and Wistar-Kyoto rats (WKYs) to evaluate the efficacy of JYTL on HN with valsartan as a positive reference. We also conducted DCFH-DA fluorescence staining in rat renal tissues to detect the level of ROS. Western blotting and immunohistochemistry were performed to investigate further the effect of JYTL decoction on key targets and signaling pathways.
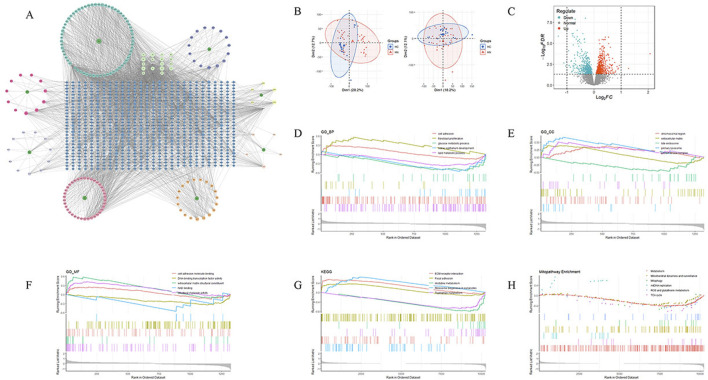
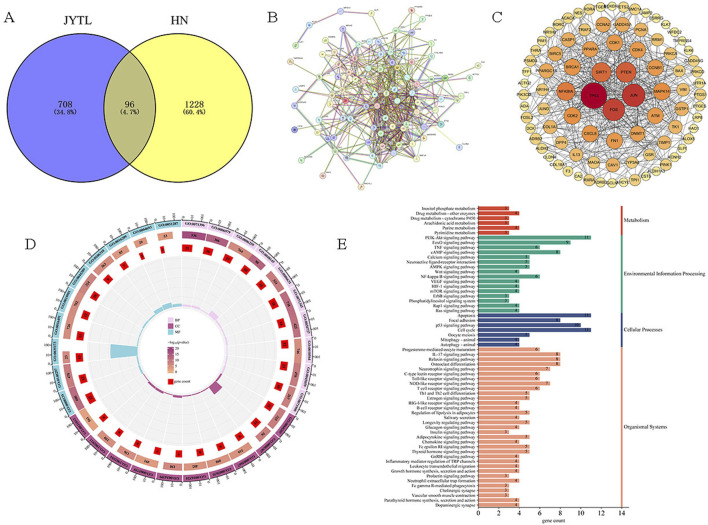
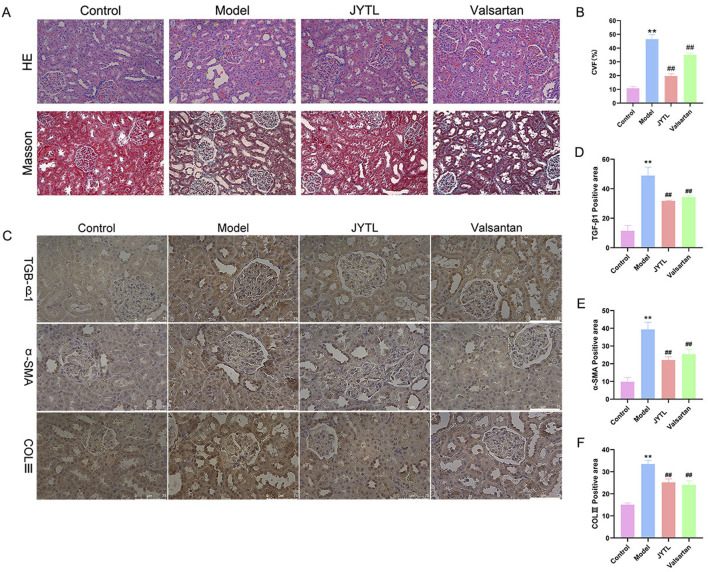
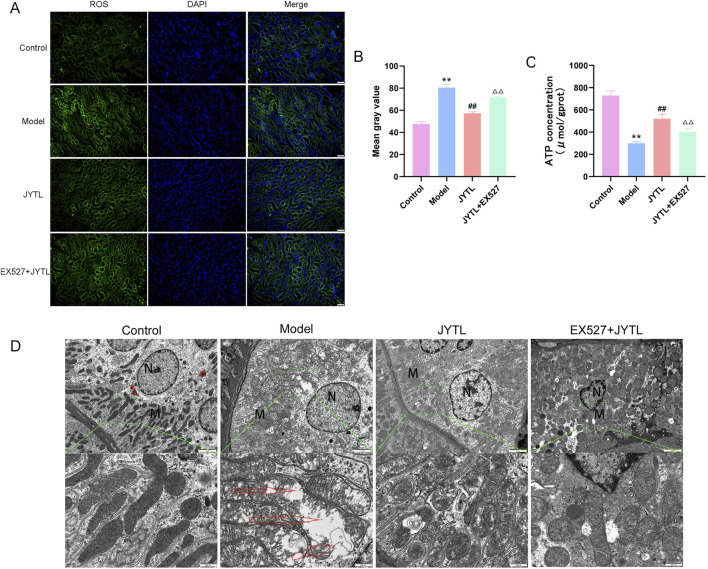
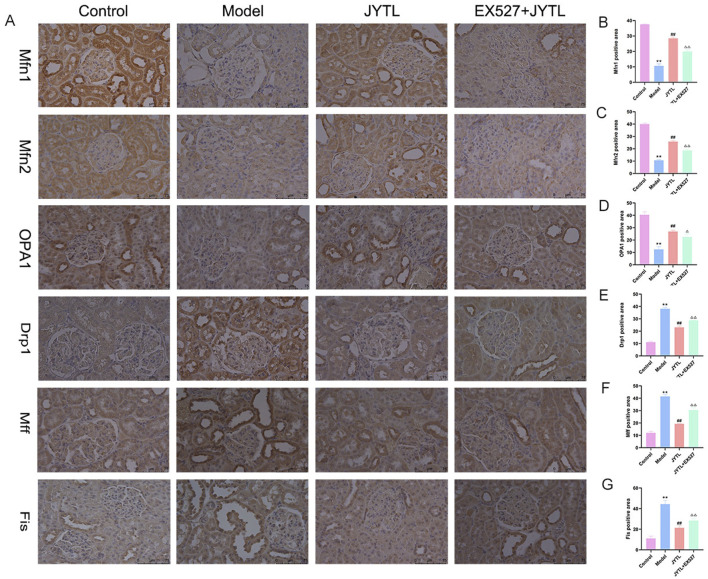
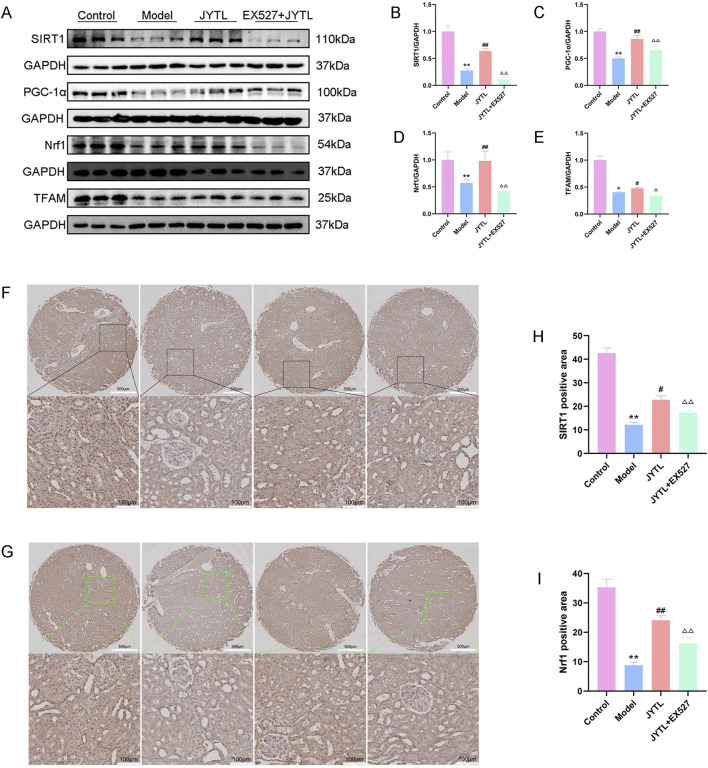
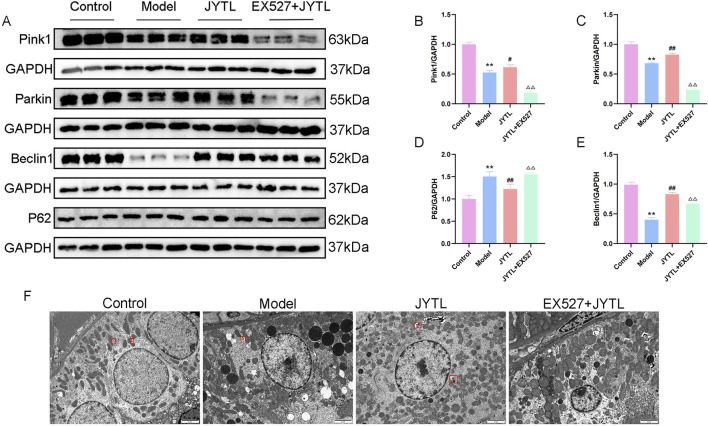
Results: Through UPLC-QE/MS and network analysis, 189 active ingredients and 5 hub targets were identified from JYTL. GSEA in the MitoCarta3.0 database and PPI network analysis revealed that JYTL predominantly engages in the Sirt1-mitophagy signaling pathway. Tanshinone iia, quercetin, and adenosine in JYTL are the main active ingredients for treating HN. In vivo validation showed that JYTL decoction could improve kidney function, ameliorate tubulointerstitial fibrosis (TIF), and improve mitochondrial function by inhibiting ROS production and regulating mitochondrial dynamics in SHRs. JYTL treatment could also increase the expression of SIRT1, PGC-1α, Nrf1, and TFAM, and activate PINK1/Parkin-mediated mitophagy.
Conclusion: JYTL decoction may exert renal function protective and anti-fibrosis effects in HN by ameliorating mitochondrial function and regulating the SIRT1/PGC-1α-mitophagy pathway.
Keywords: Chinese medicine; SIRT1; hypertensive nephropathy; mitochondrial dysfunction; mitophagy; tubulointerstitial fibrosis.
Copyright © 2024 Zhao, Jia, Hao, Han, Gao, Zhang, Yan, Li, Wu, Zhang, Li and Qin.
Conflict of interest statement
The authors declare that the research was conducted in the absence of any commercial or financial relationships that could be construed as a potential conflict of interest.
Figures
Similar articles
-
Placental Mesenchymal Stem Cells Alleviate Podocyte Injury in Diabetic Kidney Disease by Modulating Mitophagy via the SIRT1-PGC-1alpha-TFAM Pathway.Int J Mol Sci. 2023 Feb 28;24(5):4696. doi: 10.3390/ijms24054696. Int J Mol Sci. 2023. PMID: 36902127 Free PMC article.
-
Mitochondrial biogenesis: pharmacological approaches.Curr Pharm Des. 2014;20(35):5507-9. doi: 10.2174/138161282035140911142118. Curr Pharm Des. 2014. PMID: 24606795
-
Jiawei Bai-Hu-decoction ameliorated heat stroke-induced brain injury by inhibiting TLR4/NF-κB signal and mitophagy of glial cell.J Ethnopharmacol. 2024 Nov 15;334:118571. doi: 10.1016/j.jep.2024.118571. Epub 2024 Jul 10. J Ethnopharmacol. 2024. PMID: 38996953
-
Po-Ge-Jiu-Xin decoction alleviate sepsis-induced cardiomyopathy via regulating phosphatase and tensin homolog-induced putative kinase 1 /parkin-mediated mitophagy.J Ethnopharmacol. 2025 Jan 30;337(Pt 3):118952. doi: 10.1016/j.jep.2024.118952. Epub 2024 Oct 18. J Ethnopharmacol. 2025. PMID: 39426573
-
Clinical efficacies, underlying mechanisms and molecular targets of Chinese medicines for diabetic nephropathy treatment and management.Acta Pharm Sin B. 2021 Sep;11(9):2749-2767. doi: 10.1016/j.apsb.2020.12.020. Epub 2021 Feb 2. Acta Pharm Sin B. 2021. PMID: 34589395 Free PMC article. Review.
Cited by
-
Mitophagy in Hypertensive Cardiac Hypertrophy: Mechanisms and Therapeutic Implications.J Clin Hypertens (Greenwich). 2025 Aug;27(8):e70127. doi: 10.1111/jch.70127. J Clin Hypertens (Greenwich). 2025. PMID: 40823764 Free PMC article. Review.
-
Ameliorating effect of the aldose reductase inhibitor 1-Acetyl-5-phenyl-1 H-pyrrol-3-ylacetate on galactose-induced cataract.Sci Rep. 2025 Apr 14;15(1):12759. doi: 10.1038/s41598-025-98079-9. Sci Rep. 2025. PMID: 40229517 Free PMC article.
References
-
- Chandran G., Sirajudeen K. N., Yusoff N. S., Swamy M., Samarendra M. S. (2014). Effect of the antihypertensive drug enalapril on oxidative stress markers and antioxidant enzymes in kidney of spontaneously hypertensive rat. Oxid. Med. Cell Longev. 2014, 608512. 10.1155/2014/608512 - DOI - PMC - PubMed
LinkOut - more resources
Full Text Sources