

Gestational diabetes-combined excess weight gain exacerbates gut microbiota dysbiosis in newborns, associated with reduced abundance of Clostridium, Coriobacteriaceae, and Collinsella
- PMID: 39726807
- PMCID: PMC11670820
- DOI: 10.3389/fcimb.2024.1496447
Gestational diabetes-combined excess weight gain exacerbates gut microbiota dysbiosis in newborns, associated with reduced abundance of Clostridium, Coriobacteriaceae, and Collinsella
Abstract
Background: Existing literature indicates that Gestational diabetes mellitus (GDM) and maternal obesity disrupt the normal colonization of the neonatal gut microbiota alone. Still, the combined impact of GDM and excessive gestational weight gain (EGWG) on this process remains under explored. The association between gestational weight gain before/after GDM diagnosis and neonatal gut microbiota characteristics is also unclear.The purpose of this study is to conduct investigation and analysis on the above-mentioned issues, providing a basis for optimizing clinical management plans.
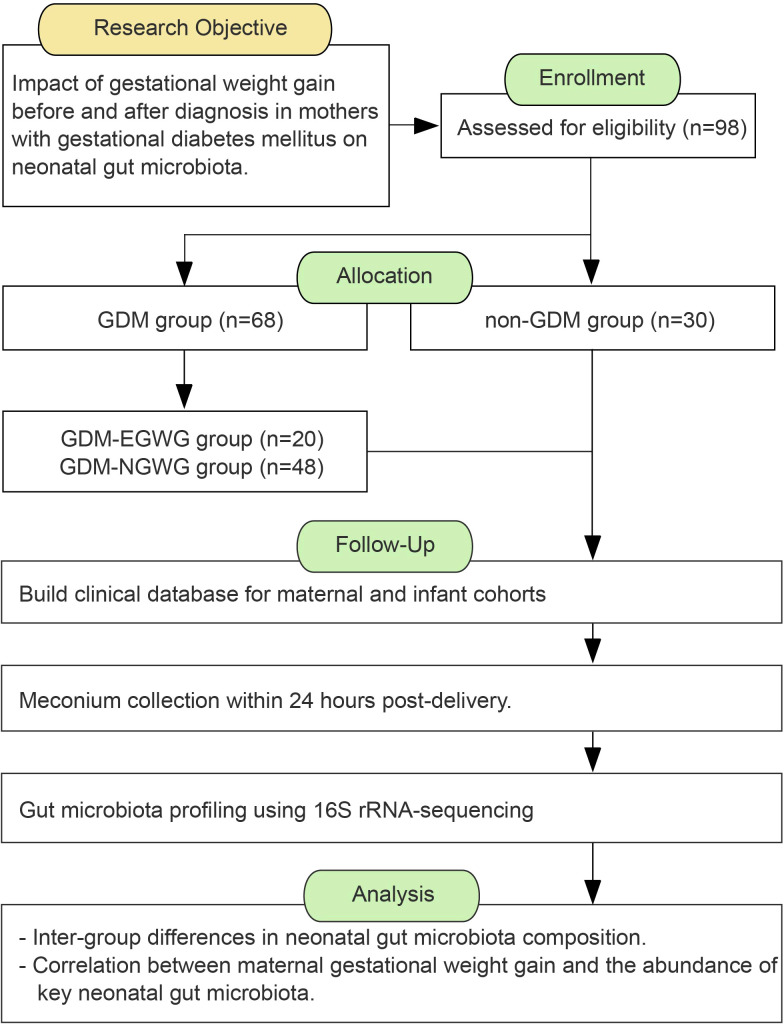
Methods: This study involved 98 mother-infant pairs categorized into GDM and non-GDM groups. The GDM group was further subdivided based on gestational weight gain (GWG) into normal (GDM+NGWG) and excessive (GDM+EGWG) weight gain groups. Neonatal stool samples were collected within 24 hours post-delivery for gut microbiota profiling through 16S rRNA gene sequencing. Statistical analyses explored correlations between total GWG/BMI gain and those before/after GDM diagnosis (t-GWG/GBG; b-GWG/GBG; a-GWG/GBG) with key bacterial taxa.
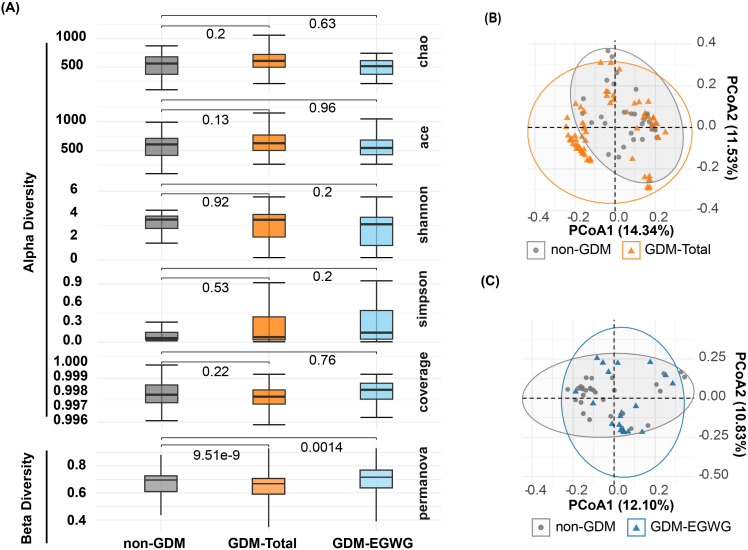
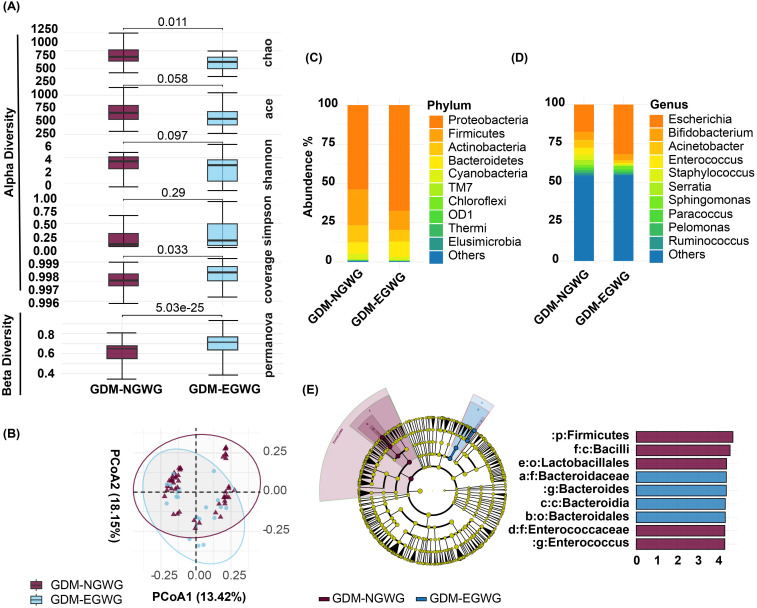
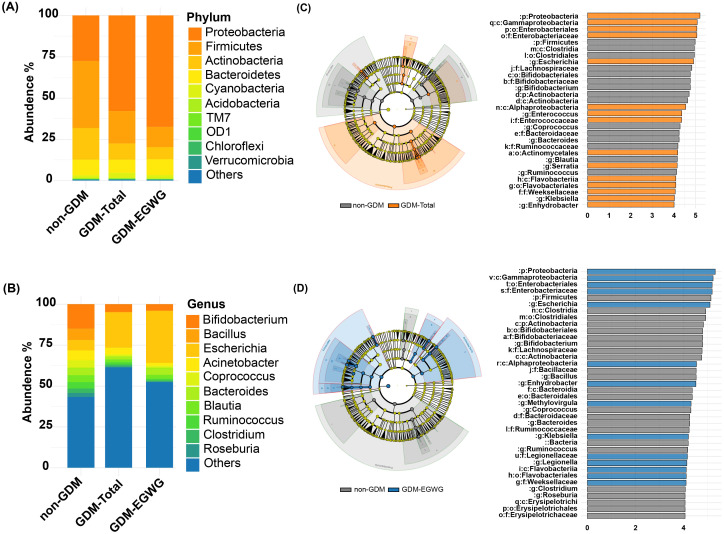
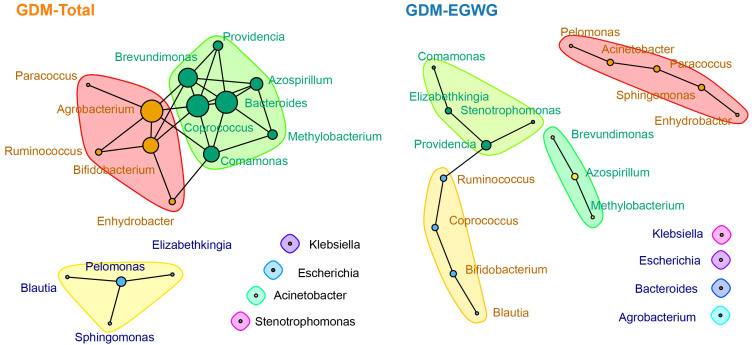
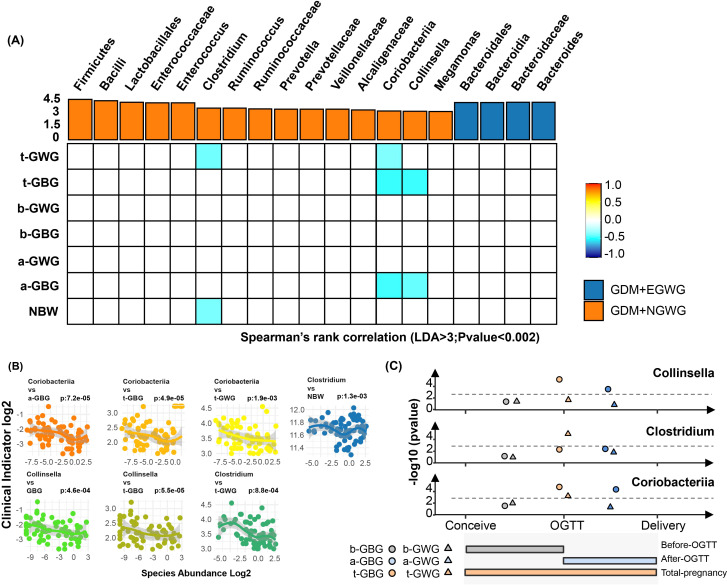
Results: Notable genus-level changes included enrichment of Escherichia and Klebsiella, and depletion of Bacteroides, Bifidobacterium, Coprococcus, Ruminococcus among GDM-Total and GDM+EGWG groups compared to non-GDM. Further,LEfSe analysis identified 30 differential bacteria taxa between GDM-Total and healthy control groups, which increased to 38 between GDM+EGWG and non-GDM groups, highlighting more pronounced microbial shifts associated with EGWG. Clostridium was negatively correlated with t-GWG and newborn birth weight; The Coriobacteriaceae showed a negative correlation with t-GWG, t-GBG, and a-GBG. Additionally,Collinsella exhibited negative correlations with t-GBG and a-GBG.
Conclusion: This study has identified that the presence of EGWG in GDM mothers further exacerbated neonatal gut microbial perturbations. Total GWG/GBG and those after the diagnosis of GDM were negatively correlated with the abundance of neonatal gut Clostridium, Coriobacteriaceae, and Collinsella. These findings provide new insights for precise prevention and management of GDM.
Keywords: 16S rRNA; excessive gestational weight gain; gestational diabetes mellitus; gut microbiota; newborns.
Copyright © 2024 Xiao, Shi, Ni, Ni, Yang and Zhang.
Conflict of interest statement
The authors declare that the research was conducted in the absence of any commercial or financial relationships that could be construed as a potential conflict of interest.
Figures
Similar articles
-
Gestational diabetes is associated with change in the gut microbiota composition in third trimester of pregnancy and postpartum.Microbiome. 2018 May 15;6(1):89. doi: 10.1186/s40168-018-0472-x. Microbiome. 2018. PMID: 29764499 Free PMC article.
-
The associations of pre-pregnancy BMI and gestational weight gain with maternal gut microbiota.Benef Microbes. 2024 Jul 3;15(4):397-410. doi: 10.1163/18762891-bja00018. Benef Microbes. 2024. PMID: 38955351
-
Pre-pregnancy weight, gestational weight gain, and the gut microbiota of mothers and their infants.Microbiome. 2017 Sep 4;5(1):113. doi: 10.1186/s40168-017-0332-0. Microbiome. 2017. PMID: 28870230 Free PMC article.
-
Characteristics of the gut microbiome in women with gestational diabetes mellitus: A systematic review.PLoS One. 2022 Jan 13;17(1):e0262618. doi: 10.1371/journal.pone.0262618. eCollection 2022. PLoS One. 2022. PMID: 35025980 Free PMC article.
-
Effects of women with gestational diabetes mellitus related weight gain on pregnancy outcomes and its experiences in weight management programs: a mixed-methods systematic review.Front Endocrinol (Lausanne). 2023 Nov 20;14:1247604. doi: 10.3389/fendo.2023.1247604. eCollection 2023. Front Endocrinol (Lausanne). 2023. PMID: 38075066 Free PMC article.
Cited by
-
The Role of Microbiota in the Pathogenesis of Bullous Pemphigoid and Pemphigus Vulgaris: Evidence, Controversies, and Perspectives.Int J Mol Sci. 2025 Jun 24;26(13):6076. doi: 10.3390/ijms26136076. Int J Mol Sci. 2025. PMID: 40649854 Free PMC article. Review.
References
-
- Chen F., Wang P., Wang J., Liao Z., Zong X., Chen Y., et al. . (2022). Analysis and comparison of early childhood nutritional outcomes among offspring of Chinese women under the Chinese 2021 and US 2009 gestational weight gain guidelines. JAMA Netw. Open 5, e2233250. doi: 10.1001/jamanetworkopen.2022.33250 - DOI - PMC - PubMed
MeSH terms
Substances
LinkOut - more resources
Full Text Sources
Medical