. 2024 Dec 20;19(1):20241088.
doi: 10.1515/med-2024-1088. eCollection 2024.

Single-cell analysis identified key macrophage subpopulations associated with atherosclerosis

Affiliations

Single-cell analysis identified key macrophage subpopulations associated with atherosclerosis

Zhenzhen Zhao et al. Open Med (Wars). .

Abstract

Background: Atherosclerosis is a lipid-driven inflammatory disease characterized by plaque formation in major arteries. These plaques contain lipid-rich macrophages that accumulate through monocyte recruitment, local macrophage differentiation, and proliferation.

Objective: We identify the macrophage subsets that are closely related to atherosclerosis and reveal the key pathways in the progression of atherosclerotic disease.

Materials and methods: In this study, we characterize the single-cell landscape of atherosclerosis, identifying macrophage subsets closely related to the disease and revealing key pathways in its progression. Using analytical methods like CytoTRACE, Monocle2, Slingshot, and CellChat, we study macrophage differentiation and infer cell trajectory.

Results: The 8,417 macrophages were divided into six subtypes, macrophages: C0 C1QC+ macrophages, C1 SPP1+ macrophages, C2 FCN1+ macrophages, C3 IGKC+ macrophages, C4 FCER1A+ macrophages, C5CALD1+ macrophages. The results of gene set enrichment analysis, Monocle2, and Slingshot suggest that C2 FCN1+ macrophages may play an important role in the progression of atherosclerosis. C2 FCN1+ macrophages interact with endothelial cells via CCL, CXCL, APP, and other pathways to regulate the progression of atherosclerosis.

Conclusion: We identify a key macrophage subgroup (C2 FCN1+ macrophages) associated with atherosclerosis, which interacts with endothelial cells via CCL, CXCL, APP, and other pathways to regulate disease progression.

Keywords: CCL; FCN1; atherosclerosis; clinical outcome; macrophage.


Conflict of interest statement

Conflict of interest: The authors state no conflict of interest.

Figures

Figure 1
Figure 1
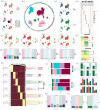
The flow diagram of this study. The biological characteristics of macrophages in carotid atherosclerosis were studied by single-cell analysis methods such as dimension reduction, clustering, pseudotiming, and cell communication. C2 FCN1+ macrophages interacted with endothelial cells through the APP and CXCL signaling pathways. The most active receptor–ligand pairs were APP–CD47 and CXCL8–ACKR1.
Figure 2
Figure 2
Identification of major cell types in atherosclerotic disease. (a–c) UMAP plot was used to demonstrate the distribution of 45,690 high-quality cells in terms of sample source, downscaled clustering (serurat method of clustering), tissue site (AC, atherosclerotic core; PA, adjacent portion), and cell cycle (G1, G2M, S), and annotated into 6 cell types based on differential gene expression. (d) Bubble plots demonstrating the differential expression of the top five most significant (top5) maker genes for the six cell types and different tissue types. The color of the bubbles indicates the expression and the size indicates the percentage of expression. (e) Umap plot demonstrating the distribution of nCount_RNA, nFeature_RNA, S.Score, and G2M.Score for the six cell types. (f) Bar plot demonstrating the difference levels of nCount_RNA, nFeature_RNA, S.Score, and G2M.Score for the six cell types. (g) Heatmap demonstrating the tissue origin of the 6 major cell types of atherosclerosis and cell cycle distribution. (h) Heatmap showing the results of enrichment analysis of differential genes of the six major cell types. (i and j) Stacked bar graphs and faceted graphs showing the percentage of the six major cell types in different tissue sites and cell cycles. (k and l) Bar graphs showing the differential expression levels of stemness genes in different cell types, tissue sources, and cell cycles.
Figure 3
Figure 3
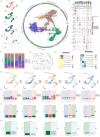
Atherosclerotic macrophage subpopulations. (a) UMAP plots of 8417 high-quality atherosclerotic macrophage samples source, tissue type (AC, PA), and cell cycle (G1, G2M, S). (b and c) UMAP plots were used to demonstrate the unsupervised clustering of atherosclerotic macrophages into six cell clusters (C0 C1QC+ macrophages, C1 SPP1+ macrophages, C2 FCN1+ macrophages, C3 IGKC+ macrophages, C4 FCER1A+ macrophages, C5CALD1+ macrophages). (d) Bubble plots showing the expression of the 5 most significant differential genes (top5) in macrophage subpopulations as well as in different tissue types. (e–g) Stacked bar graphs, box line graphs, and cell abundance graphs demonstrating the relative abundance (as a percentage) of the six macrophage subpopulations in different tissue types and in the cell cycle. (h) Distribution of CNVscore, nCount_RNA, nFeature_RNA, G2M.Score, and S.Score of the six macrophage subpopulations using UMAP plots. (i) Bar plots demonstrating the levels of CNVscore, nCount_RNA, nFeature_RNA, G2M.Score, and S.Score for different macrophage subpopulations. (j and k) Bar plots demonstrating CNVscore, nCount_RNA, nFeature_RNA, G2M.Score, and S.Score levels for different tissue types and cell cycles.
Figure 4
Figure 4
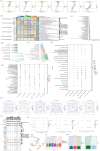
Atherosclerosis macrophage enrichment analysis results. (a) Volcano plot of differentially expressed genes in six macrophage subtypes. (b) Heatmap showing the first 5 enrichment entries of GOBP enrichment analysis of macrophage subtype differential genes. (c–e) Atherosclerotic macrophages in different cell types, tissue origin, and cell cycle enrichment analysis results. (f) Results of macrophage subtype differential gene enrichment analysis based on GOBP entries after GSEA scoring were shown by bubble plots. Bubble size indicates GeneRatio, and color indicates scoring by GSEA. (g) Results of the fibroblast subtype differential gene enrichment analysis based on GOBP entries were shown by bubble plots. Bubble size indicates GeneRatio and color represents P.adjust. (h) Word cloud plot of macrophage subtype differential gene GOBP enrichment analysis. (i) Differential expression of stemness genes in macrophage subtypes was shown using bubble plots. (j) Bubble plot demonstrating differential expression of stemness gene sets in different macrophage subtypes, tissue sources, and cell cycle. (k) UMAP plot demonstrating differential expression of stemness genes scored by AUC. (l and m) Bar plots demonstrating differential expression of stemness gene sets across macrophage subtypes, tissue sources, and the cell cycle.
Figure 5
Figure 5
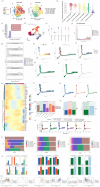
Cytotrace and monocle2 trajectory analysis reveal different differentiated states of atherosclerotic macrophages. (a) The differentiation ability of atherosclerotic macrophages was analyzed using cytotrace (left), where redder colors represent higher stemness and higher differentiation potential and bluer colors represent lower stemness and lower differentiation potential; macrophages were colored according to their different cell types to demonstrate the differentiation potential of macrophages (right). (b) Box-and-line graphs demonstrating the cellular stemness levels of the six macrophage species. (c) Bar graph demonstrating the correlation of stemness genes in the cytotrace analysis, with red indicating positive correlation and purple indicating negative correlation. (d–f) UMAP plot demonstrating the distribution of the proposed temporal trajectories analyzed using Monocle. Blue color shows the starting point of the proposed temporal trajectory and red color shows the end point of the proposed temporal trajectory. Violin and ridge plots demonstrate the distribution of the six macrophage types with the proposed temporal trajectories. (g) Fractional ridge plot further demonstrates the distribution of macrophages in the proposed temporal trajectory. (h–j) UMAP plot demonstrating the proposed temporal trajectory of atherosclerotic macrophages. The right side was the starting point, with two branches to the right, one of which was like the lower left and one of which was divided into two more branches to the upper left. (k and l) UMAP plot shows the distribution of AC and PA tissue types in the proposed temporal trajectory of monocle2. AC: atherosclerotic core, PA: adjacent site. (m) The heatmap shows the differential expression of target genes with pseudo time series. (n and o) UMAP plots demonstrate the distribution of different cell cycles in the monocle2 proposed temporal trajectory. (p and q) Bar plots further demonstrate the expression of different cell types, different tissue distributions, and the distribution of different cell cycles with cell trajectories. (r) Two-dimensional trajectory plots demonstrating the distribution of each of the six types of macrophages with the trajectories. (s) Stacked bar graphs show the percentages of different macrophages, different tissue sources, and different cell cycles in each of the five cell trajectory phases. (t) The segmented bar graphs show the percentages of different macrophages, different tissue sources, and different cell cycles in the five cell trajectory phases for different macrophage tissue sources. (u) Scatter plots show the expression of macrophage maker genes in chronological order.
Figure 6
Figure 6
Slingshot analysis of cell trajectories of atherosclerotic macrophages. (a and b) Atherosclerotic macrophages were analyzed using Slingshot to fit and two different differentiation trajectories, Lineage1:C2 FCN1+ macrophages → C3 IGKC+ macrophages → C0 C1QC+ macrophages → C1 SPP1+ macrophages. (c) Proposed time-series scatter plot showing the distribution of maker genes in Lineage1 for each of the six macrophage species. (d) Heatmap showing the analysis results of GOBP enrichment entries based on the proposed temporal trajectory Lineage1. (e and f) Analysis of atherosclerotic macrophages using Slingshot, the proposed and differentiation trajectory, Lineage2:C2 FCN1+ macrophages → C3 IGKC+ macrophages → C0 C1QC+ macrophages → C4 FCER1A+ macrophages → C2 FCN1+ macrophages. (g) Proposed time-series scatter plot showing the distribution of maker genes in Lineage2 for each of the six macrophage species. (h) Heatmap showing the results of the analysis of GOBP-enriched entries based on the fitted temporal trajectory Lineage2.
Figure 7
Figure 7
Communication network analysis between atherosclerotic cells. (a) Circle plot demonstrating the number (left) and strength (right) of receptor–ligand interactions in all atherosclerotic cells. (b and d) Afferent signaling patterns of secretory cells (top) and afferent signaling patterns of target cells (bottom) visualized by Sankey diagrams showing the correspondence between inferred potential patterns and cell populations as well as signaling pathways. The thickness of the flux indicates the contribution of the cell population or signaling pathway to each potential pattern. The height of each pattern was proportional to the number of its associated cell population or signaling pathway. Efferent patterns reveal how sending cells coordinate with each other and how they coordinate with specific signaling pathways to drive communication. Afferent patterns reveal how target cells coordinate with each other and how they coordinate. (c and e) Heatmap visualizing pattern recognition of all cellular interactions in atherosclerosis, showing three cases of pattern recognition for afferent signaling and three cases of pattern recognition for efferent signaling. (f) Heatmap showing afferent and efferent signal strengths for all cellular interactions in atherosclerosis. (g and h) To illustrate the afferent communication pattern of target cells and the efferent signaling communication pattern of secretory cells, bubble diagrams were used to show the strength of receptor–ligand interactions. Different colors were used to distinguish different cell types, while the size of the dots was adjusted to indicate the number of cells. (i) Screening for macrophages as a source of cellular interactions, utilizing a circle graph to show the number and intensity of macrophage interactions with other cells. (j) Screening macrophages as targets of cellular interactions, utilizing circle diagrams to demonstrate the number and intensity of macrophage interactions with other cells.
Figure 8
Figure 8
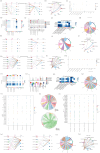
Screening signaling pathways for strong interactions between macrophages and endothelial cells. (a–c) Screening all macrophages as the SOURCE, endothelial cells as the TARGET, and the signaling pathway with the strongest interaction between cells as the CCL signaling pathway. Use the layered diagram, circle diagram, and bubble diagram to demonstrate the intercellular communication network conducted by the CCL signaling pathway. The layered diagram consists of two parts: the left part and the right part highlight autocrine and paracrine signaling in the macrophage state and other cell states, respectively. (d, e, and g) Heatmaps, violin diagrams, and chord diagrams of cellular interactions of the CCL signaling pathway. (f) Heatmap based on four network centrality measures of the CCL signaling network showing the relative importance of each cell group. (h–j) Hierarchical, chordal, and circle diagrams demonstrating the intercellular communication network with CCL2–ACKR1 as the receptor–ligand pair interaction. (k–m) Screening of all endothelial cells as the SOURCE, all macrophages as the TARGET, and the signaling pathway with the strongest intercellular interactions as the APP signaling pathway. Use hierarchical diagrams, circle diagrams, and bubble diagrams to demonstrate the intercellular communication network for APP signaling pathway transduction. (n, o, and q) Heatmaps, violin plots, and chord plots of APP signaling pathway cell interactions. (p) Heatmap based on four network centrality measures of the APP signaling network showing the relative importance of each cell group. (r) Screening endothelial cells as the SOURCE and C2 FCN1+ macrophage subpopulation as the TARGET, the signaling pathway with the strongest cellular interactions is also the APP signaling pathway. Intercellular receptor–ligand interaction dot plots when screening endothelial cells as source. (s) Chordal diagram of receptor–ligand interactions when screening endothelial cells as source (top) and C2 FCN1+ macrophage subpopulation as target (bottom). (t) Dot plot of inter-cellular receptor–ligand interactions when screening a subpopulation of C2 FCN1+ macrophages as target. (u–w) Hierarchical, chordal, and circle diagrams demonstrating the intercellular communication network with APP-CD74 as the receptor–ligand pair interaction.
Figure 9
Figure 9
Visual analysis of CXCL signaling pathway. (a–c) Screening C2 FCN1+ macrophage subpopulation as source and endothelial cells as target, the signaling pathway with the strongest cell-to-cell interaction was the CXCL signaling pathway. Use hierarchical diagrams, circle diagrams, and bubble diagrams to demonstrate the intercellular communication network conducted by the CXCL signaling pathway. (d, e, g) Heatmap, violin diagram, and chord diagram of CXCL signaling pathway cell interactions. (f) Heatmap based on four network centrality measures of the CXCL signaling network showing the relative importance of each cell group. (h) Screening of C2 FCN1+ macrophage subpopulation as SOURCE, for endothelial cell TARGET, the signaling pathway with the strongest cellular interactions is also the APP signaling pathway. Dot plot of intercellular receptor–ligand interactions when screening C2 FCN1+ macrophage subpopulation for source. (i) Chordal diagram of receptor–ligand interactions when screening C2 FCN1+ macrophage subpopulation as source (top) and endothelial cells as target (bottom). (j) Dot plot of intercellular receptor–ligand interactions when screening endothelial cells as target. (k–m) Hierarchical, chordal, and circle diagrams showing the intercellular communication network with CXCL8–ACKR1 as the receptor–ligand pair interaction.

Similar articles

Cited by

References

    1. Fan J, Watanabe T. Atherosclerosis: known and unknown. Pathol Int. 2022 Mar;72(3):151–60. 10.1111/pin.13202. http://www.ncbi.nlm.nih.gov/entrez/query.fcgi?cmd=Retrieve&db=pubmed.... - DOI - PubMed
    1. Herrington W, Lacey B, Sherliker P, Armitage J, Lewington S. Epidemiology of atherosclerosis and the potential to reduce the global burden of atherothrombotic disease. Circ Res. 2016 Feb;118(4):535–46. 10.1161/CIRCRESAHA.115.307611. http://www.ncbi.nlm.nih.gov/entrez/query.fcgi?cmd=Retrieve&db=pubmed.... - DOI - PubMed
    1. Li Q, Qi L, Zhao K, Ke W, Li T, Xia L. Integrative quantitative and qualitative analysis for the quality evaluation and monitoring of Danshen medicines from different sources using HPLC-DAD and NIR combined with chemometrics. Front Plant Sci. 2022;13:932855. 10.3389/fpls.2022.932855. http://www.ncbi.nlm.nih.gov/entrez/query.fcgi?cmd=Retrieve&db=pubmed.... - DOI - PMC - PubMed
    1. Williams JW, Winkels H, Durant CP, Zaitsev K, Ghosheh Y, Ley K. Single cell rna sequencing in atherosclerosis research. Circ Res. 2020 Apr;126(9):1112–26. 10.1161/CIRCRESAHA.119.315940. http://www.ncbi.nlm.nih.gov/entrez/query.fcgi?cmd=Retrieve&db=pubmed.... - DOI - PMC - PubMed
    1. Wang HM, Yang Z, Qi Y, Huang YL, Xiao LX, et al. Addition of risk-enhancing factors improves risk assessment of atherosclerotic cardiovascular disease in middle-aged and older chinese adults: Findings from the chinese multi-provincial cohort study. Cardiovas Innov Appl. 2023;8:27. 10.15212/CVIA.2023.0036. - DOI

LinkOut - more resources