

Identification of signatures associated with microsatellite instability and immune characteristics to predict the prognostic risk of colon cancer
- PMID: 39726813
- PMCID: PMC11669901
- DOI: 10.1515/med-2024-1056
Identification of signatures associated with microsatellite instability and immune characteristics to predict the prognostic risk of colon cancer
Abstract
Background: Microsatellite instability (MSI) significantly impacts treatment response and outcomes in colon cancer; however, its underlying molecular mechanisms remain unclear. This study aimed to identify prognostic biomarkers by comparing MSI and microsatellite stability (MSS).
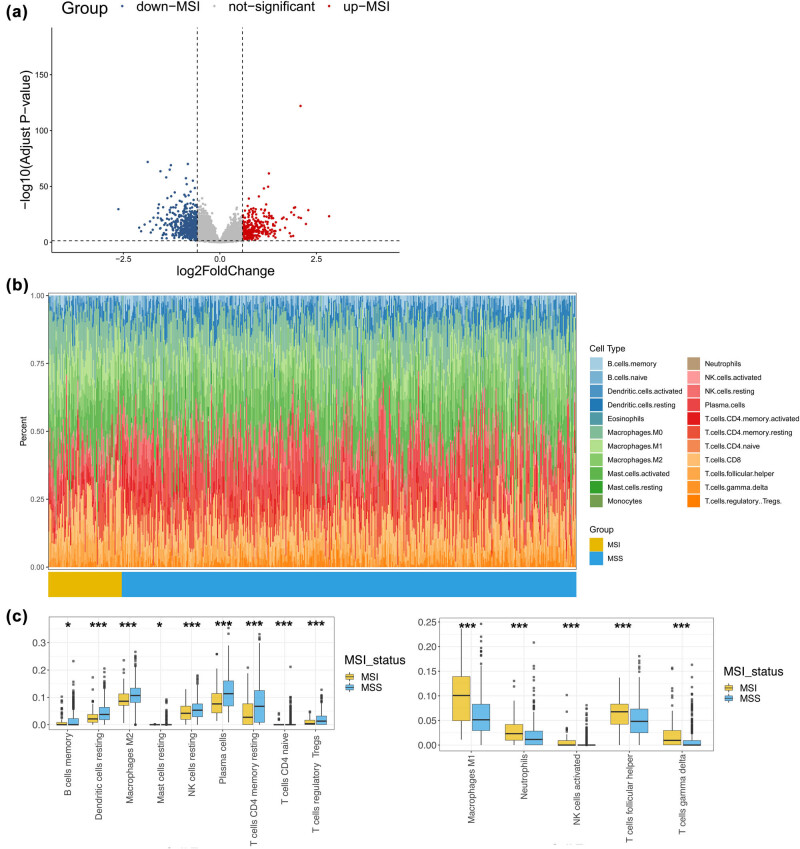
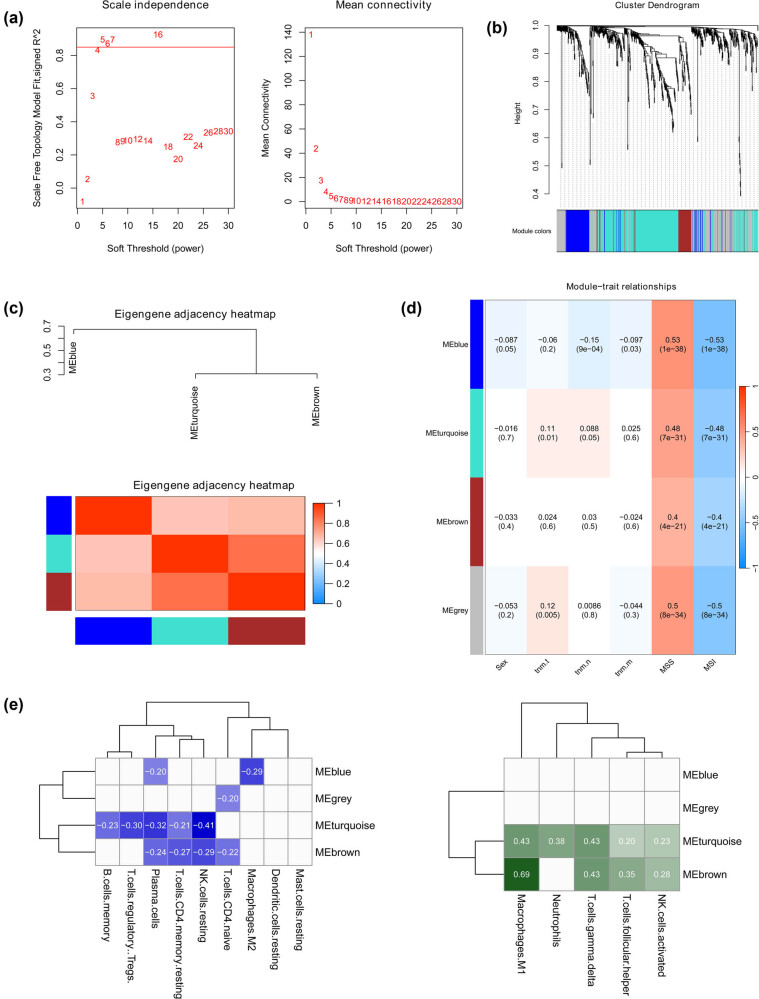
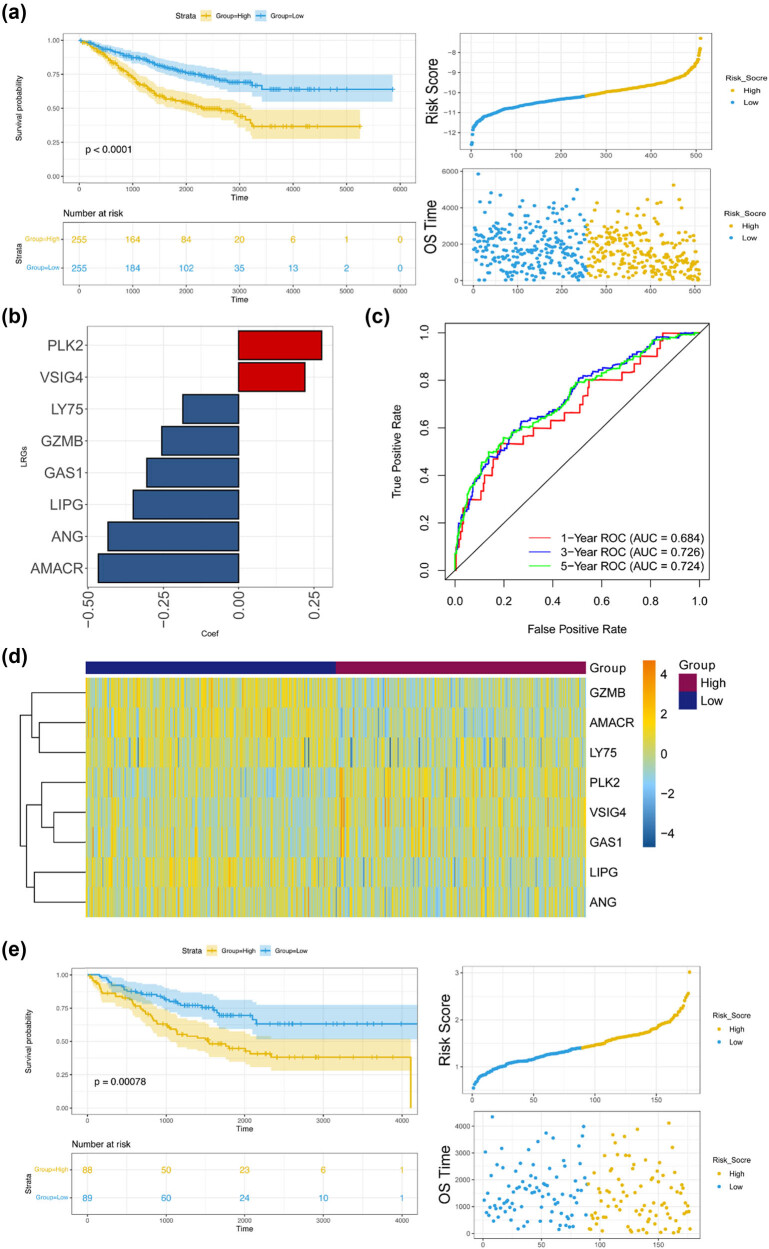
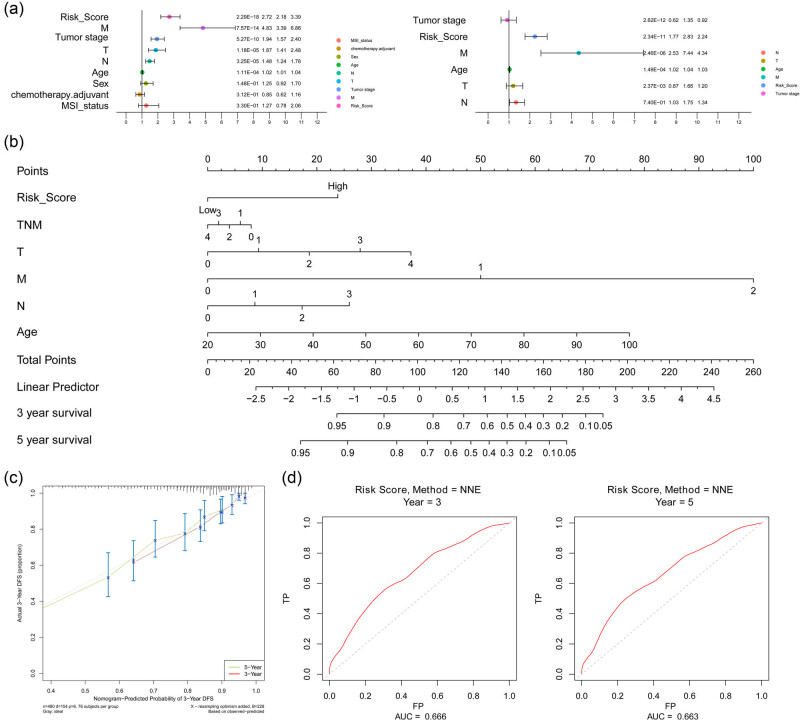
Methods: Data from the GSE39582 dataset downloaded from the Gene Expression Omnibus database were analyzed for differentially expressed genes (DEGs) and immune cell infiltration between MSI and MSS. Then, weighted gene co-expression network analysis (WGCNA) was utilized to identify the key modules, and the modules related to immune infiltration phenotypes were considered as the immune-related gene modules, followed by enrichment analysis of immune-related module genes. Prognostic signatures were derived using Cox regression, and their correlation with immune features and clinical features was assessed, followed by a nomogram construction.
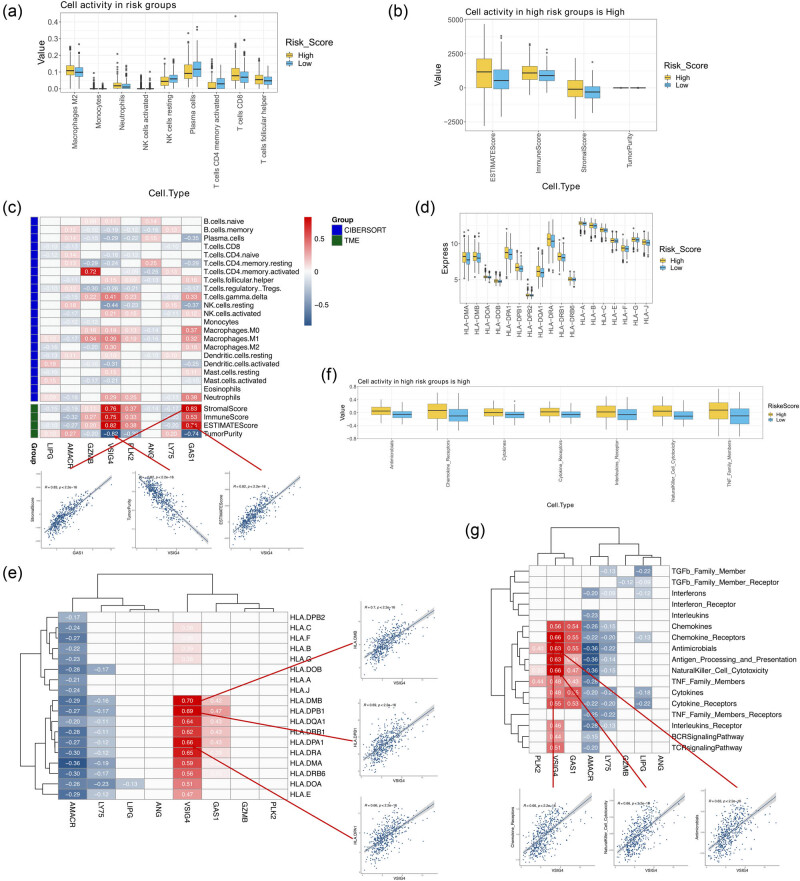
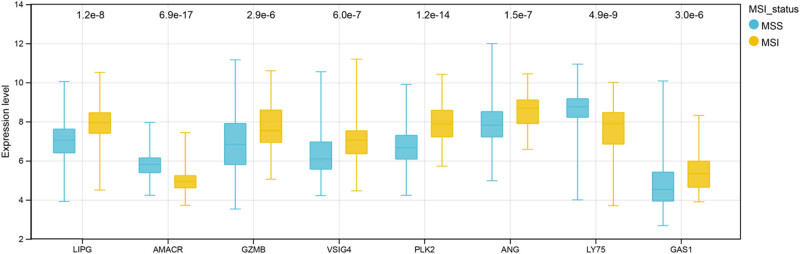
Results: A total of 857 DEGs and 14 differential immune cell infiltration between MSI and MSS were obtained. Then, WGCNA identified two immune-related modules comprising 356 genes, namely MEturquoise and MEbrown. Eight signature genes were identified, namely PLK2, VSIG4, LY75, GZMB, GAS1, LIPG, ANG, and AMACR, followed by prognostic model construction. Both training and validation cohorts revealed that these eight signature genes have prognostic value, and the prognostic model showed superior predictive performance for colon cancer prognosis and distinguished the clinical characteristics of colon cancer patients. Notably, VSIG4 among the signature genes correlated significantly with immune infiltration, human leukocyte antigen expression, and immune pathway enrichment. Finally, the constructed nomogram model could significantly predict the prognosis of colorectal cancer.
Conclusion: This study identifies eight prognostic signature genes associated with MSI and immune infiltration in colon cancer, suggesting their potential for predicting prognostic risk.
Keywords: colon cancer; immune microenvironment; microsatellite instability; prognostic model; weighted gene co-expression network analysis.
© 2024 the author(s), published by De Gruyter.
Conflict of interest statement
Conflict of interest: There are no conflicts of interest.
Figures

Similar articles
-
Identification of microsatellite instability and immune-related prognostic biomarkers in colon adenocarcinoma.Front Immunol. 2022 Oct 7;13:988303. doi: 10.3389/fimmu.2022.988303. eCollection 2022. Front Immunol. 2022. PMID: 36275690 Free PMC article.
-
Analysis of the molecular nature associated with microsatellite status in colon cancer identifies clinical implications for immunotherapy.J Immunother Cancer. 2020 Oct;8(2):e001437. doi: 10.1136/jitc-2020-001437. J Immunother Cancer. 2020. PMID: 33028695 Free PMC article.
-
Development and validation of a prognostic prediction model for endometrial cancer based on CD8+ T cell infiltration-related genes.Medicine (Baltimore). 2024 Dec 6;103(49):e40820. doi: 10.1097/MD.0000000000040820. Medicine (Baltimore). 2024. PMID: 39654198 Free PMC article.
-
Identification of cuproptosis-related subtypes, construction of a prognosis model, and tumor microenvironment landscape in gastric cancer.Front Immunol. 2022 Nov 21;13:1056932. doi: 10.3389/fimmu.2022.1056932. eCollection 2022. Front Immunol. 2022. PMID: 36479114 Free PMC article.
-
Identification and validation of an immune-associated RNA-binding proteins signature to predict clinical outcomes and therapeutic responses in colon cancer patients.World J Surg Oncol. 2021 Oct 26;19(1):314. doi: 10.1186/s12957-021-02411-2. World J Surg Oncol. 2021. PMID: 34702278 Free PMC article.
References
-
- Arredondo J, Pastor E, Simó V, Beltrán M, Castañón C, Magdaleno MC, et al. Neoadjuvant chemotherapy in locally advanced colon cancer: a systematic review. Tech Coloproctol. 2020;24(10):1001–15. - PubMed
-
- Jahanafrooz Z, Mosafer J, Akbari M, Hashemzaei M, Mokhtarzadeh A, Baradaran B. Colon cancer therapy by focusing on colon cancer stem cells and their tumor microenvironment. J Cell Physiol. 2020;235(5):4153–66. - PubMed
LinkOut - more resources
Full Text Sources
Research Materials
Miscellaneous