

Quantitative analysis of the caloric restriction versus isocaloric diets models based on macronutrients composition: impacts on body weight regulation, anthropometric, and bioimpedance parameters in women with obesity
- PMID: 39726871
- PMCID: PMC11670075
- DOI: 10.3389/fnut.2024.1493954
Quantitative analysis of the caloric restriction versus isocaloric diets models based on macronutrients composition: impacts on body weight regulation, anthropometric, and bioimpedance parameters in women with obesity
Abstract
Introduction: Obesity is a growing public health issue, especially among young adults, with long-term management strategies still under debate. This prospective study compares the effects of caloric restriction and isocaloric diets with different macronutrient distributions on body composition and anthropometric parameters in obese women during a 12-week weight loss program, aiming to identify the most effective dietary strategies for managing obesity-related health outcomes.
Methods: A certified clinical nutritionist assigned specific diets over a 12-week period to 150 participants, distributed as follows: hypocaloric diets-low-energy diet (LED, 31 subjects) and very low-energy diet (VLED, 13 subjects); isocaloric diets with macronutrient distribution-low-carbohydrate diet (LCD, 48 subjects), ketogenic diet (KD, 23 subjects), and high-protein diet (HPD, 24 subjects); and isocaloric diet without macronutrient distribution-time-restricted eating (TRE, 11 subjects). Participants were dynamically monitored using anthropometric parameters: body mass index (BMI), waist circumference (WC), waist to hip ratio (WHR) and bioelectrical impedance analysis (BIA) using the TANITA Body Composition Analyzer BC-418 MA III (T5896, Tokyo, Japan) at three key intervals-baseline, 6 weeks, and 12 weeks. The following parameters were evaluated: body weight, basal metabolic rate (BMR), percentage of total body fat, trunk fat, muscle mass, fat-free mass, and hydration status.
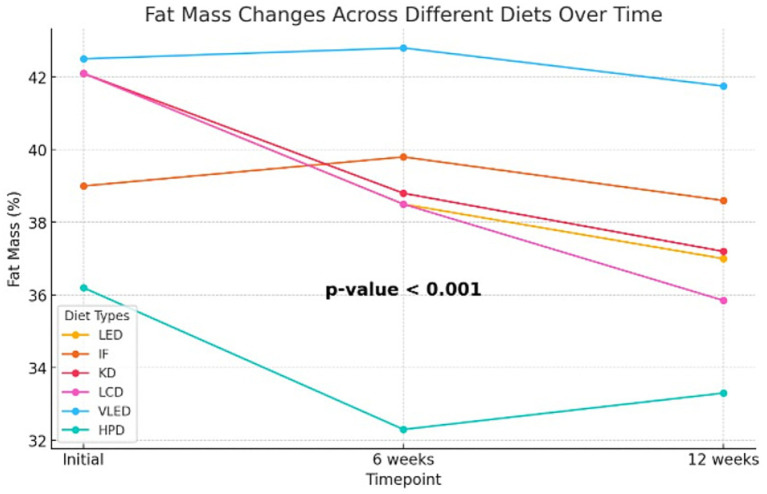
Results: All diets led to weight loss, but differences emerged over time. The TRE model resulted in significantly less weight loss compared to LED at the final follow-up (6.30 kg, p < 0.001), similar to the VLED (4.69 kg, p < 0.001). Isocaloric diets with varied macronutrient distributions showed significant weight loss compared to LED (p < 0.001). The KD reduced waist circumference at both 6 and 12 weeks (-4.08 cm, p < 0.001), while significant differences in waist-to-hip ratio reduction were observed across diet groups at 12 weeks (p = 0.01). Post-hoc analysis revealed significant fat mass differences at 12 weeks, with HPD outperforming IF (p = 0.01) and VLED (p = 0.003). LCD reduced trunk fat at 6 weeks (-2.36%, p = 0.001) and 12 weeks (-3.79%, p < 0.001). HPD increased muscle mass at 12 weeks (2.95%, p = 0.001), while VLED decreased it (-2.02%, p = 0.031). TRE showed a smaller BMR reduction at 12 weeks compared to LED.
Conclusion: This study highlights the superior long-term benefits of isocaloric diets with macronutrients distribution over calorie-restrictive diets in optimizing weight, BMI, body composition, and central adiposity.
Keywords: adipose tissue; bioimpedance metrics; body composition changes; macronutrient distribution; obesity; overweight.
Copyright © 2024 Pescari, Mihuta, Bena and Stoian.
Conflict of interest statement
The authors declare that the research was conducted in the absence of any commercial or financial relationships that could be construed as a potential conflict of interest.
Figures
References
-
- Stewart C. (2024). Obesity in Europe. Available at: https://www.statista.com/topics/9419/obesity-in-europe/ (Accessed July 10, 2024).
-
- Zsálig D, Berta A, Tóth V, Szabó Z, Simon K, Figler M, et al. A review of the relationship between gut microbiome and obesity. Appl Sci. (2023) 13:610. doi: 10.3390/app13010610 - DOI
LinkOut - more resources
Full Text Sources
Miscellaneous