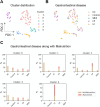
Identification of key factors for malnutrition diagnosis in chronic gastrointestinal diseases using machine learning underscores the importance of GLIM criteria as well as additional parameters
- PMID: 39726873
- PMCID: PMC11670747
- DOI: 10.3389/fnut.2024.1479501
Identification of key factors for malnutrition diagnosis in chronic gastrointestinal diseases using machine learning underscores the importance of GLIM criteria as well as additional parameters
Abstract
Introduction: Disease-related malnutrition is common but often underdiagnosed in patients with chronic gastrointestinal diseases, such as liver cirrhosis, short bowel and intestinal insufficiency, and chronic pancreatitis. To improve malnutrition diagnosis in these patients, an evaluation of the current Global Leadership Initiative on Malnutrition (GLIM) diagnostic criteria, and possibly the implementation of additional criteria, is needed.
Aim: This study aimed to identify previously unknown and potentially specific features of malnutrition in patients with different chronic gastrointestinal diseases and to validate the relevance of the GLIM criteria for clinical practice using machine learning (ML).
Methods: Between 10/2018 and 09/2021, n = 314 patients and controls were prospectively enrolled in a cross-sectional study. A total of n = 230 features (anthropometric data, body composition, handgrip strength, gait speed, laboratory values, dietary habits, physical activity, mental health) were recorded. After data preprocessing (cleaning, feature exploration, imputation of missing data), n = 135 features were included in the ML analyses. Supervised ML models were used to classify malnutrition, and key features were identified using SHapley Additive exPlanations (SHAP).
Results: Supervised ML effectively classified malnourished versus non-malnourished patients and controls. Excluding the existing GLIM criteria and malnutrition risk reduced model performance (sensitivity -19%, specificity -8%, F1-score -10%), highlighting their significance. Besides some GLIM criteria (weight loss, reduced food intake, disease/inflammation), additional anthropometric (hip and upper arm circumference), body composition (phase angle, SMMI), and laboratory markers (albumin, pseudocholinesterase, prealbumin) were key features for malnutrition classification.
Conclusion: ML analysis confirmed the clinical applicability of the current GLIM criteria and identified additional features that may improve malnutrition diagnosis and understanding of the pathophysiology of malnutrition in chronic gastrointestinal diseases.
Keywords: GLIM criteria; decision trees; gastrointestinal diseases; liver cirrhosis; machine learning; malnutrition; supervised and unsupervised learning.
Copyright © 2024 Rischmüller, Caton, Wolfien, Ehlers, van Welzen, Brauer, Sautter, Meyer, Valentini, Wiese, Aghdassi, Jaster, Wolkenhauer, Lamprecht and Bej.
Conflict of interest statement
The authors declare that the research was conducted in the absence of any commercial or financial relationships that could be construed as a potential conflict of interest. The author(s) declared that they were an editorial board member of Frontiers, at the time of submission. This had no impact on the peer review process and the final decision.
Figures


References
-
- Stratton RJ, Hackston A, Longmore D, Dixon R, Price S, Stroud M, et al. Malnutrition in hospital outpatients and inpatients: prevalence, concurrent validity and ease of use of the ‘malnutrition universal screening tool’ (’MUST’) for adults. Br J Nutr. (2004) 92:799–808. doi: 10.1079/BJN20041258, PMID: - DOI - PubMed
LinkOut - more resources
Full Text Sources
Research Materials

