. 2025 Jan 24;53(3):gkae1260.
doi: 10.1093/nar/gkae1260.

Machine learning-optimized targeted detection of alternative splicing

Affiliations

Machine learning-optimized targeted detection of alternative splicing

Kevin Yang et al. Nucleic Acids Res. .

Abstract

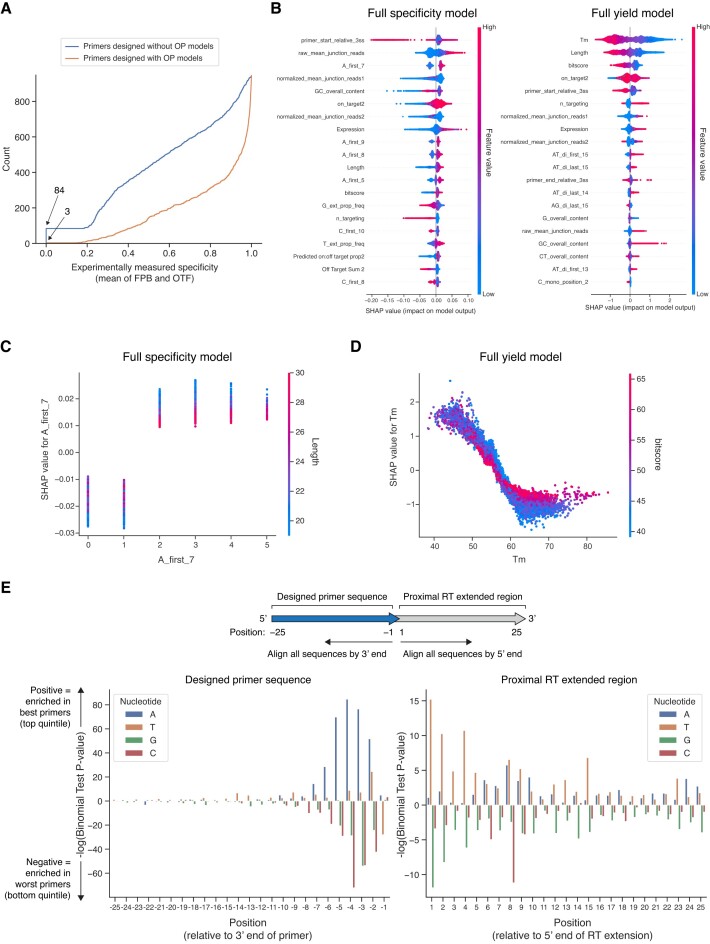
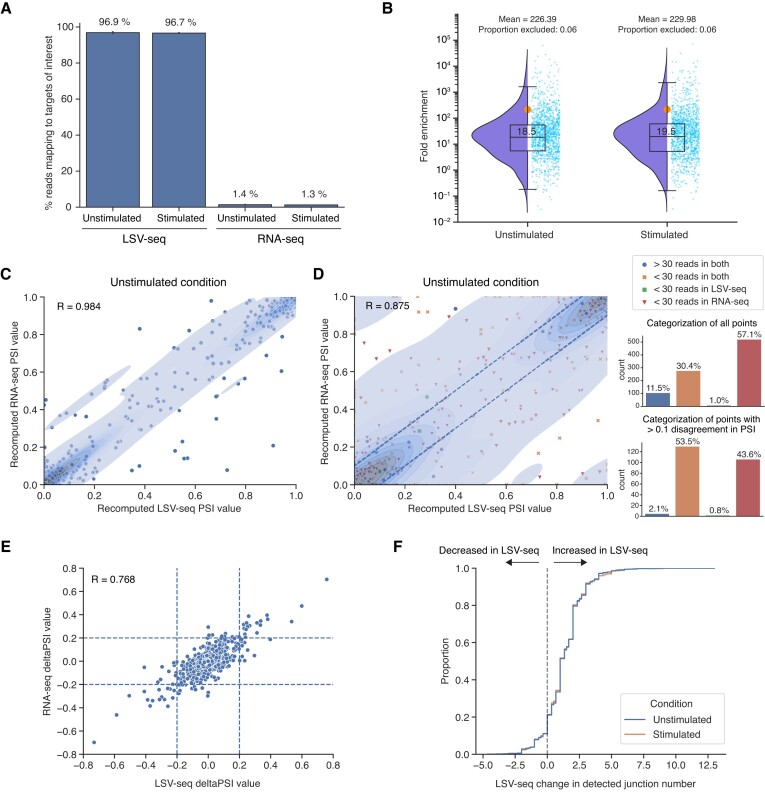
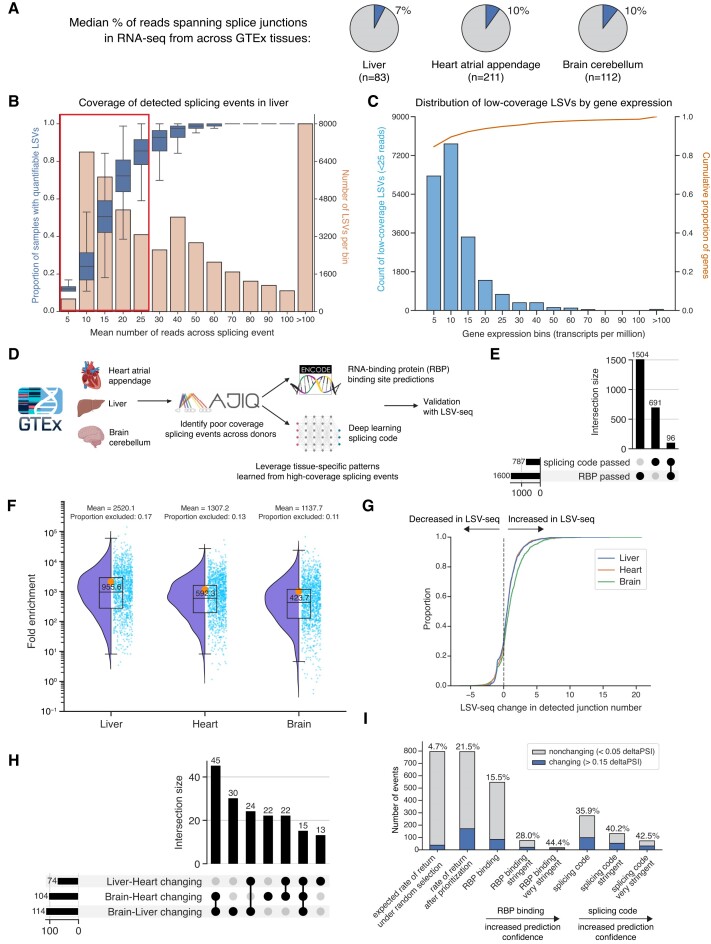
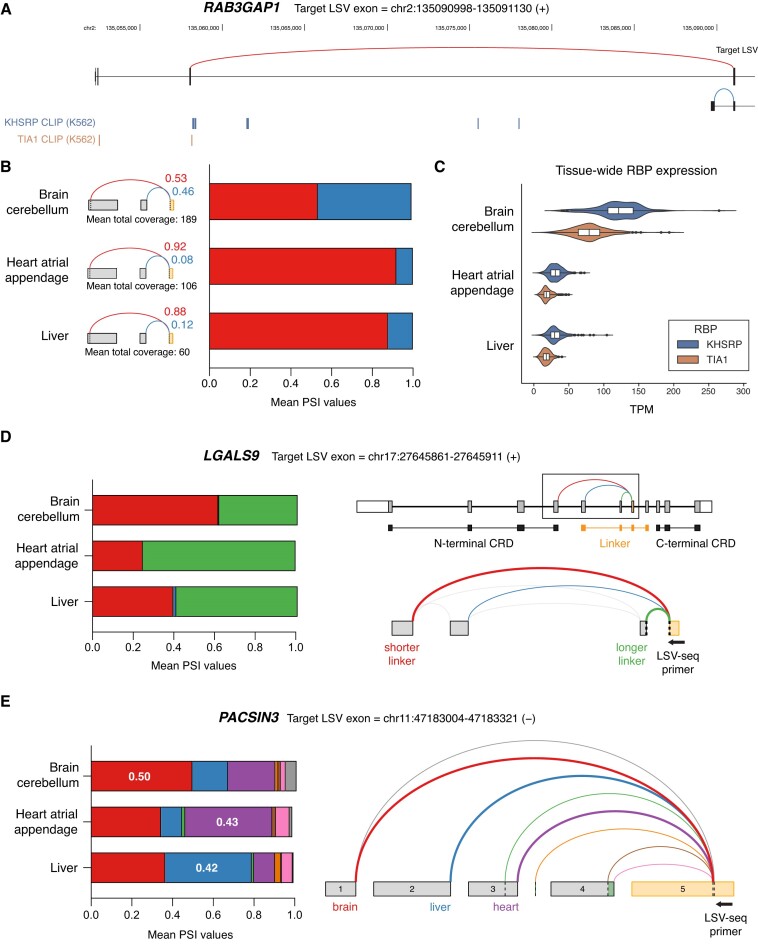
RNA sequencing (RNA-seq) is widely adopted for transcriptome analysis but has inherent biases that hinder the comprehensive detection and quantification of alternative splicing. To address this, we present an efficient targeted RNA-seq method that greatly enriches for splicing-informative junction-spanning reads. Local splicing variation sequencing (LSV-seq) utilizes multiplexed reverse transcription from highly scalable pools of primers anchored near splicing events of interest. Primers are designed using Optimal Prime, a novel machine learning algorithm trained on the performance of thousands of primer sequences. In experimental benchmarks, LSV-seq achieves high on-target capture rates and concordance with RNA-seq, while requiring significantly lower sequencing depth. Leveraging deep learning splicing code predictions, we used LSV-seq to target events with low coverage in GTEx RNA-seq data and newly discover hundreds of tissue-specific splicing events. Our results demonstrate the ability of LSV-seq to quantify splicing of events of interest at high-throughput and with exceptional sensitivity.


Figures

Graphical Abstract
Graphical Abstract
Figure 1.
Figure 1.
Overview of LSV-seq for targeted detection of alternative splicing. (A) LSV-seq enriches for junction spanning reads by performing highly multiplexed RT with primers anchored directly adjacent to target LSVs. In contrast, only a minor fraction of conventional RNA-seq data is informative for splicing quantification, as most reads do not span splice junctions. (B) LSV formulation for splicing events used by the MAJIQ algorithm. Pie chart depicts the percentage of all splice junctions that can be captured by target LSVs, out of the superset of junctions in all source and target LSVs. LSV-seq primers can capture both classical binary splicing events as well as more complex events consisting of annotated and novel junctions. (C) Overview of LSV-seq protocol steps. LSV-seq targeting primers are first annealed to the target RNA using a touchdown protocol to maximize specificity. After first and second strand cDNA synthesis, linear amplification occurs via IVT. The amplified RNA (aRNA) then undergoes another RT step to append the second adapter. The resulting cDNA is then PCR-amplified and sequenced.
Figure 2.
Figure 2.
Primer selection pipeline based on OP models. (A) Overview of specificity and yield metrics derived to infer individual primer performance. (B) Scatter plot depicting the correlation between the specificity metric (mean of FPB and OTF) and the yield metric (Normalized Log Total Amplification). Pearson correlation coefficient is given. (C) Scatter plots depicting the correlation between various individual features thought to be important for determining primer performance and the specificity metric (mean of FPB and OTF) or the yield metric (Normalized Log Total Amplification). Pearson correlation coefficients are given and definitions of individual features are provided in Supplementary Table S2. (D) Overview of processing steps in final primer selection pipeline. Pipeline allows use of either the ‘full’ or ‘lite’ specificity and yield models. (E) Overview of encoded sequence-based features. Individual LSV-seq primer is shown as it would bind to the RNA during RT, along with the proximal region extended by the reverse transcriptase. (F) Cross-validated performance of trained regression models. For each indicated model type, the calculated R2 score and Pearson correlation are given based on held-out 5-fold cross-validation splits conducted independently twice.
Figure 3.
Figure 3.
Experimental validation and interpretation of OP models. (A) Cumulative distribution function for the performance of primers designed with (orange) or without (blue) the OP model, as measured by the specificity metric (mean of FPB and OTF), for the same set of target regions (n = 948). Number of primers with no observed value is noted by the arrowheads. (B) Top features for full OP models. Features are ranked by mean absolute SHAP value magnitude. (C and D) Informative interactions between top features for full models. For each feature indicated, its top most influential interactor by SHAP value magnitude is colored. (E) Bar graph depicting the relative enrichment of specific nucleotides at the first 25 positions in both directions from the 3′ end of the primer, for either the best or lowest performance primer groups, as evaluated by the specificity metric (mean of FPB and OTF). For each position and nucleotide combination, a binomial test was conducted to determine the likelihood of the observed proportion in the top quintile of primers, compared with the proportion in the bottom quintile of primers.
Figure 4.
Figure 4.
LSV-seq recapitulates gold standard RNA-seq measurements and enriches low-coverage RNA-seq measurements. (A) Percent of LSV-seq reads mapping to targeted splicing events of interest (n = 1991) in Jurkat T-cells. Also shown are the percent of reads mapping to the same splicing events in RNA-seq data. (B) Raindrop plot depicting the mean LSV-seq fold enrichment over RNA-seq for unstimulated (n = 3) and stimulated (n = 3) Jurkat T-cell biological replicates per splicing event. The box plot markings represent the 0th to 100th percentiles in increments of 25, with the median marked at the 50th percentile, and the mean denoted as an orange dot. A small proportion of targeted events that did not reach at least five detected reads in either LSV-seq or RNA-seq were excluded from analysis, as indicated above the plots. (C) Scatter plot comparing the PSI values for the same splice junctions in either saturated LSV-seq or RNA-seq datasets (for the unstimulated Jurkat T-cell condition), across only splicing events with at least 30 mean reads of coverage in both (n = 885). Each splicing event is reduced to one splice junction selected at random. Pearson correlation coefficient is given. (D) Scatter plot comparing the PSI values for the same splice junctions in equally downsampled LSV-seq or RNA-seq datasets (for the unstimulated Jurkat T-cell condition), across all splicing events. Only junctions observed in both LSV-seq and RNA-seq are considered when calculating the PSI value. Each splicing event is reduced to one splice junction selected at random. Points that have high disagreement are defined as those having over 0.1 PSI discordance (consisting of points lying outside the dashed lines). The bar plots quantify the coverage categories of all events overall and in events with >0.1 PSI discordance. Pearson correlation coefficient is given. (E) Scatter plot comparing the stimulated–unstimulated deltaPSI values for the same splice junctions in full-depth LSV-seq or RNA-seq datasets, across splicing events with at least 50 reads of coverage in both. All junctions, whether or not they are observed in both, are considered in calculating the deltaPSI values. Dashed lines indicate significant deltaPSI values over 0.2. Pearson’s correlation was calculated by shrinking all points within 0.2 deltaPSI (within the inner box) to 0. (F) Cumulative distribution functions plotting the mean difference in number of junctions detected in equally downsampled LSV-seq and RNA-seq. Positive values indicate more junctions detected in LSV-seq, while negative values indicate more junctions detected in RNA-seq.
Figure 5.
Figure 5.
LSV-seq captures splicing events that are unquantifiable in GTEx RNA-seq datasets. (A) Pie charts illustrating low capture rate of splice junction reads in GTEx RNA-seq datasets across three tissues. (B) For the GTEx liver dataset, histogram in orange illustrating distribution of read coverage for all detectable LSVs, overlaid with box plot in blue illustrating decrease in quantifiability rate at low read coverage. Red box highlights the ∼44% of AS events with 25 or fewer mean reads of coverage that cannot be reliably quantified. (C) For the GTEx liver dataset, histogram in light blue illustrating the distribution of gene expression by TPM for low-coverage LSVs, overlaid with the cumulative distribution function in orange for all expressed genes. (D) Overview of the pipeline used to prioritize low-coverage splicing events which are predicted to be tissue-specific across three different GTEx tissues. Created with Biorender.com. (E) Upset plot depicting the relative overlap of the initial list of candidate events identified by each pipeline. (F) Raindrop plot of the mean fold enrichment of LSV-seq over RNA-seq for the mean splicing event coverage over three technical replicates, compared with the mean coverage over the entire GTEx dataset for each tissue. For each technology, read coverage is normalized by the mean library size. (G) Cumulative distribution functions plotting the difference in the number of mean junctions per splicing event detected across full-depth LSV-seq replicates, compared with the full-depth GTEx RNA-seq dataset, per tissue. Positive values indicate more junctions detected in LSV-seq, while negative values indicate more junctions detected in RNA-seq. (H) Upset plot categorizing changing events captured by LSV-seq. For each changing LSV, we noted which specific pairwise tissue comparison(s) they were changing between. (I) Summary of LSV-seq validation results for the splicing event prioritization pipeline. Different subcategories of events, based on their original prioritization pipeline and prediction confidence, are shown with their relative enrichment for confidently changing events (>0.15 deltaPSI in at least one pairwise comparison), out of total confidently changing and non-changing (<0.05 deltaPSI in all pairwise comparisons) events.
Figure 6.
Figure 6.
Tissue-specific splicing events recovered by LSV-seq. (A) RAB3GAP1 gene track with splice junctions shown as red or blue arcs. Also shown below are ENCODE CLIP IDR binding peaks for the RBPs KHSRP and TIA1. (B) RAB3GAP1 LSV splicing and PSI values across tissues as measured by LSV-seq. (C) Expression of KHSRP and TIA1 RBPs across all samples in GTEx for each of the three tissues. (D) LGALS9 LSV splicing and PSI values across tissues as measured by LSV-seq. Also shown are the gene structure of LGALS9 with annotation of the N/C-terminal CRDs and alternatively spliced linker region, and the VOILA splice graph of the LSV (corresponding to boxed area). (E) Complex LSV splicing and PSI values for PACSIN3 across tissues as measured by LSV-seq. Also shown is the VOILA splice graph with the dominant splice junctions for each tissue represented by thicker arcs. Numbers in PSI graph indicate PSI value for that specific splice junction.

Update of

Similar articles

Cited by

  • Generative modeling for RNA splicing predictions and design.
    Wu D, Maus N, Jha A, Yang K, Wales-McGrath BD, Jewell S, Tangiyan A, Choi P, Gardner JR, Barash Y. Wu D, et al. bioRxiv [Preprint]. 2025 Jan 24:2025.01.20.633986. doi: 10.1101/2025.01.20.633986. bioRxiv. 2025. PMID: 39896553 Free PMC article. Preprint.

References

    1. GTEx Consortium The GTEx Consortium atlas of genetic regulatory effects across human tissues. Science. 2020; 369:1318–1330. - PMC - PubMed
    1. Kahles A., Lehmann K.-V., Toussaint N.C., Hüser M., Stark S.G., Sachsenberg T., Stegle O., Kohlbacher O., Sander C., Caesar-Johnson S.J.et al. .. Comprehensive analysis of alternative splicing across tumors from 8,705 patients. Cancer Cell. 2018; 34:211–224. - PMC - PubMed
    1. Verwilt J., Mestdagh P., Vandesompele J.. Artifacts and biases of the reverse transcription reaction in RNA sequencing. RNA. 2023; 29:889–897. - PMC - PubMed
    1. Davies P., Jones M., Liu J., Hebenstreit D.. Anti-bias training for (sc)RNA-seq: experimental and computational approaches to improve precision. Brief. Bioinform. 2021; 22:bbab148. - PMC - PubMed
    1. Zheng W., Chung L.M., Zhao H.. Bias detection and correction in RNA-sequencing data. BMC Bioinformatics. 2011; 12:290. - PMC - PubMed