. 2025 Feb 8;53(4):gkae1283.
doi: 10.1093/nar/gkae1283.

ProQ-associated small RNAs control motility in Vibrio cholerae

Affiliations

ProQ-associated small RNAs control motility in Vibrio cholerae

Rabea Ghandour et al. Nucleic Acids Res. .

Abstract

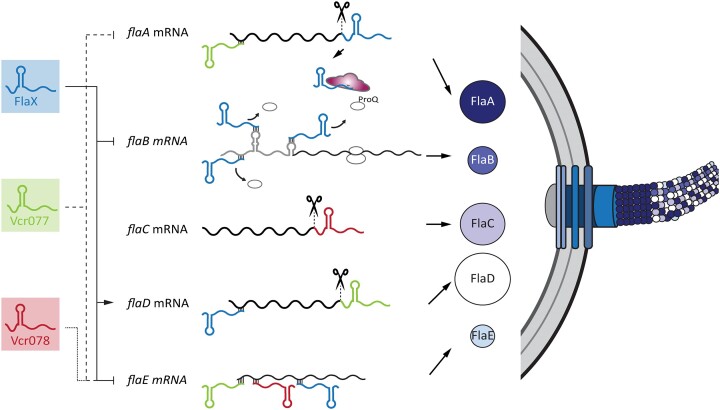
Gene regulation at the post-transcriptional level is prevalent in all domains of life. In bacteria, ProQ-like proteins have emerged as important RNA chaperones facilitating RNA stability and RNA duplex formation. In the major human pathogen Vibrio cholerae, post-transcriptional gene regulation is key for virulence, biofilm formation, and antibiotic resistance, yet the role of ProQ has not been studied. Here, we show that ProQ interacts with hundreds of transcripts in V. cholerae, including the highly abundant FlaX small RNA (sRNA). Global analyses of RNA duplex formation using RIL-Seq (RNA interaction by ligation and sequencing) revealed a vast network of ProQ-assisted interactions and identified a role for FlaX in motility regulation. Specifically, FlaX base-pairs with multiple sites on the flaB flagellin mRNA, preventing 30S ribosome binding and translation initiation. V. cholerae cells lacking flaX display impaired motility gene expression, altered flagella composition and reduced swimming in liquid environments. Our results provide a global view on ProQ-associated RNA duplex formation and pinpoint the mechanistic and phenotypic consequences associated with ProQ-associated sRNAs in V. cholerae.


Figures

Graphical Abstract
Graphical Abstract
Figure 1.
Figure 1.
RIP-seq analysis reveals sRNAs associated with ProQ in Vibrio choleae. V. cholerae expressing chromosomally FLAG-tagged ProQ (3xF; +) and wild-type cells (WT; -) were grown in LB medium to low (OD600 of 0.2) and high cell densities (OD600 of 2.0) and used for ProQ co-immunoprecipitation. (A) Stacked plot of the read distribution of significantly enriched sRNAs with the FLAG-tagged ProQ in comparison to the wild-type control (≥2-fold change and FDR adjusted P-value ≤ 0.05). Mapped reads to each sRNA were normalized to the total reads mapping of all enriched sRNAs. Plots for OD600 of 0.2 and OD600 of 2.0 are shown on left and right side, respectively. Top 20 sRNAs are shown in the insets on each side. Data were collected from three biological replicates. (B) The relative fraction of different RNA classes recovered from WT and FLAG-tagged ProQ (3xF) coIP at OD600 of 0.2 and OD600 of 2.0 are shown. (C) Protein and RNA samples were collected before (input) and after purification (coIP). Top panel: western blot (WB) to verify the expression and enrichment of the ProQ-3xFLAG protein, with RNAP serving as the loading control. Bottom panel: RNA samples were analyzed by northern blotting (NB) to validate the expression and enrichment of specific sRNAs. The 5S rRNA was used as a loading control.
Figure 2.
Figure 2.
FlaX is a ProQ-associated sRNA derived from the 3′-end of the flaA gene. (A) Schematic representation of flax genomic organization. The black arrow indicates the promoter that drives the expression of flaA-flaX. The flaA-flaX primary transcript (1504 nt) is processed thus releasing FlaX (265 nt). (B) V. cholerae wild-type and ΔproQ mutant cells, carrying either a control plasmid (pctrl) or a plasmid containing the proQ gene with its native promoter (pproQ), were grown in LB medium. Total RNA was extracted at various growth stages, and FlaX expression was examined using northern blot analysis. The 5S rRNA served as the loading control. (C) Stability of FlaX was monitored in wild-type cells and ΔproQ mutant cells, carrying either a control plasmid (pctrl) or a plasmid containing the proQ gene (pproQ). Cells were cultivated in LB medium to an OD600 of 1.0 and rifampicin was added to inhibit transcription. Northern blot analysis was performed to measure FlaX level at the specified time points. One representative gel is shown in Supplementary Figure S2B. The signal was quantified and plotted in exponential scale. The RNA half-life was determined by calculating the time point at which 50% of FlaX had degraded (horizontal line). Error bars represent the standard deviation from three biological replicates. (D) V. cholerae ΔflaX strains carrying either a wild-type (rne WT) or a temperature-sensitive (rne TS) RNase E allele, along with the pBAD-flaAX plasmid, were grown in LB medium at 30°C to OD600 of 1.0. Cultures were then divided into two halves, with one half maintained at the permissive temperature (30°C) and the other shifted to the nonpermissive temperature (44°C) for 30 min. flaA-flaX expression was next induced by adding L-arabinose (0.2% final concentration) for 30 min, and FlaX was monitored by northern blot. The solid triangle indicates full-length FlaX transcript, while the open triangles denote the processing intermediates. 5S rRNA served as a loading control.
Figure 3.
Figure 3.
FlaX is a class III gene of the flagella regulon and controls motility. (A) Transcriptional hierarchy of flagella synthesis in V. cholerae. (B) Role of different transcription factors of the flagella regulon on the transcription of FlaX was tested. V. cholerae ΔflrA, ΔflrB, ΔflrC, ΔrpoN and ΔfliA cells harboring either an empty control vector or an overexpression plasmid (pflrA, pflrB, pflrC, prpoN and pfliA) were cultivated in LB medium and RNA samples were collected at OD600 of 1.0. Northern blot analysis was performed to determine FlaX level. 5S rRNA served as loading control. The experiment was performed with three biological replicates. (C) Motility assay on semi-solid LB agar. Inoculum from wild-type cells, ΔproQ mutant cells and ΔflaX mutant cells carrying either a control plasmid (pctrl) or a plasmid containing the deleted gene (pproQ or pflaX) were spotted on 0.2% LB agar plates. After 13 h incubation at 30°C, plates were photographed (top panel). ΔmotX served as a negative control. Bottom panel: Colony areas were measured using ImageJ software and used as proxy for motility. Box plots represent the colony area in pixels. Data were collected from 10 biological replicates and colony areas were normalized to that of ΔmotX. Statistical significance was determined using ordinary one-way ANOVA (Analysis of Variance) with Dunnett’s multiple comparison (*P ≤ 0.05, **P ≤ 0.01, ***P ≤ 0.001, ****P ≤ 0.0001). (D) Heatmap of transcriptome analysis of ΔflaX in comparison to wild-type cells both carrying a control plasmid (pctrl) and in ΔflaX cells carrying a plasmid containing the flaAX genes (pflaAX) in comparison to ΔflaX cells with a control plasmid (pctrl). RNA-seq analysis was performed at OD600 of 0.2 and OD600 of 2.0. Genes involved in flagella synthesis are shown.
Figure 4.
Figure 4.
RIL-seq analysis uncovers the RNA interactome of ProQ in V. cholerae. (A and B) Circos plot displaying top 500 RIL-seq chimeras at low cell density (OD600 of 0.2) (A) and high cell density (OD600 of 2.0) (B). Interaction hubs for sRNAs with highest interactions are highlighted. The first and second chromosomes are represented in dark green and light green, respectively. The Circos plot was created using the Circos component of the Dash Bio package. FlaX is marked in red. (C) Relative distribution of FlaX targets identified in the ProQ RIL-seq based on the number of interactions at low cell density (left) and high cell density (right). The total number of mRNA-FlaX interactions was normalized to 100% (low cell density: 5605 interactions, high cell density: 8894 interactions). The top 20 interaction partners are listed, while the remaining partners are grouped under others. (D) Validation of FlaX targets predicted by RIL-seq. Translational GFP reporter fusions were co-transformed into E. coli Top10 cells along with either a constitutive FlaX expression plasmid or an empty control plasmid. GFP expression was quantified by fluorescence intensity measurements, with fluorophore levels in the control strains normalized to 1. GFP levels were calculated from three biological replicates, with error bars representing the standard deviation. Statistical significance was assessed using Welch’s t-test (ns not significant, *P ≤ 0.05, **P ≤ 0.01). (E) Effect of FlaX on FlaB production was monitored. V. cholerae wild-type and ΔflaX strains each carrying a chromosomal 3xFLAG epitope at the C-terminus of FlaB and harboring the indicated plasmids were cultivated in LB medium. Protein and RNA samples were collected at the indicated growth cell densities. FlaB::3XFLAG protein levels were analyzed by western blot, while FlaX RNA levels were assessed by northern blot. RNAP and 5S rRNA were used as loading controls for the western and northern blots, respectively. Quantification of data from two biological replicates is provided in Supplementary Figure S4C.
Figure 5.
Figure 5.
FlaX base-pairs at three binding sites in the 5′-UTR of flaB mRNA. (A) In vitro structure probing of the 5′ end-labeled flaB 5′-UTR including the first 60 nucleotides of the CDS (0.4 pmol) was performed using RNase T1 (lanes 4–7), RNase V1 (lanes 8–11) and lead (II) (lanes 12–15) in the presence and absence of FlaX sRNA (0, 0.4 pmol, 4 pmol or 10 pmol, respectively). RNase T1 and alkaline (OH) ladders were used to map positions of individual nucleotides, with mapped G-residues indicated relative to the transcription start site (TSS). The potential binding sites for FlaX sRNA are indicated. (B) Secondary structure of the flaB 5′-UTR including the first 60 nucleotides of the CDS, as determined by bioinformatics predictions and revealed by chemical probing shown in (A). The FlaX binding sites are highlighted in blue. The start codon is highlighted in orange and the Shine-Dalgarno (SD) sequence is indicated by an orange line. (CE) Predicted base-pairing interactions between FlaX and flaB mRNA. For flaB mRNA, positions are numbered relative to the start codon, while for FlaX, positions are numbered relative to its start site. The locations of nucleotide substitutions and the compensatory mutations in BS1 (C), BS2 (D) and BS3 (E) are indicated. (FH) Fluorescence intensities were measured for E. coli strains carrying flaB translational GFP reporters, along with either a constitutive FlaX expression plasmid or an empty control plasmid. The fluorescence intensity of strains with the control plasmid was normalized to 1. Point mutations were individually introduced separately into each binding site in the 5′-UTR of flaB, with corresponding compensatory point mutations introduced in the FlaX sRNA (F). Fluorescence intensities for flaB translational GFP reporters with all combinations of double mutations (G) and triple mutations (H) were also measured. Data were collected from three biological replicates, and statistical analyses were conducted using Welch’s t-test (*P ≤ 0.05, **P ≤ 0.01).
Figure 6.
Figure 6.
FlaX inhibits ribosome binding in the 5′-UTR of the flaB mRNA. (A) The secondary structure of 5′-UTR flaB + first 60 nucleotides with FlaX binding sites highlighted in blue. Deletion of the different binding sites are marked in red. Residues that were substituted with cytosines (see panel B) are indicated by a red ‘C’ placed adjacent to each modified position. The start codon and the SD sequence are marked in orange. (B) Translational GFP reporter fusions with deletion mutations in each of the binding sites (as indicated in (A)) were transformed into E. coli Top10 cells. GFP production was measured, with fluorophore levels from the control strain normalized to 1. Error bars represent the standard deviation of three biological replicates. Statistical significance was determined using ordinary one-way ANOVA with Dunnett’s multiple comparison (*P ≤ 0.05, **P ≤ 0.01, ***P ≤ 0.001, ****P ≤ 0.0001). (C and D) In vitro translation of the translational reporter fusion flaB::gfp mRNA. The protein was monitored by western blot at the indicated time points. Translation of single (C), double and triple mutants (D) (indicated in Figure 4C–E) was measured in the presence or absence of FlaX. Data were collected from two biological replicates. (E) Toeprint assay on flaB mRNA (0.2 pmol) in the presence or absence of FlaX. The presence of the 30S ribosomal subunit, the tRNAfMet and the flaB mRNA is indicated. Wild-type and mutant flaX are added in different ratios relative to the flaB mRNA (0.2 pmol, 0.6 pmol, 1 pmol and 2 pmol for flaX WT and 0.2 pmol and 0.6 pmol for flaX M1 + 2 + 3). Position of the 30S initiation complex is indicated, +15, relative to the start codon.
Figure 7.
Figure 7.
FlaX influences flagella assembly and composition. (A and B) V. cholerae ΔflrA and ΔflrA ΔflaX strains carrying either a control plasmid (pctrl) or pBAD-flrA plasmid with inducible promoter, were grown in LB medium at 37°C to OD600 of 1.0. pBAD-driven gene expression was next induced by adding L-arabinose (0.2% final concentration). mRNA levels of flaA (A) and flaB (B) were monitored by quantitative real-time PCR over time: 0, 5, 15, 30 and 60 min. All time points were compared to the pre-induction condition (0 min) and transcript abundance was set to 100. Data were collected from three biological replicates and normalized to the house-keeping gene, recA. (C) Mass spectrometry analysis of FlaA-E flagellin protein levels in wild-type, ΔflaX and ΔflaX pflaX cells. The relative abundances of each flagellin, based on spectral counts, are represented as stacked plot. (D) Motility assay on 0.2% LB agar was performed using inocula from wild-type, ΔflaX and ΔflaXΔflaB mutant cells carrying either a control plasmid (pctrl) or a plasmid with the sRNA (pflaX). The ΔmotX mutant was used as a negative control. Colony areas, measured in pixels via ImageJ, served as a motility proxy. Box plots show normalized colony areas from six replicates. Statistical significance was assessed by one-way ANOVA with Dunnett’s multiple comparisons (*P ≤ 0.05, **P ≤ 0.01, ***P ≤ 0.001, ****P ≤ 0.0001).
Figure 8.
Figure 8.
Model of FlaX-mediated regulation of flagella synthesis in V. cholerae. Flagella filaments in V. cholerae encompass five flagellins, of which only FlaA is a class III gene. FlaX is an sRNA processed by RNase E from the 3′-end of flaA and it is stabilized by ProQ. Its expression is controlled by FlrA, FlrB, FlrC and RpoN rendering it a class III gene as well. FlaX controls tightly the translation of flaB among other flagellins by base-pairing at three different positions in the 5′-UTR. By doing so, FlaX acts to reinforce the hierarchical order between class III and class IV genes. Thereby, FlaX controls motility by fine-tuning the composition of the flagella filament.

Similar articles

Cited by

References

    1. Kanungo S., Azman A.S., Ramamurthy T., Deen J., Dutta S.. Cholera. Lancet. 2022; 399:1429–1440. - PubMed
    1. Guentzel M.N., Berry L.J.. Motility as a virulence factor for Vibrio cholerae. Infect. Immun. 1975; 11:890–897. - PMC - PubMed
    1. Gardel C.L., Mekalanos J.J.. Alterations in Vibrio cholerae motility phenotypes correlate with changes in virulence factor expression. Infect. Immun. 1996; 64:2246–2255. - PMC - PubMed
    1. Butler S.M., Camilli A.. Going against the grain: chemotaxis and infection in Vibrio cholerae. Nat. Rev. Microbiol. 2005; 3:611–620. - PMC - PubMed
    1. Liu Z., Miyashiro T., Tsou A., Hsiao A., Goulian M., Zhu J.. Mucosal penetration primes Vibrio cholerae for host colonization by repressing quorum sensing. Proc. Natl Acad. Sci. U.S.A. 2008; 105:9769–9774. - PMC - PubMed

MeSH terms