. 2025 Jan 24;53(3):gkae1254.
doi: 10.1093/nar/gkae1254.

DNA polymerase zeta can efficiently replicate structures formed by AT/TA repeat sequences and prevent their deletion

Affiliations

DNA polymerase zeta can efficiently replicate structures formed by AT/TA repeat sequences and prevent their deletion

Mili Das et al. Nucleic Acids Res. .

Abstract

Long AT repeat tracts form non-B DNA structures that stall DNA replication and cause chromosomal breakage. AT repeats are abundant in human common fragile sites (CFSs), genomic regions that undergo breakage under replication stress. Using an in vivo yeast model system containing AT-rich repetitive elements from human CFS FRA16D, we find that DNA polymerase zeta (Pol ζ) is required to prevent breakage and subsequent deletions at hairpin and cruciform forming (AT/TA)n sequences, with little to no role at an (A/T)28 repeat or a control non-structure forming sequence. DNA polymerase eta is not protective for deletions at AT-rich structures, while DNA polymerase delta is protective, but not in a repeat-specific manner. Using purified replicative holoenzymes in vitro, we show that hairpin structures are most inhibitory to yeast DNA polymerase epsilon, whereas yeast and human Pol ζ efficiently synthesize these regions in a stepwise manner. A requirement for the Rev1 protein and the modifiable lysine 164 of proliferating cell nuclear antigen to prevent deletions at AT/TA repeats suggests a mechanism for Pol ζ recruitment. Our results reveal a novel role for Pol ζ in replicating through AT-rich hairpins and suggest a role for Pol ζ in rescue of stalled replication forks caused by DNA structures.


Figures

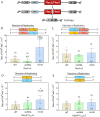
Graphical Abstract
Graphical Abstract
Figure 1.
Figure 1.
The Flex5 (AT)24i (A/T)28 compound microsatellite sequence is reliant on Pol ζ for prevention of deletion in a hairpin and orientation-dependent manner. (A) Schematic diagram for the direct duplication recombination assay (DDRA). Rates of generation of cells that are FOA-resistant (FOAR) and can grow on plates lacking adenine (Ade+) are plotted for strains that are either wild-type (WT) or deleted (Δ) for the indicated gene: RAD30 codes for the catalytic subunit of Pol η; REV3 codes for the catalytic subunit of Pol ζ. (B) Flex5 in orientation 1 (leading strand replicative polymerase first encounters the hairpin structure), (C) Flex5 in orientation 2 (leading strand replicative polymerase first encounters the poly(A/T) sequence), (D) (A/T)28 tract in orientation 1 (T28 on leading strand template) and (E) (A/T)28 tract in orientation 2 (A28 on leading strand template). Individual data points each represent the DDRA rate estimated by the method of the median for one 10 plate assay; values are listed in Supplementary Table S1. The numbers within or above the bars represent the mean value of the rate. Standard error of the mean (SEM) is shown. For each figure, the fold increase/decrease and statistical significance of the change of the mutant strains over the WT are indicated. An unpaired, two-tailed, non-parametric Mann–Whitney test was used to calculate the statistical significance of the differences in rates. *P< 0.05, **P< 0.01, ***P< 0.001. ns = non-significant. P values are listed in Supplementary Table S1.
Figure 2.
Figure 2.
Comparative biochemical analysis of yeast Pol ϵ, Pol δ and Pol ζ holoenzymes highlights the ability of Pol ζ to synthesize through AT hairpins. (A) Thumbnail images of representative gels showing polymerase primer extension reaction products using yeast holoenzymes on the Flex5 ssDNA templates in the presence of PCNA and RFC for both orientations (R3A; top panel and R3B; bottom panel). Larger images of full gels are shown in Supplementary Figure S2. Sequence of each primer-template is shown. The extent of the Flex5 sequence is indicated to the left of the gel. Repetitive mono- and dinucleotide sequence regions of Flex5 are bordered by horizontal black lines and are labeled alongside the gels. For both gels, the top label above the gel indicates the polymerase used to perform the synthesis. The middle label indicates the polymerase: DNA template molar ratio which is either constant (indicated by a number) or increases from left to right (open triangles; 2.5: 1–5: 1 for Pols ϵ and δ; 5: 1–20: 1 for Pol ζ). The bottom label indicates reaction time which is either constant at 15 min (filled rectangle) or increases from left to right (filled triangles; 15–30 min for all polymerases). – Pol, negative control; % Hyb, positive control; TACG, sequencing ladder of ssDNA, with template sequence indicated. (B) The human Flex5 sequences were inserted into the yeast LYS2 locus on chromosome II in two orientations. The schematic shows the predicted sequence of the leading/lagging strands for Flex5 orientation 1. Labels R3A and R3B correspond to ssDNA templates used in purified polymerase reactions in panel (A). Gel panels show an enlarged view of the gels in panel (A) from 10 nt preceding the Flex5 compound microsatellite through the end of the Flex5 insert. Horizontal black lines separate specific sequence regions as in panel (A). Solid circles next to gels indicate regions of Pol δ or Polϵ inhibition caused by the (AT)24i hairpin and differences in pausing as compared to Pol ζ. Panels are arranged to show Pol ϵ/Pol ζ synthesis on the predicted leading strand sequence (R3B) and Pol δ/Pol ζ on the predicted lagging strand sequence (R3A) of Flex5 orientation 1. Vertical black lines show where the sequencing ladder was spliced next to the polymerase reaction lanes. (C) The schematic shows the predicted sequence of the leading/lagging strands for Flex5 orientation 2, with labels R3A and R3B corresponding to ssDNA templates used in purified polymerase reactions in panel (A). Gel panels show same enlarged view as in (B) and are arranged to display Pol ϵ/Pol ζ synthesis on the predicted leading strand sequence (R3A) and Pol δ/Pol ζ on the predicted lagging strand sequence (R3B) of Flex5 orientation 2.
Figure 3.
Figure 3.
Pol ζ prevents deletions at cruciform forming Flex1 (AT)34 sequences, and Pol δ is universally protective. DDRA rates for (A) Flex1 (AT)34 sequence in WT and indicated polymerase subunit mutants, (B) a 386 bp no repeat control sequence in the same strains as panel (A). (C) DDRA rates for the Flex1 (AT)34 sequence in WT and polymerase subunit mutants or strains containing the POL3 gene under a downregulatable doxycycline promoter; expression of Pol3, the catalytic subunit of Pol δ, is repressed in the presence of doxycycline (+Dox). (D) DDRA rates for a 386 bp no repeat control sequence in the same strains as panel (C). Individual data points each represent the rate of generation of FOAR Ade+ cells estimated by the method of the median for one 10 plate assay; values are listed in Supplementary Table S1. The numbers within or just above the bars represent the mean value of the rate. SEM is shown. The fold increase or decrease and statistical significance of the change of the various mutants over the corresponding WT (no bracket) or the comparison indicated by the bracket are indicated. An unpaired, two-tailed, non-parametric Mann–Whitney test was used to calculate the statistical significance of the differences in rates. *P< 0.05, **P< 0.01, ***P < 0.001. ns = non-significant. For graph (B) there was no statistical difference in the rates for any of the mutants of the no-repeat control with respect to that of the WT. P-values are found in Supplementary Table S1.
Figure 4.
Figure 4.
Pol ζ efficiently replicates hairpin-forming Flex1 (AT)34 sequences whereas Pol ϵ is severely stalled at the base of the repeat. (A) Representative polymerase primer extension reaction products by yeast Pol ϵ, δ and ζ holoenzymes using the Flex1 ssDNA template in the presence of PCNA and RFC, at polymerase: DNA template molar ratios shown in open rectangles. Filled triangles indicate an increase in reaction time from 15–30 min. Three replicate reactions for each polymerase are shown. Black lines demarcate the (AT)34 sequence; the 10 nucleotides preceding the (AT)34 sequence is indicated. Thick arrows show the base of the two predicted Flex1 hairpin structures (1 and 2; Supplementary Figure S5A). – Pol, negative control; % Hyb, positive control; TACG, sequencing ladder of (AT)34 ssDNA, with sequence of template indicated. Asterisks denote those reaction lanes quantified for graphs shown in panels (C) and (D). An enlarged view of the (AT)34 region is shown to the right. (B) Densitometer scans of representative reaction products for each polymerase along the Flex1 sequence. Base of (AT)34 repeat indicated by a red vertical line. Polymerase synthesis proceeds from bottom of graph to top. (C, D) Quantification of termination probabilities within the 10 nt region preceding the (AT)34 hairpin (C) or within the (AT)34 repeat (D) for each of the three polymerases. Only reactions that showed similar synthesis [30% ≤ x ≤ 65% synthesis from 10 nt preceding (AT)34 up to well] were included in the quantification (see Supplementary Table S5 for values). Data points are independent reactions; columns and error bars indicate mean and SEM. Statistical differences were determined using ordinary one way ANOVA with Tukey’s multiple comparisons for (C) and the Brown–Forsythe and Welch ANOVA with Dunnett’s T3 multiple comparisons for (D). ns, not significant; *P< 0.05, ****P< 0.0001. (E) Representative polymerase primer extension reaction products by human Pol ζ holoenzyme in the presence of PCNA and RFC at indicated polymerase: DNA molar ratios. Filled triangles indicate an increase in reaction time from 15–60 min. TA, sequencing ladder of (AT)34 ssDNA, with sequence of template indicated. Termination probability within the 10 nt region preceding (AT)34 for the reaction in which synthesis fell within 30% ≤ x ≤ 65% is shown. See Supplementary Figure S5D for full gel of reaction products.
Figure 5.
Figure 5.
Effect of replication stress by HU on rates of microsatellite deletion. DDRA rates for strains with or without various repeat containing sequences on yeast chromosome II, and their corresponding REV3 deleted mutants (rev3Δ), in the absence and presence of exogenous replication stress by growing colonies on plates containing 50 mM HU. For each strain the fold increase and statistical significance of the change in DDRA rates in the absence and presence of HU are indicated. Individual data points each represent the rate estimated by the method of the median for one 10 plate assay; values are listed in Supplementary Table S1. The numbers just above the bars represent the mean value of the rate. SEM is shown. An unpaired, two-tailed, non-parametric Mann–Whitney test was used to calculate the statistical significance of the differences in rates. *P< 0.05, **P< 0.01, ***P< 0.001 and ****P< 0.0001. ns = non-significant. Exact p values are found in Supplementary Table S1.
Figure 6.
Figure 6.
PCNA K164 modification and Pol ζ work together in the same pathway to prevent deletion of the cruciform-forming Flex1 (AT)34 sequence. DDRA data for (A) Flex1(AT)34 sequence in WT and PCNA (Pol30) modification-related mutants, (B) a 386 bp no repeat control sequence in the same strains as A. Individual data points each represent the rate estimated by the method of the median for one 10 plate assay; values are listed in Supplementary Table S1. The numbers within or just above the bars represent the mean value of the rate. SEM is shown. The fold increase or decrease and statistical significance of the change of the various mutants compared to the corresponding WT are indicated. An unpaired, two-tailed, non-parametric Mann–Whitney test was used to calculate the statistical significance of the differences in rates. *P< 0.05, **P< 0.01, ***P< 0.001. ns = non-significant. P-values are found in Supplementary Table S1.
Figure 7.
Figure 7.
A proposed model for replication through hairpin forming repeat sequences by polymerase zeta. During replication, an encounter of Pol ϵ with an AT or TA hairpin structure inhibits leading strand synthesis, leading to dissociation of the Pol ϵ enzyme and replisome uncoupling. The persistent stall favors PCNA ubiquitylation and recruitment of Rev1, which in turn recruits the Pol ζ holoenzyme. Pol ζ synthesizes into the hairpin base and completes synthesis through the structure. This could occur at a stalled replication fork (left panel) or in a post-replicative gap-filling mechanism after repriming by Pol α (right panel). On the lagging strand, RPA melting of the hairpin structure or the better ability of Pol δ to enter the hairpin base may allow synthesis through the hairpin (shown), or Pol ζ may contribute to prevent a lagging strand gap or fill it post-replication (not shown).

Similar articles

Cited by

References

    1. Brown R.E., Freudenreich C.H.. Structure-forming repeats and their impact on genome stability. Curr. Opin. Genet. Dev. 2021; 67:41–51. - PMC - PubMed
    1. Kaushal S., Freudenreich C.H.. The role of fork stalling and DNA structures in causing chromosome fragility. Genes Chromosomes Cancer. 2019; 58:270–283. - PMC - PubMed
    1. Shastri N., Tsai Y.C., Hile S., Jordan D., Powell B., Chen J., Maloney D., Dose M., Lo Y., Anastassiadis T.et al. .. Genome-wide identification of structure-forming repeats as principal sites of fork collapse upon ATR inhibition. Mol. Cell. 2018; 72:222–238. - PMC - PubMed
    1. Bacolla A., Tainer J.A., Vasquez K.M., Cooper D.N.. Translocation and deletion breakpoints in cancer genomes are associated with potential non-B DNA-forming sequences. Nucleic Acids Res. 2016; 44:5673–5688. - PMC - PubMed
    1. Kato T., Kurahashi H., Emanuel B.S.. Chromosomal translocations and palindromic AT-rich repeats. Curr. Opin. Genet. Dev. 2012; 22:221–228. - PMC - PubMed

MeSH terms

LinkOut - more resources