. 2025 Jan 24;53(3):gkae1264.
doi: 10.1093/nar/gkae1264.

The ATPase activity of yeast chromosome axis protein Hop1 affects the frequency of meiotic crossovers

Affiliations

The ATPase activity of yeast chromosome axis protein Hop1 affects the frequency of meiotic crossovers

Kshitiza M Dhyani et al. Nucleic Acids Res. .

Abstract

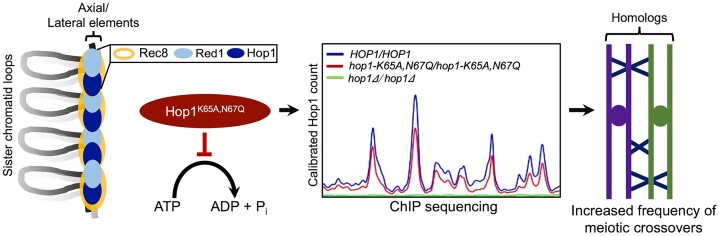
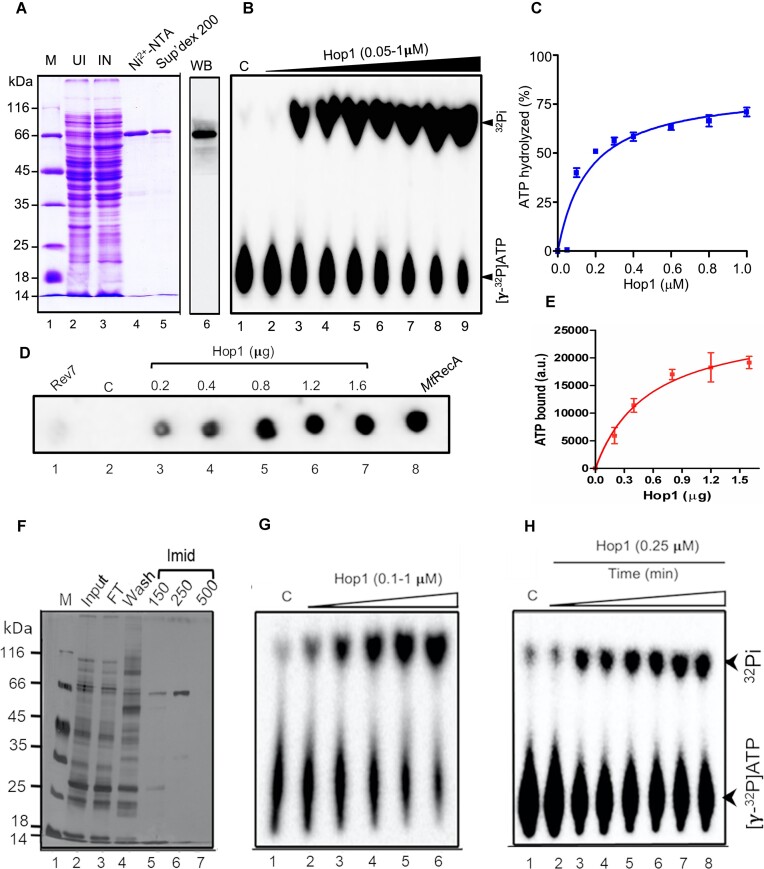
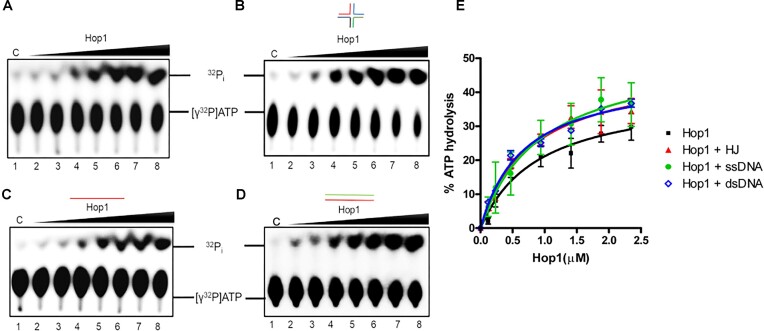
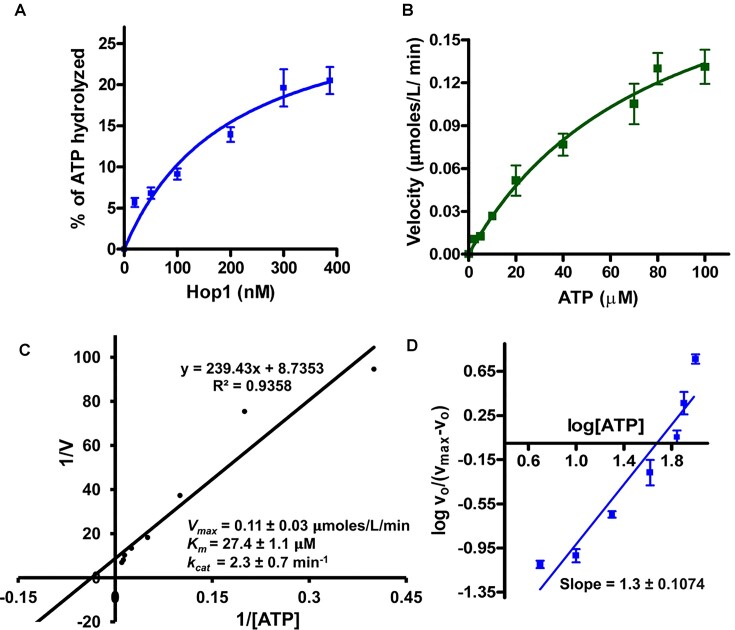
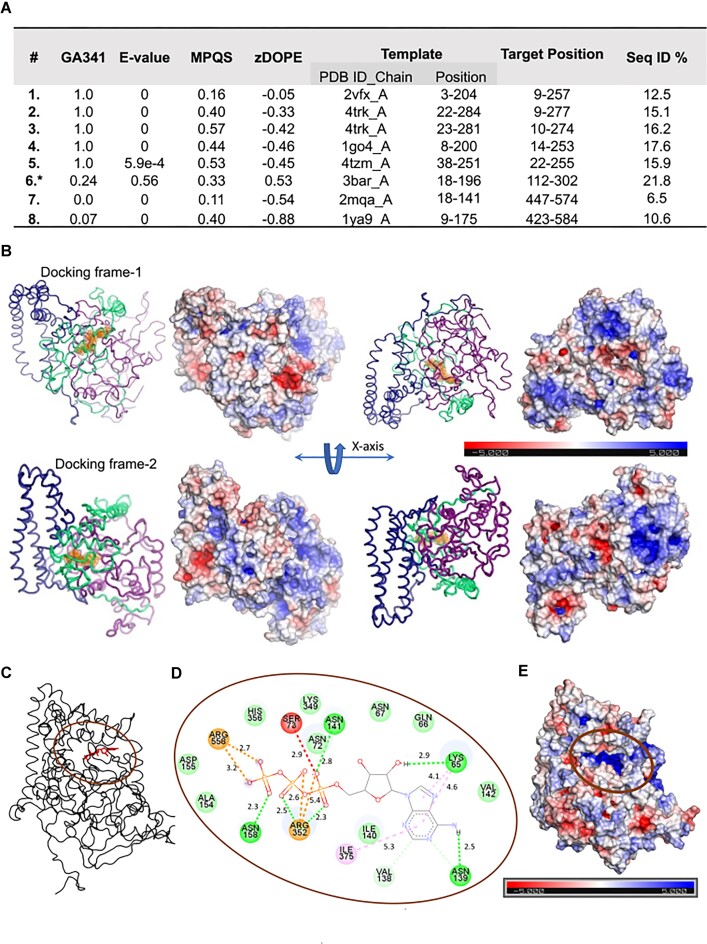
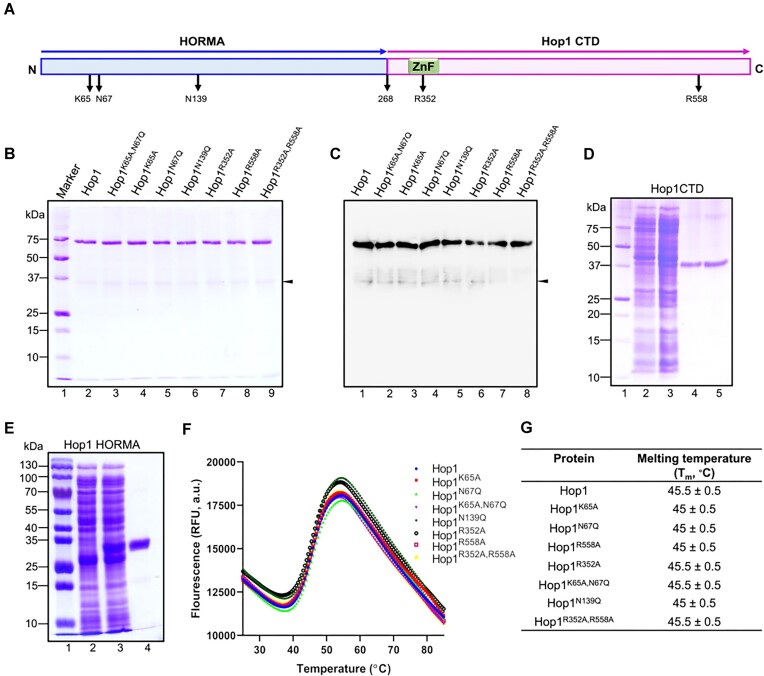
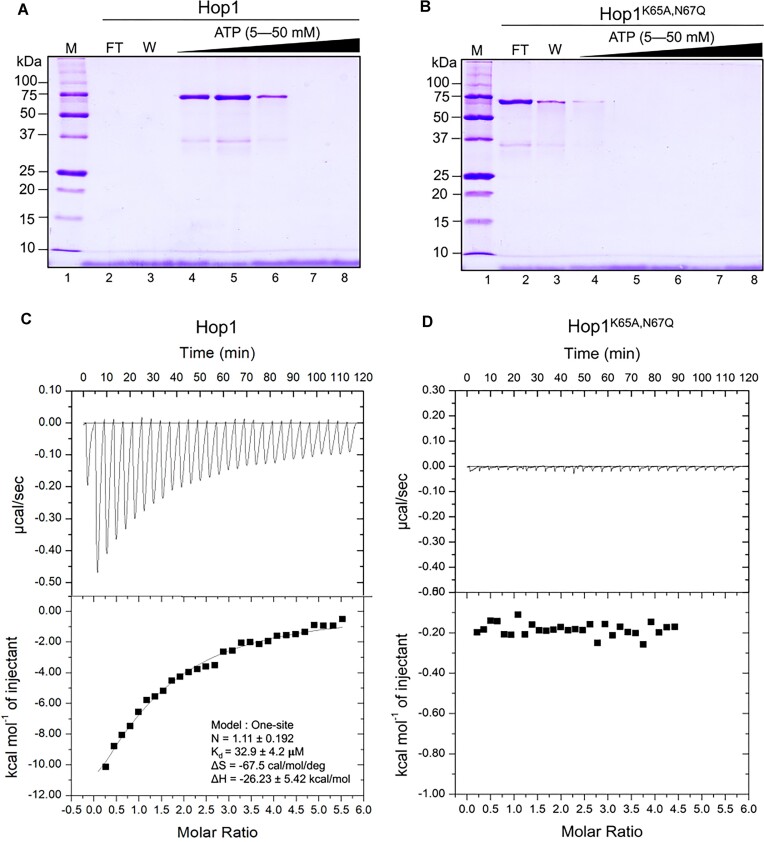
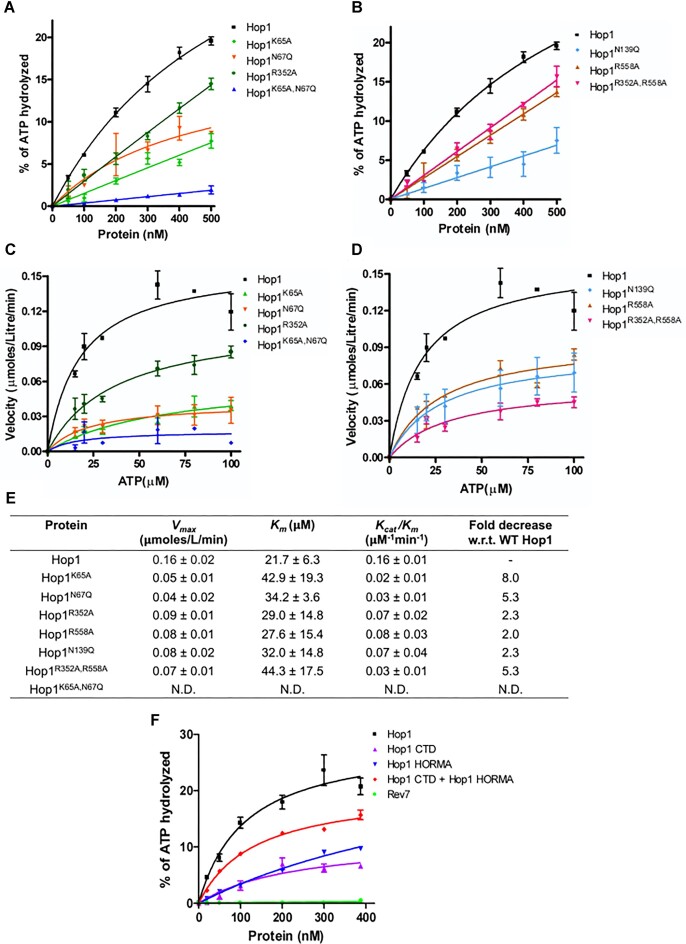
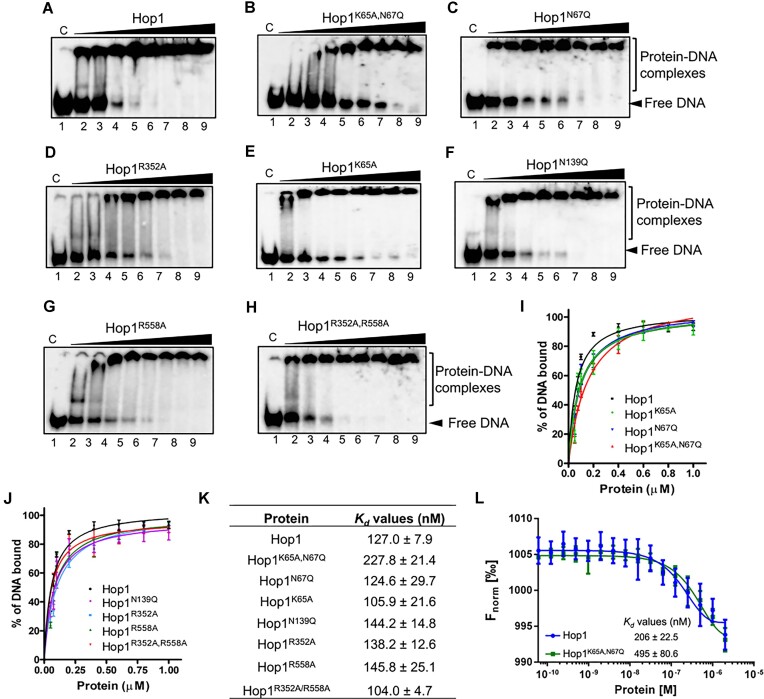
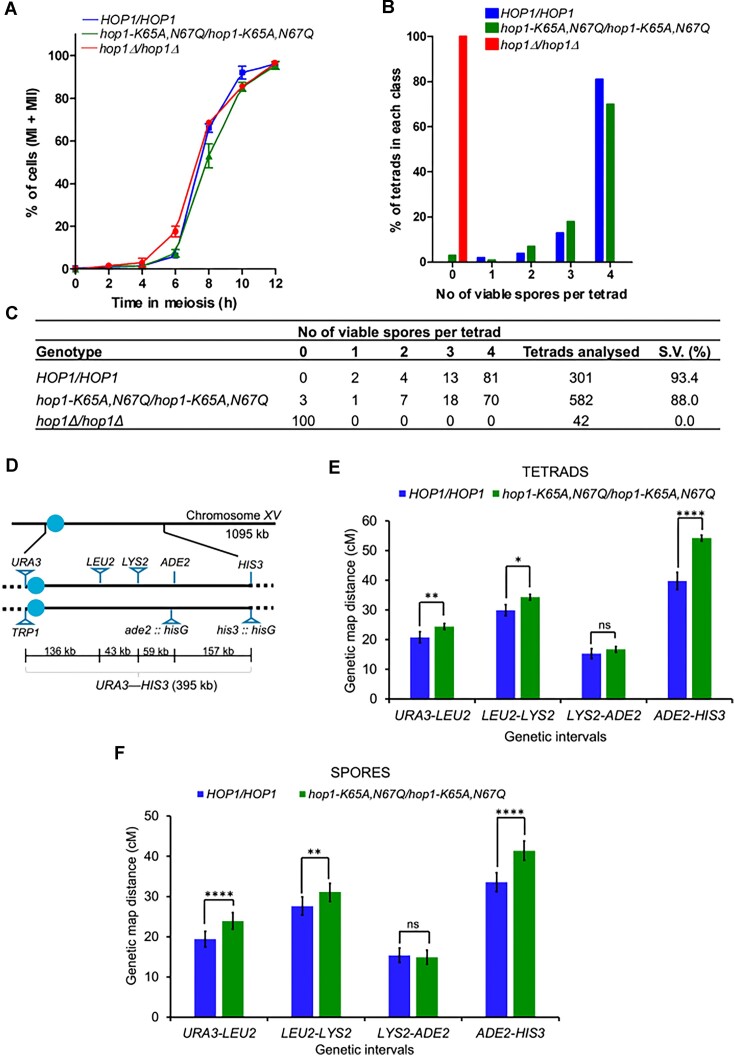
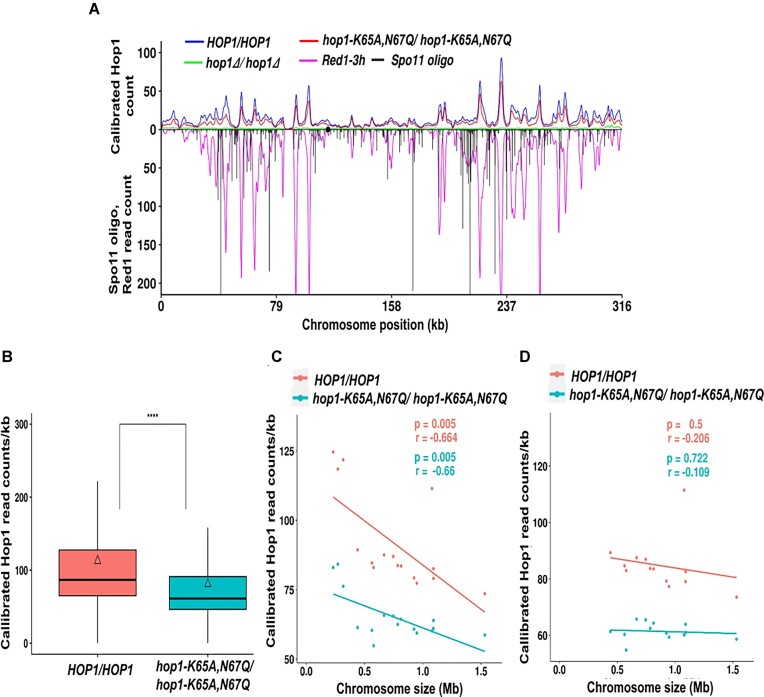
Saccharomyces cerevisiae meiosis-specific Hop1, a structural constituent of the synaptonemal complex, also facilitates the formation of programmed DNA double-strand breaks and the pairing of homologous chromosomes. Here, we reveal a serendipitous discovery that Hop1 possesses robust DNA-independent ATPase activity, although it lacks recognizable sequence motifs required for ATP binding and hydrolysis. By leveraging molecular docking combined with molecular dynamics simulations and biochemical assays, we identified an ensemble of five amino acid residues in Hop1 that could potentially participate in ATP-binding and hydrolysis. Consistent with this premise, we found that Hop1 binds to ATP and that substitution of amino acid residues in the putative ATP-binding site significantly impaired its ATPase activity, suggesting that this activity is intrinsic to Hop1. Notably, K65A and N67Q substitutions in the Hop1 N-terminal HORMA domain synergistically abolished its ATPase activity, noticeably impaired its DNA-binding affinity and reduced its association with meiotic chromosomes, while enhancing the frequency of meiotic crossovers (COs). Overall, our study establishes Hop1 as a DNA-independent ATPase and reveals a potential biological function for its ATPase activity in the regulation of meiotic CO frequency.


Figures

Graphical Abstract
Graphical Abstract
Figure 1.
Figure 1.
Hop1 has intrinsic ATPase activity. (A) A Coomassie blue-stained SDS-PAGE gel showing analysis of protein samples at different stages of purification of Hop1. Lane 1, molecular weight standards; lane 2, whole-cell lysate from uninduced cells (25 μg); lane 3, whole-cell lysate from induced cell lysates (25 μg); lane 4, eluate from Ni2+-NTA affinity column (5 μg); lane 5, eluate from Superdex 200 column (3 μg); lane 6, western blot analysis of purified Hop1 (fraction 5) using anti-Hop1 antibodies. (B) A thin-layer chromatogram showing [γ-32P]ATP hydrolysis by Hop1 in a concentration-dependent manner. Increasing concentrations of Hop1 were incubated with 20 μM cold ATP (and 200 pM [γ-32P]ATP as a tracer) at 37°C for 40 min. The reaction products were analyzed by TLC. (C) Graph shows quantification of the ATPase activity (n = 3). (D) Hop1 binds to [α-32P]ATP. The reaction mixtures containing indicated proteins were incubated with 0.5 nM [α-32P]ATP. Samples were analyzed using a nitrocellulose filter binding assay. Lane 1, S. cerevisiae Rev7 (1 μg); lane 2, No protein (control). lanes 3–7, various concentrations of Hop1 (0.2, 0.4, 0.8, 1.2 and 1.6 μg), and lane 8, MtRecA (0.4 μg). (E) The graph shows the quantification of [α-32P]ATP-cross-linked species (n = 3). (F) Purification of Hop1 expressed in the cell-free translation system. Samples at various stages of purification of Hop1 were analyzed by SDS-PAGE and staining with Coomassie blue. Lane 1, molecular weight standards; lane 2, 5 μg protein of the translation mixture (input); lane 3, Ni2+-NTA column flow-through (5 μg); lane 4, column wash with 20 mM imidazole (5 μg). Lanes 5–6, protein eluted with 150 and 250 mM imidazole. Lane 7, elution with 500 mM imidazole (Imid). (G) A thin-layer chromatogram showing Hop1 made in the cell-free protein synthesis system catalyses [γ-32P]ATP hydrolysis. Various concentrations of Hop1 (0.1–1 μM) were incubated with 20 μΜ cold ATP (and 200 pM [γ-32P]ATP as a tracer) for 30 min at 37°C. (H) A thin-layer chromatogram showing time course of ATP hydrolysis by Hop1 from the cell-free protein synthesis system. Lane1, reaction performed in the absence of Hop1. Lanes 2–8 correspond to increasing reaction times as follows: 5, 10, 15, 20, 30, 45 and 60 min, respectively. The reaction products were analyzed as in panel (B). (B, G and H) 2 μl from each reaction mixture was spotted on a TLC plate and developed in a solution containing 1 M HCOOH, 0.5 M LiCl and 1 mM EDTA. The TLC plates were dried and imaged using a Fuji FLA-9000 phosphorimager.
Figure 2.
Figure 2.
ATPase activity of Hop1 is not coupled to its DNA binding activity. (A) ATPase activity in the absence of DNA. (B–D) As in (A) but in the presence of 500 nM of the HJ, ssDNA and dsDNA, respectively. The reaction mixtures contained 50 μM cold ATP (and 200 pM [γ-32P]ATP as a tracer) in the absence (lane 1) or presence of 0.12, 0.23, 0.47, 0.94, 1.41, 1.88 and 2.35 μM Hop1 (lanes 2–8), respectively. (E) Quantitative analysis of ATP hydrolysis (mean and SD for n = 3) in the absence or presence of different DNA substrates as a function of various concentrations of Hop1.
Figure 3.
Figure 3.
Kinetic analysis of Hop1 ATPase activity. (A) ATPase activity as a function of Hop1 concentration. (B) The reaction velocity is plotted as a function of ATP concentration. (C) Lineweaver–Burk plot of rate of Hop1 catalyzed ATP hydrolysis as a function of ATP. (D) Hill plot showing the rate of ATPase activity at different ATP concentrations. A nonlinear regression analysis was performed in panels (A) and (B) using GraphPad Prism software (version 5.0). Linear regression analysis was performed in panels (C) and (D). The error bars represent standard deviation for three independent experiments.
Figure 4.
Figure 4.
In silico prediction algorithms, molecular docking and MD simulations reveal a putative ATP-binding site in Hop1. (A) Quality statistics of template fragments used to construct the Hop1 model. The 6 with an asterisk (*) corresponds to a template with a poor match, but it is included for guiding the modeling of the extended loop regions. (B) Cartoon diagram showing two Hop1 models (frame 1 and frame 2) selected from all-atom MD simulation for docking ATP. The segments 1–277, 278–422 and 423–605 are marked in deep purple, forest green and deep blue, respectively. The electrostatic surface is shown adjacent to models in the same orientation for comparison. The protein view is shown from both faces after rotation around the X-axis by 180°. The position of the top-ranked docked-ATP ligand is shown as orange spheres. Note that although the docking modes of ATP in frame 1 and 2 differ, they remain adjacent. (C) Docking simulations of the Hop1-ATP complex (frame 1). The location of the bound ATP after 200 ns MD simulation. (D) Schematic diagram showing the ATP binding site and various interactions (dashed lines) between ATP and Hop1. The oval indicates the primary region of interest. The acceptor atoms in the ATP molecule are indicated, and the distance in Å is marked for each dashed line between a donor–acceptor. In regard to a stacking interaction, the dashed line points to the corresponding location. (E) The surface view of the docking orifice of the ATP ligand. The electrostatic surface potential at the docking site is colored deep blue. Panels (C) and (E) are drawn in the same orientation. The electrostatic surface potential was calculated using the APBS plugin within the PyMol software (https://pymol.org), which was also used to produce all cartoon diagrams of the structure.
Figure 5.
Figure 5.
Purification, SDS-PAGE analysis and thermal stability of WT Hop1 and its variants carrying amino acid substitutions in the putative ATP binding site. (A) Schematic diagram of Hop1 domain structure: an N-terminal HORMA domain, and a C-terminal domain (Hop1-CTD) including the zinc finger motif. The aa residues potentially involved in ATP binding/hydrolysis are indicated below the linear schematic diagram. (B) Shown is a Coomassie blue-stained SDS-PAGE gel showing the homogeneity of purified WT and Hop1 variants. Lane 1, molecular weight standards. Lanes 2–9, SDS-PAGE analysis of purified WT Hop1 and its variants (5 μg protein in each lane). (C) Western blot analysis of WT Hop1 and its variants using anti-Hop1 antibodies. The closed arrowheads in panels (B) and (C) denote the Hop1 degradation product. (D) A Coomassie blue-stained SDS-PAGE gel of protein samples from various stages of Hop1-CTD purification. Lane 1, molecular weight standards; lane 2, whole-cell lysate from uninduced cells (25 μg protein); lane 3, whole-cell lysate from induced cells (25 μg protein); lane 4, eluate from Ni2+-NTA affinity column (4 μg protein); lane 5, eluate from Superdex 200 column (4 μg protein). (E) A Coomassie blue-stained SDS-PAGE gel of protein samples from various stages of purification of Hop1 HORMA domain. Lane 1, molecular weight standards; lane 2, whole-cell lysate from uninduced cells (30 μg protein); lane 3, whole-cell lysate from induced cells (30 μg protein); lane 4, eluate from Ni2+-NTA affinity column (5 μg). (F) Thermal denaturation profiling of WT Hop1 and its variants. (G) Tm values of WT Hop1 and its variants. The data are presented as the mean ± SD from three independent experiments.
Figure 6.
Figure 6.
Wild-type Hop1, but not its Hop1K65A,N67Q variant, binds ATP. (A) WT Hop1 bound to ATP-agarose resin could be eluted with ATP. (B) The Hop1K65A,N67Q variant does not bind to ATP-agarose. (A and B) The indicated samples were analyzed by SDS-PAGE and visualized by staining with Coomassie blue. Lane 1 (M), standard molecular markers; lane 2 (FT), flow-through; lane 3 (W), wash fraction; lanes 4–8, fractions eluted with 5, 10, 20, 30 and 50 mM ATP, respectively. (C) A representative ITC thermogram of the WT Hop1-ATP complex formation; heats of injection are shown on the top panel. The thermodynamic parameters obtained are indicated in the inset. (D) A representative ITC thermogram of the complex formation between Hop1K65A,N67Q variant and ATP; heats of injection are shown on the top panel. All injections were performed at 240 s intervals. The experiments were performed as described in the ‘Materials and methods’ section. Data shown are representative of two independent titrations.
Figure 7.
Figure 7.
Amino acid substitutions in the putative ATP binding site of Hop1 impair ATP hydrolysis to varying degrees. (A and B) ATPase activity of purified WT Hop1 and its variants was determined as a function of protein concentration. Various concentrations (50, 100, 200, 300, 400 and 500 nM) of WT Hop1 and its variants were individually incubated with 100 μM of ATP at 37°C for 80 min. (C and D) The rate of ATP hydrolysis WT Hop1 and its variants (50 nM) as a function of ATP concentration (0, 15, 20, 30, 60, 80 and 100 μM ATP). The data presented for WT Hop1 in (C) are reused in (D). (E) The kinetic parameters for ATP hydrolysis by WT Hop1 and its variants. (F) Mixing of the N- and C-terminal domains of Hop1 partially restored ATPase activity. The assay was performed as in (A), but in the absence or presence of 20, 50, 100, 200, 300 and 387 nM of WT Hop1, or equal concentrations of N- and C-terminal domains of Hop1. S. cerevisiae Rev7 was used as a negative control at the same concentration. The data were assessed using nonlinear regression analysis in GraphPad Prism (version 5.0 software). Error bars represent standard deviation across three independent experiments.
Figure 8.
Figure 8.
The K65A/N67Q substitutions reduce the HJ binding affinity of Hop1. (A) A representative gel image showing the HJ binding activity of WT Hop1. Lane 1, HJ alone. Lanes 2–9, reactions performed with 0.5 nM of 32P-labeled HJ and various concentrations of WT Hop1 (0.05, 0.075, 0.1, 0.2, 0.4, 0.6, 0.8 and 1 μM). (B–H) Representative gel images from PAGE analysis demonstrating the HJ-binding activities of different variants of Hop1. Experiments were done as discussed above, but with variant Hop1 proteins. In (A–H) C denotes the reference control. The filled triangle on the top of each gel image indicates various concentrations of WT Hop1 or its variants. (IandJ) Quantitative analysis of EMSA results.The data are from three independent experiments. The data presented for WT Hop1 in (I) is reused in (J). (K) The apparent Kd values for interaction of WT Hop1 and its variants with the HJ. (L) MST isotherms for the binding of WT Hop1 and Hop1K65A,N67Q variant to the 5′-6-FAM labeled HJ. The ± signs shown represent standard error of the mean (SEM). The data were analyzed by nonlinear regression using GraphPad Prism software (version 5.0 software). Error bars represent standard deviation (n = 3).
Figure 9.
Figure 9.
Analysis of meiotic progression, spore viability and meiotic CO frequency in the WT and hop1-K65A,N67Q/hop1-K65A,N67Q strains. (A) The percentage of cells going through meiosis I and meiosis II at the indicated time points in HOP1/HOP1, hop1Δ/hop1Δ and hop1-K65A,N67Q/hop1-K65A,N67Q strains. Approximately 100 cells per group were analyzed by DAPI staining. (B) Spore viability of WT, hop1-K65A,N67Q/hop1-K65A,N67Q and hop1Δ/hop1Δ strains. (C) Summary of number of tetrads analyzed and percentage of spore viability. (D) Schematic diagram showing genetic markers and physical distances in the URA3-HIS3 interval on chromosome XV (redrawn from (100)). (E and F) The bar plots show genetic distances in four adjacent intervals (URA3-LEU2, LEU2-LYS2, LYS2-ADE2 and ADE2-HIS3) on chromosome XV obtained upon analysis of tetrads (E) and spores (F). The error bars indicate standard error and 95% confidence interval in panels. The G-test spread sheet obtained from the Handbook of Biological Statistics (https://www.biostathandbook.com/) was used to perform the statistical analyses. ****P < 0.0001; **P< 0.01, *P< 0.05, and ‘ns’ indicates not significant. Raw data are presented in the Supplementary Table S6A and B.
Figure 10.
Figure 10.
ChIP-seq data reveals reduced association of Hop1K65A,N67Q variant across the genome. (A) Hop1 occupancy level in the WT, hop1-K65A,N67Q/hop1-K65A,N67Q and hop1Δ/hop1Δ strains at the 4-h time point on chromosome III. The Spo11 and Red1 binding data are from previous publications (26,136). Black circle represents the location of the centromere. (B) The box plot represents the genome-wide Hop1 read density in WT and the hop1-K65A,N67Q/hop1-K65A,N67Q strains. (C) Line graph shows the Hop1 read density (reads per million/kb) as a function of chromosome size. (D) Linear graph represents the exclusion of the short chromosomes (I, III and VI). The p values indicate statistical significance, and the Karl Pearson’s method calculates the correlation coefficient (r). The orange and light blue lines represent WT and the hop1-K65A,N67Q/hop1-K65A,N67Q mutant, respectively.

Similar articles

References

    1. Page S.L., Hawley R.S.. The genetics and molecular biology of the synaptonemal complex. Annu. Rev. Cell Dev. Biol. 2004; 20:525–558. - PubMed
    1. Zickler D., Kleckner N.. Recombination, pairing, and synapsis of homologs during meiosis. Cold Spring Harb. Perspect. Biol. 2015; 7:a016626. - PMC - PubMed
    1. Cahoon C.K., Hawley R.S.. Regulating the construction and demolition of the synaptonemal complex. Nat. Struct. Mol. Biol. 2016; 23:369–377. - PubMed
    1. Grey C., de Massy B.. Coupling crossover and synaptonemal complex in meiosis. Genes Dev. 2022; 36:4–6. - PMC - PubMed
    1. Ur S.N., Corbett K.D.. Architecture and dynamics of meiotic chromosomes. Annu. Rev. Genet. 2021; 55:497–526. - PubMed

MeSH terms

Substances

LinkOut - more resources