. 2025 Feb 8;53(4):gkae1267.
doi: 10.1093/nar/gkae1267.

Uncovering topologically associating domains from three-dimensional genome maps with TADGATE

Affiliations

Uncovering topologically associating domains from three-dimensional genome maps with TADGATE

Dachang Dang et al. Nucleic Acids Res. .

Abstract

Topologically associating domains (TADs) are essential components of three-dimensional (3D) genome organization and significantly influence gene transcription regulation. However, accurately identifying TADs from sparse chromatin contact maps and exploring the structural and functional elements within TADs remain challenging. To this end, we develop TADGATE, a graph attention auto-encoder that can generate imputed maps from sparse Hi-C contact maps while adaptively preserving or enhancing the underlying topological structures, thereby facilitating TAD identification. TADGATE captures specific attention patterns with two types of units within TADs and demonstrates TAD organization relates to chromatin compartmentalization with diverse biological properties. We identify many structural and functional elements within TADs, with their abundance reflecting the overall properties of these domains. We applied TADGATE to sparse and noisy Hi-C contact maps from 21 human tissues or cell lines. That improved the clarity of TAD structures, allowing us to investigate conserved and cell-type-specific boundaries and uncover cell-type-specific transcriptional regulatory mechanisms associated with topological domains. We also demonstrated TADGATE's capability to fill in sparse single-cell Hi-C contact maps and identify TAD-like domains within them, revealing the specific domain boundaries with distinct heterogeneity and the shared backbone boundaries characterized by strong CTCF enrichment and high gene expression levels.


Figures

Graphical Abstract
Graphical Abstract
Figure 1.
Figure 1.
Overview of TADGATE. TADGATE employs a graph attention auto-encoder to detect TADs from Hi-C contact maps and generates imputed maps that preserve or enhance the chromatin domain structure. TADGATE first constructs a neighborhood graph to represent the proximity relationships between genomic bins (radius is 2 in this figure) and further learns low-dimensional latent representations by harnessing genomic proximity and chromatin interactions via a graph attention auto-encoder. The input of the auto-encoder is the chromatin interaction vector of each bin, and the graph attention layer is adopted in the middle of the encoder and decoder. The model output consists of the imputed map, the embedding vector for each bin and the attention map. The imputed map offers a smoothed version of the original Hi-C contact map that retains the topological structures. The embedding vectors facilitate clustering bins into discernible TADs. The high degree of concordance between TAD boundaries and attention valleys in the attention sum profile also demonstrates the model’s capacity to capture and depict the topological information within the Hi-C contact map.
Figure 2.
Figure 2.
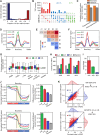
Comparison of TAD-calling methods. (A) Number of TADs identified by different methods in chromosome 1–22 and X of GM12878 cell line. The expected TAD length is ∼500 kb. (B) Silhouette coefficients of TADs identified by different methods. Each dot represents a chromosome. (C) Average CTCF binding profiles around the TAD boundaries identified by different methods. (D) Number and ratio of boundaries with CTCF enrichment from different methods. (E) Distribution of boundary score for boundaries identified by each method. The boundary score indicates how many methods recognized the boundary. (F) F1-scores of boundaries identified by different methods on each chromosome. (G) PCC between experimental Hi-C contact maps (with 100% reads) and Hi-C maps imputed by TADGATE, GRiNCH and scKTLD at different downsampling ratios. (H) F1-scores of boundaries identified by various methods at different downsampling ratios. The methods are ordered based on their average F1-score across all downsampling ratios. (I) Hi-C contact maps of a region on chromosome 2 of GM12878 at various downsampling ratios. The corresponding maps imputed by TADGATE, GRiNCH and scKTLD, and the TADs identified by them are shown. All maps were normalized to a similar scale for comparison.
Figure 3.
Figure 3.
Attention peaks and valleys facilitate the discovery of two types of distinct structural and functional elements within TADs. (A) Hi-C contact map of a region on chromosome 1 of GM12878, along with the TADs identified by TADGATE. The corresponding profile of attention sum is shown below, and dashed lines mark the attention valleys. The UMAP plot on the right is generated based on the embedding vectors of bins obtained from TADGATE, with bins grouped according to the TADs they belong to. (B) Aggregated Hi-C contact maps around attention valleys and peaks, along with the averaged attention sum profiles. (C) Average Hi-C contacts between attention valleys or peaks and other bins within the same domain. Random regions, excluding attention valleys and peaks, were selected as controls. (D) Expression patterns of genes located at attention valleys, attention peaks and randomly selected regions. (E) The difference in enrichment z-scores of several TFs between attention peaks and valleys. (F) The difference in enrichment z-scores of several histone modifications between attention peaks and valleys. (G) Profiles of some TFs, histone modifications, and DHSs around attention peaks or valleys. The shaded area represents the 95% confidence interval in bootstrap.
Figure 4.
Figure 4.
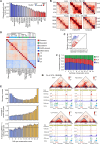
TAD organization is correlated with chromatin compartmentalization. (A) Distribution of domains with various fractions of bins belonging to compartment A. (B) The number of TADs with distinct subcompartment compositions. TAD comprises a subcompartment if it occupies at least 10% of the TAD region. (C) Proportion of compartment or subcompartment switch points located at TAD boundaries. We performed 100 random permutations of TADs as controls. (D) Comparison of the CI of TAD boundaries between different combinations of compartments. (E) Average CI of TAD boundaries between different combinations of subcompartments. The region marked by dashed lines in the upper right corner indicates the results between subcompartments belonging to types A and B. (F) The normalized CTCF signal around TAD boundaries between different combinations of compartments. (G) The enrichment z-score of repeat elements at TAD boundaries between different combinations of compartments. (H) Density of the Alu subfamilies in TAD boundaries between different combinations of compartments. (I) Expression patterns of genes located at TAD boundaries between different combinations of compartments. (J) The profile of H3K27me3 and H3K36me3 around TAD boundaries between different combinations of compartments. For each boundary, the direction of the profile is adjusted to keep a higher signal in the left TAD than the right one. The bar plot on the right side exhibits the difference between the average signals within the two TADs. (K) The distribution of CI of TAD boundaries exhibiting conserved positions but different compartment types between GM12878 and K562. The numbers of boundaries with higher CI in each cell line are shown. The vertical and horizontal dashed lines indicate the mean CI of these boundaries in GM12878 and K562.
Figure 5.
Figure 5.
Functional annotations of TADs and the internal regions from a two-layer HMM. (A) Emission probability of 20 kinds of region-level states under multiple epigenomic modifications. (B) Distribution probabilities of relative positions for six region-level states within TADs and results of the remaining 14 states are shown in Supplementary Figure S15C. (C) Six domain clusters with varying proportions across nine region types. (D) Fraction of compartment A bins within domains of six clusters. (E) Expression level of genes located in domains of six clusters.
Figure 6.
Figure 6.
Analysis of Hi-C data of 21 human tissues and cell lines with TADGATE. (A) The diagonal sparsity ratio of Hi-C contact maps for all chromosomes in 21 human tissues and cell lines. Some cell types are abbreviated, such as human embryonic stem cell (H1), mesendoderm (MES), mesenchymal stem cell (MSC), neural progenitor cell (NPC) and trophoblast-like cell (TRO). A high sparsity ratio represents poor quality of the contact map. (B) Two example regions to show the original Hi-C contact maps of lung and psoas, and the TADGATE-imputed contact maps and the corresponding TADs. In the third figure, the lower triangle represents the original map, while the upper triangle represents the TADGATE map. (C) Comparison of the diagonal sparsity ratios of the original maps and the TADGATE-imputed maps for all chromosomes in 21 tissues and cell lines. Each dot represents a chromosome and it is colored according to the cell type in (A). (D) Clustering results of all cell types based on the Spearman correlation coefficient of the CI with TADGATE-imputed contact maps for 21 tissues and cell lines. (E) The boundary number (top), the average CI across corresponding cell type (middle) and the average expression level of the nearby genes across all cell types (bottom) for core boundary regions with different cell type conservation scores. The dashed lines in the bottom figure represent the average expression of genes located at shuffled boundaries. (F) The compartment type ratios for boundary regions with different cell type conservation scores. (G) The comparison of TADGATE-imputed contact maps, chromatin topological domains, epigenetic signals and RNA-seq signal around the gene GRIA2 in cortex, hippocampus, left ventricle and right ventricle.
Figure 7.
Figure 7.
Application of TADGATE in single-cell Hi-C data of four cell lines. (A) Distribution of single cells with different average reads and sparsity ratios across all chromosomes. Statistics only include regions within 10 Mb from the diagonal of the contact matrix of each chromosome. (B) Comparison of the sparsity ratio between the raw Hi-C contact maps and the TADGATE-imputed maps for chromosome 2 across all single cells. Each cell is connected by a line before and after imputation. (C) Examples of raw contact maps, TADGATE-imputed maps, and identified TLDs in single cells from different cell types. The sparsity of single-cell contact maps increases from top to bottom. In the third column, the lower triangle shows the raw map, while the upper triangle shows the imputed map. Frames represent the identified TLDs. (D) Fold change of CTCF peaks around the boundaries of TLDs in single cells from K562 and BJ cell lines. The top panels show the profile of average fold-change across all cells, with shaded areas representing the standard deviation. Each row of the bottom heatmaps represents the average profile of all boundaries of an individual cell. (E) Cell embeddings based on the TLDs identified by TADGATE, deDoc2 and scKTLD. (F) Comparison of single-cell clustering performance (FMI, ARI, NMI and AMI) for TADGATE, scKTLD and deDoc2. (G) Hi-C contact maps combined from all single cells of K562 or BJ cell lines. Frames represent TADs identified from these combined maps, with dots below indicating TAD boundaries. The total number of cells in which each bin serves as a TLD boundary is shown. Squares represent boundary positions in each single cell (each row represents one cell). Triangles mark some boundaries that are highly conserved among single cells. (H–J) Comparison of the CI in the combined maps (H), the CTCF enrichment (I) and gene expression (J) for bins with different boundary probabilities for each cell type. Q1 to Q4 represent the probability levels of each bin serving as a TLD boundary in all cells of the same type, with increasing probabilities from Q1 to Q4.

References

    1. Dekker J., Rippe K., Dekker M., Kleckner N.. Capturing chromosome conformation. Science. 2002; 295:1306–1311. - PubMed
    1. Dostie J., Richmond T.A., Arnaout R.A., Selzer R.R., Lee W.L., Honan T.A., Rubio E.D., Krumm A., Lamb J., Nusbaum C.et al. .. Chromosome conformation capture carbon copy (5C): a massively parallel solution for mapping interactions between genomic elements. Genome Res. 2006; 16:1299–1309. - PMC - PubMed
    1. Simonis M., Klous P., Splinter E., Moshkin Y., Willemsen R., de Wit E., van Steensel B., de Laat W.. Nuclear organization of active and inactive chromatin domains uncovered by chromosome conformation capture-on-chip (4C). Nat. Genet. 2006; 38:1348–1354. - PubMed
    1. Lieberman-Aiden E., van Berkum N.L., Williams L., Imakaev M., Ragoczy T., Telling A., Amit I., Lajoie B.R., Sabo P.J., Dorschner M.O.et al. .. Comprehensive mapping of long-range interactions reveals folding principles of the human genome. Science. 2009; 326:289–293. - PMC - PubMed
    1. Rao S.S., Huntley M.H., Durand N.C., Stamenova E.K., Bochkov I.D., Robinson J.T., Sanborn A.L., Machol I., Omer A.D., Lander E.S.et al. .. A 3D map of the human genome at kilobase resolution reveals principles of chromatin looping. Cell. 2014; 159:1665–1680. - PMC - PubMed

LinkOut - more resources