. 2025 Jan 13;64(1):479-494.
doi: 10.1021/acs.inorgchem.4c04995. Epub 2024 Dec 27.

Biomimetic [MFe3S4]3+ Cubanes (M = V/Mo) as Catalysts for a Fischer-Tropsch-like Hydrocarbon Synthesis─A Computational Study

Affiliations

Biomimetic [MFe3S4]3+ Cubanes (M = V/Mo) as Catalysts for a Fischer-Tropsch-like Hydrocarbon Synthesis─A Computational Study

Maxim Barchenko et al. Inorg Chem. .

Abstract

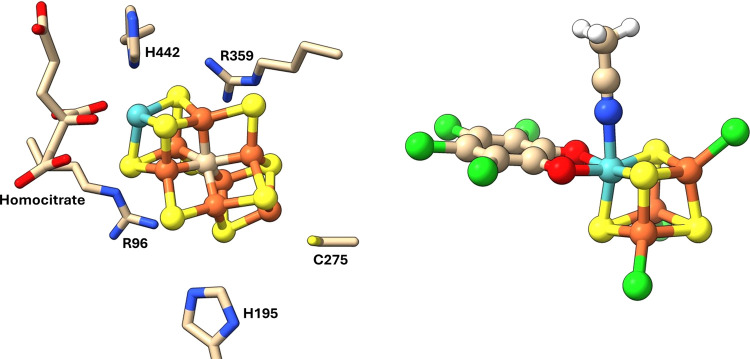
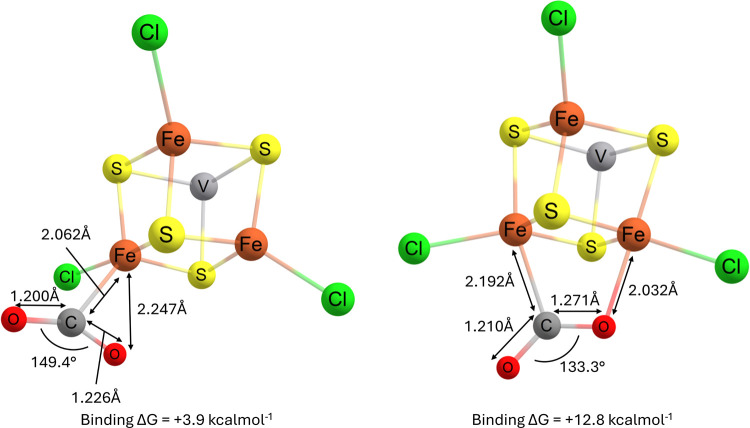
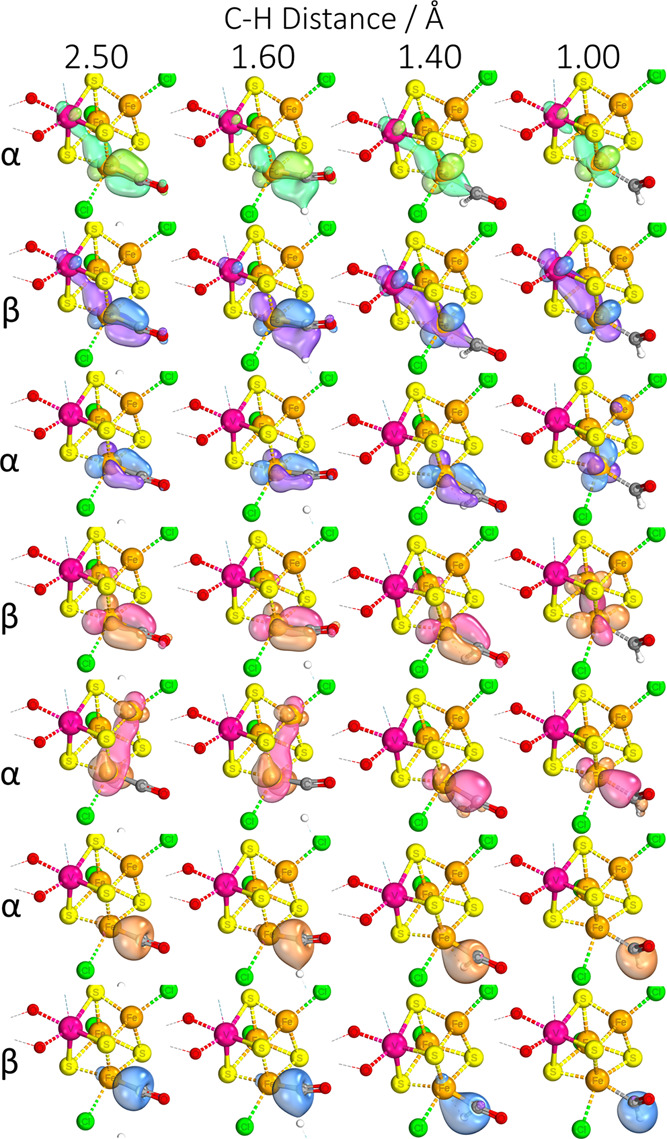
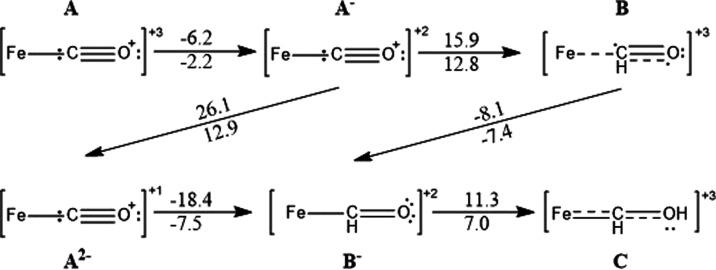
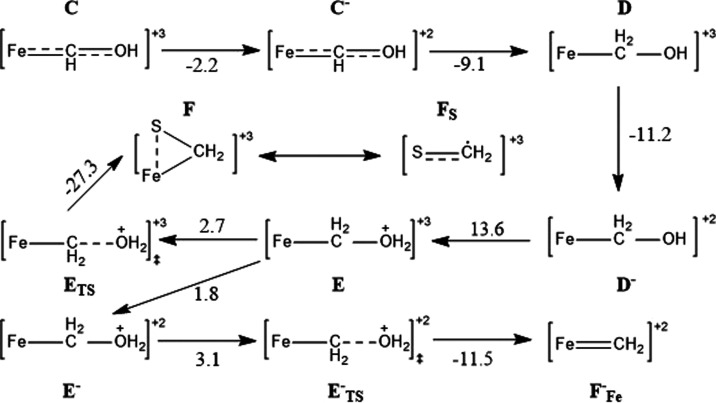
Nitrogenase is the enzyme primarily responsible for reducing atmospheric nitrogen to ammonia. There are three general forms of nitrogenase based on the metal ion present in the cofactor binding site, namely, molybdenum-dependent nitrogenases with the iron-molybdenum cofactor (FeMoco), the vanadium-dependent nitrogenases with FeVco, and the iron-only nitrogenases. It has been shown that the vanadium-dependent nitrogenases tend to have a lesser efficacy in reducing dinitrogen but a higher efficacy in binding and reducing carbon monoxide. In biomimetic chemistry, [MFe3S4] (M = Mo/V) cubanes have been synthesized, studied, and shown to be promising mimics of some of the geometric and electronic properties of the nitrogenase cofactors. In this work, a density functional theory (DFT) study is presented on Fischer-Tropsch catalysis by these cubane complexes by studying CO binding and reduction to hydrocarbons. Our work implies that molybdenum has stronger binding interactions with the iron-sulfur framework of the cubane, which results in easier reduction of substrates like N2H4. However, this inhibits the binding and activation of CO, and hence, the molybdenum-containing complexes are less suitable for Fischer-Tropsch catalysis than vanadium-containing complexes.


Conflict of interest statement

The authors declare no competing financial interest.

Figures

Figure 1
Figure 1
Depictions of the active site of FeMoco (left) and the [MFe3S4]3+ cubanes used as the model in the study with a bound acetonitrile ligand (right). Color scheme: turquoise = Mo/V, yellow = S, dark orange = Fe, green = Cl, red = O, gray = C, blue = N.
Figure 2
Figure 2
IBOs involved in Mo–CO binding for the [MoFe3S4]3+ complex, with the percentage indicating the degree of localization of the orbital shown on the carbon center. The iso-surface threshold was taken as 80%.
Figure 3
Figure 3
IBOs involved in Fe–CO binding for the [MoFe3S4]3+ complex, with the percentage indicating the degree of localization of the orbital shown on the carbon center. The iso-surface threshold was taken as 80%.
Figure 4
Figure 4
IBOs involved in Fe–CO binding for the [VFe3S4]2+ complex, with the percentage indicating the degree of localization of the orbital shown on the carbon center. The iso-surface threshold was taken as 80%.
Figure 5
Figure 5
Geometry-optimized local minima for the binding of CO2 to the [VFe3S4]3+ complex alongside the calculated free energy change upon binding.
Figure 6
Figure 6
IBOs that display significant change over the course of a C–H relaxed surface scan, showing electron movement during the protonation of the CO substrate’s carbon center when bound to the [VFe3S4]2+ complex. The iso-surface threshold was taken as 80%.
Figure 7
Figure 7
Mechanism of CO protonation/reduction showing the first two protonation steps after binding on the Fe center of the [VFe3S4]2+ complex.
Figure 8
Figure 8
Thermodynamics of sequential and staggered electron and proton transfer to [VFe3S4]3+ for systems with (top) and without (bottom) acetonitrile bound. Free energies are given in kcal mol–1 and include zero-point, thermal, and entropic corrections at 298 K.
Figure 9
Figure 9
Further CO protonation/reduction steps from Fe–CHOH. The relevant free energies given are for structures with acetonitrile dissociated, and all energies are given in kcal mol–1.
Figure 10
Figure 10
Structures of key intermediates before and after C–C bond formation via a “sandwiched” intermediate (FCOG on Figure 13). Parts have been omitted for clarity.
Figure 11
Figure 11
Relaxed surface scan graph, showing the relative energies of optimized structures for each fixed C–C distance. For the OC–Fe–CH2OH2 intermediate, the first saddle corresponds to the dissociation of water from the complex, while the second saddle corresponds to the C–C bond formation.
Figure 12
Figure 12
IBOs that display significant change over the course of a C–H relaxed surface scan, showing formation of a C–C bond between the −CO and −CH2– species when bound to the [VFe3S4]3+ complex. The iso-surface threshold was taken as 80%.
Figure 13
Figure 13
C–C bond formation and further protonation/reduction mechanistic steps from OC–M–CH2–S, also showing extensive charge delocalization through resonance structures. The relevant energies given are for structures with acetonitrile dissociated, and are given in kcal mol–1. The energies are provided in blue for reduction steps and in red for protonation steps, which occur in the order of reduction first.
Figure 14
Figure 14
IBOs showing the mixed-valence Fe–Fe β electron before and after the dissociation of H2O from the Fe–CH(OH2)CH2–S intermediate. The iso-surface threshold was taken as 80%.
Figure 15
Figure 15
Structures of key CH2CH2-containing intermediates (LLbi on Figure 16). Parts have been omitted for clarity.
Figure 16
Figure 16
Summary of the mechanistic steps and energies involved in the dissociation of ethylene from the complex. Reduction free energies are given in blue, other free energies in pink, and electronic energies (from relaxed surface scans of bond lengths) in black. The relevant energies given are for structures with acetonitrile dissociated, and are given in kcal mol–1.
Figure 17
Figure 17
Summary of investigated mechanistic steps toward the formation of the C2H6 saturated product. Protonation free energies are given in red, reduction free energies in blue, other free energies in pink, and electronic energies (from relaxed surface scans) in black. When reduction and protonation energies are given together, reduction occurs first. The relevant energies given are for structures with acetonitrile dissociated, and are given in kcal mol–1.

Similar articles

References

    1. Carnahan J. E.; Mortenson L. E.; Mower H. F.; Castle J. E. Nitrogen Fixation in Cell-Free Extracts of Clostridium Pasteurianum. Biochim. Biophys. Acta 1960, 44, 520–535. 10.1016/0006-3002(60)91606-1. - DOI - PubMed
    1. Hales B. J.; Case E. E.; Morningstar J. E.; Dzeda M. F.; Mauterer L. A. Isolation of a new vanadium-containing nitrogenase from Azotobacter vinelandii. Biochemistry 1986, 25, 7251–7255. 10.1021/bi00371a001. - DOI - PubMed
    1. Chisnell J. R.; Premakumar R.; Bishop P. E. Purification of a Second Alternative Nitrogenase from a nifHDK Deletion Strain of Azotobacter vinelandii. J. Bacteriol. 1988, 170, 27–33. 10.1128/jb.170.1.27-33.1988. - DOI - PMC - PubMed
    1. Eady R. R. Structure-Function Relationships of Alternative Nitrogenases. Chem. Rev. 1996, 96, 3013–3030. 10.1021/cr950057h. - DOI - PubMed
    1. Ribbe M. W.; Hu Y. Nitrogenase and homologs. JBIC, J. Biol. Inorg. Chem. 2015, 20, 435–445. 10.1007/s00775-014-1225-3. - DOI - PMC - PubMed

LinkOut - more resources