. 2024 Dec 27:13:RP96536.
doi: 10.7554/eLife.96536.

A transcription network underlies the dual genomic coordination of mitochondrial biogenesis

Affiliations

A transcription network underlies the dual genomic coordination of mitochondrial biogenesis

Fan Zhang et al. Elife. .

Abstract

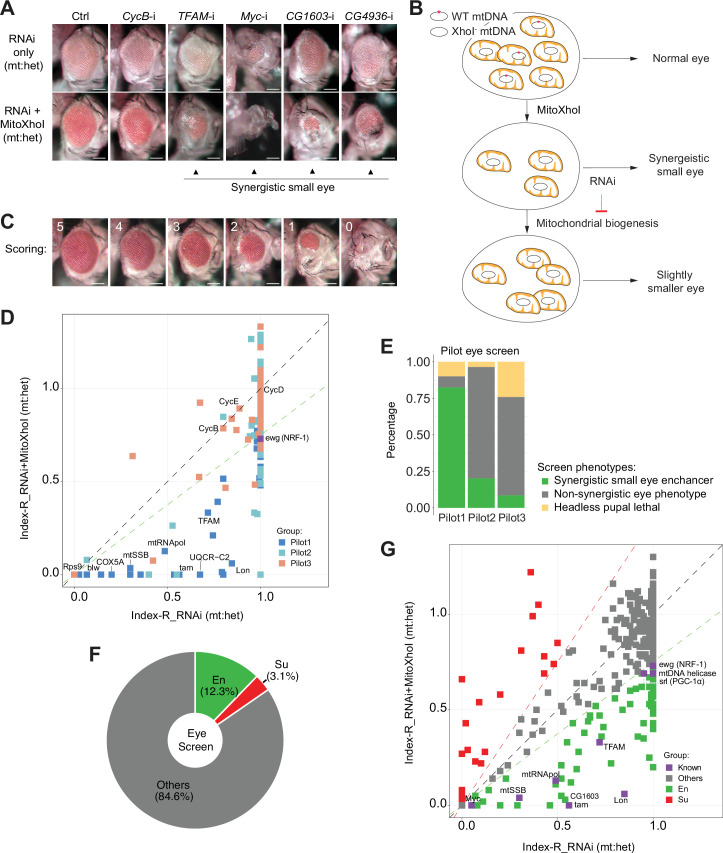
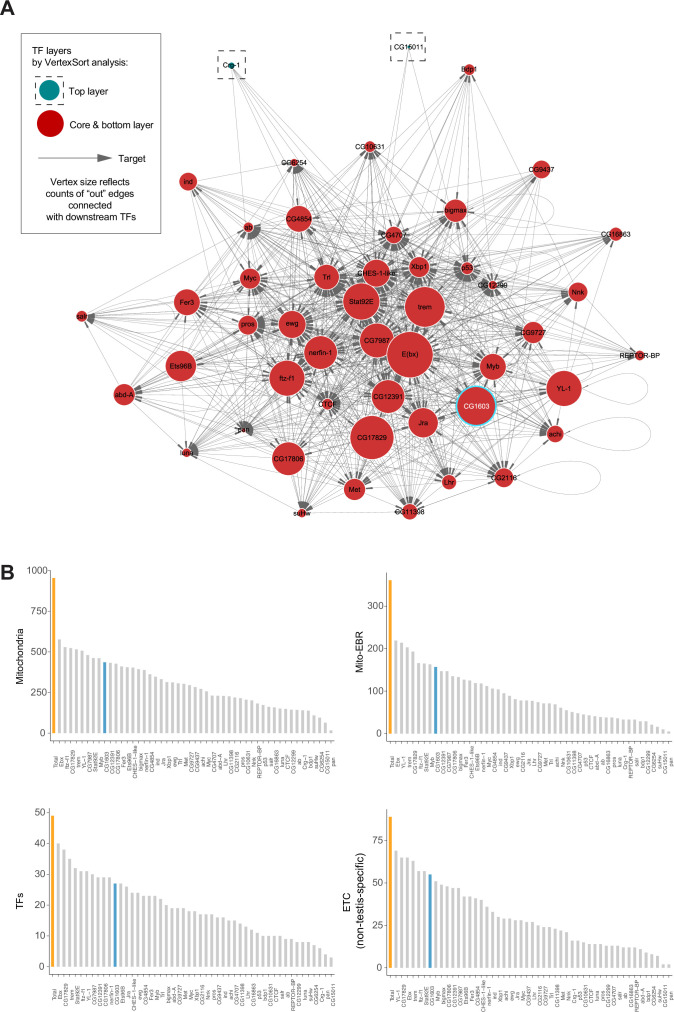
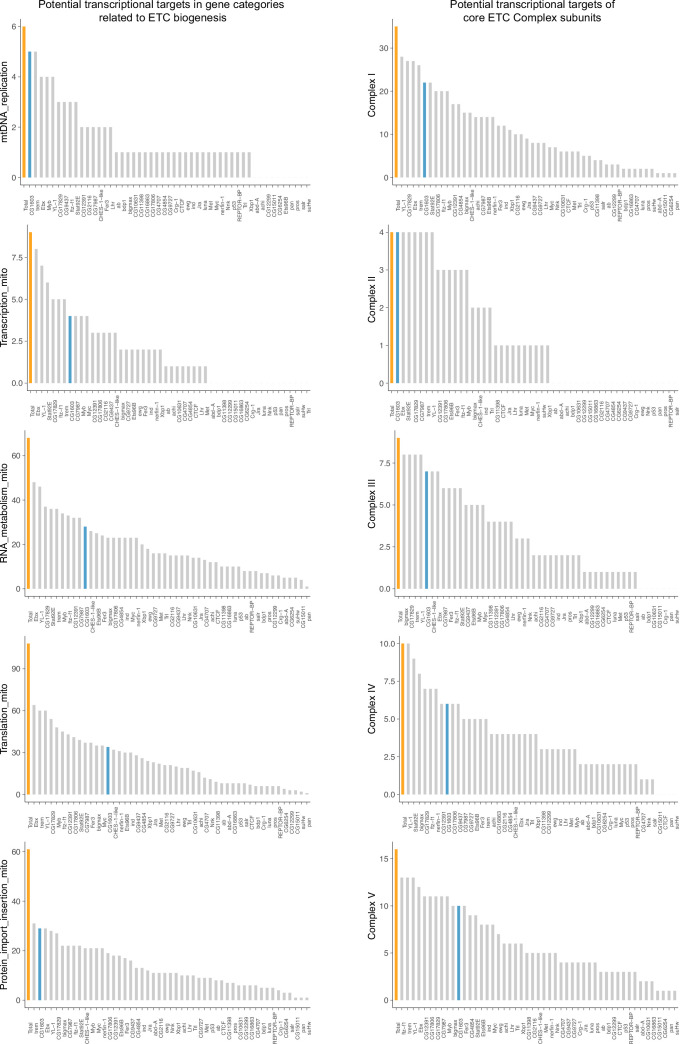
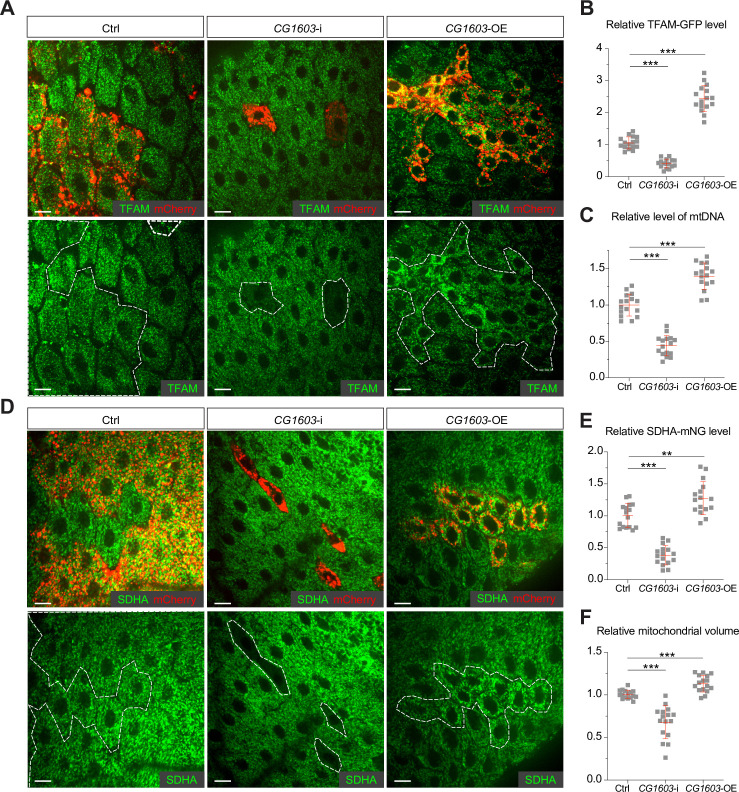
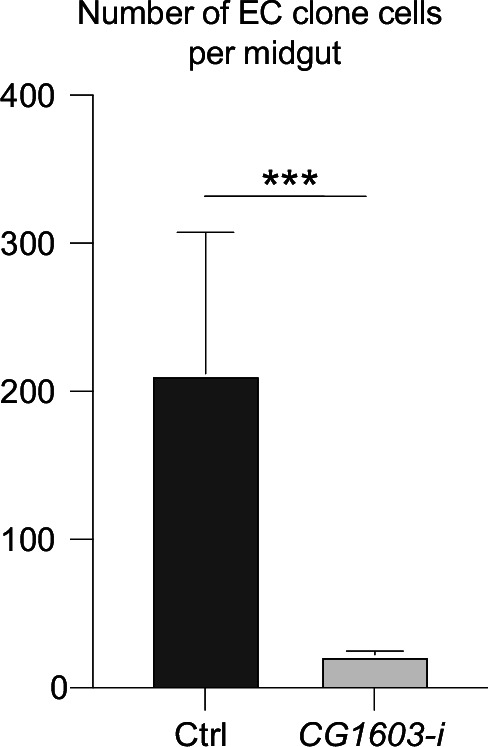
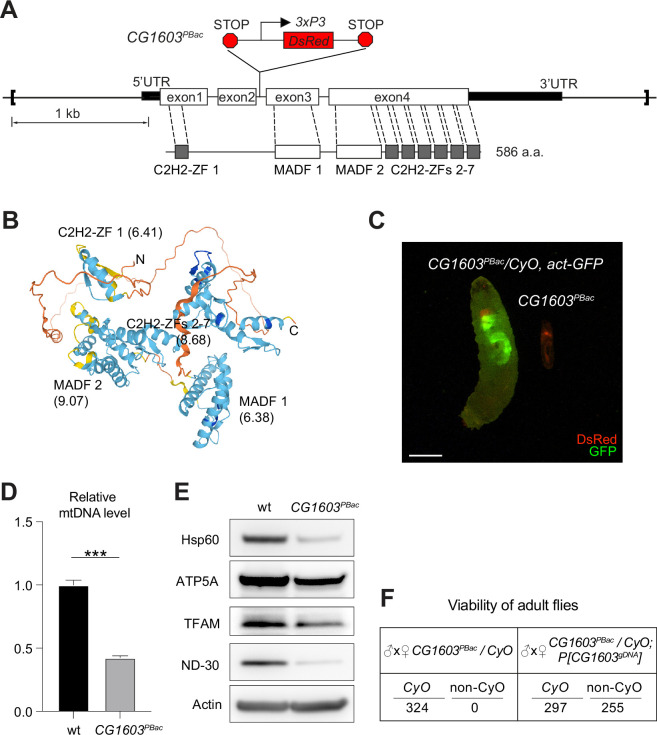
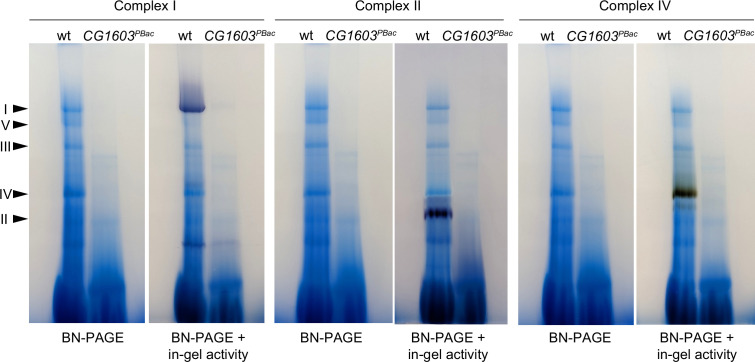
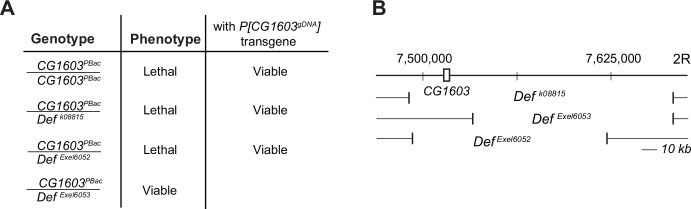
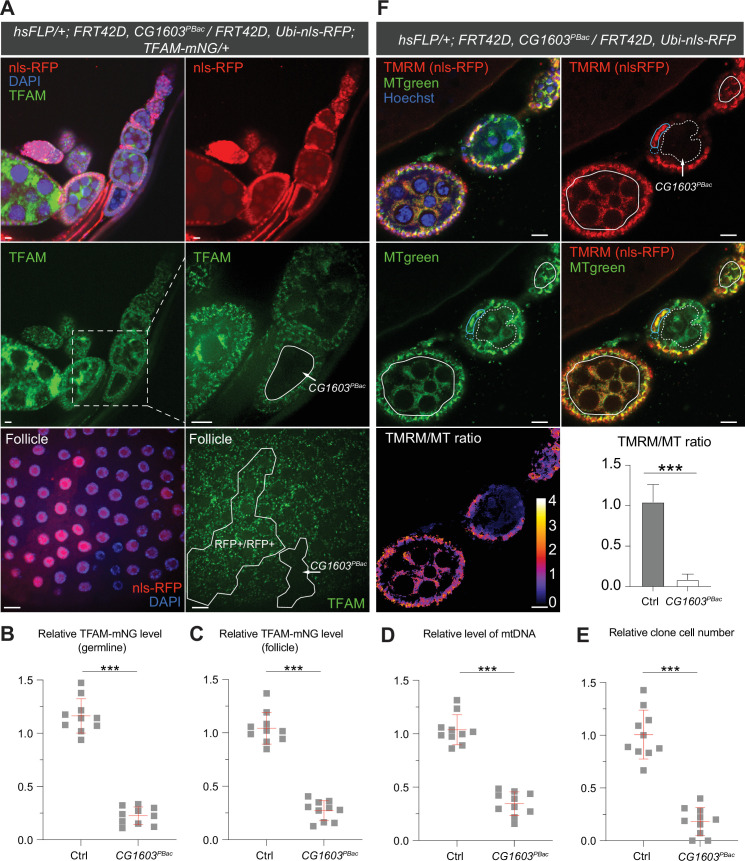
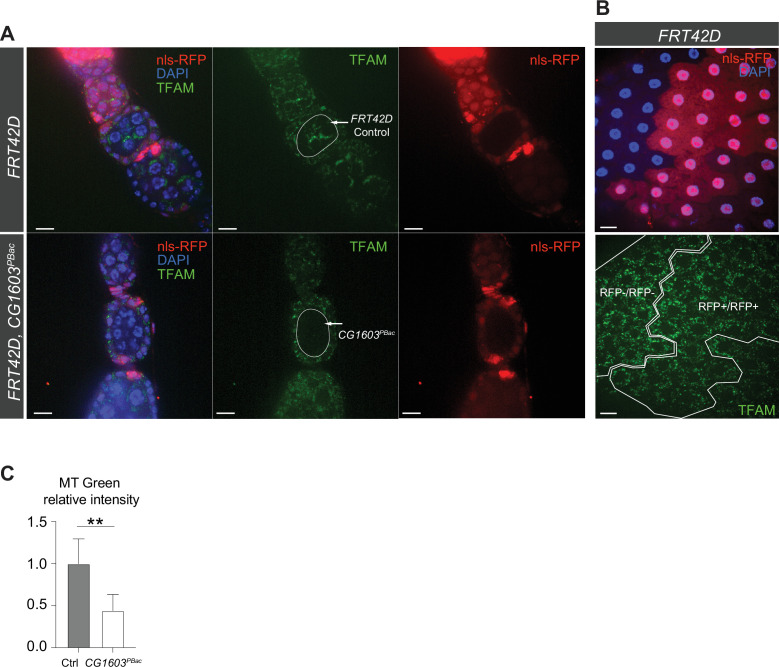
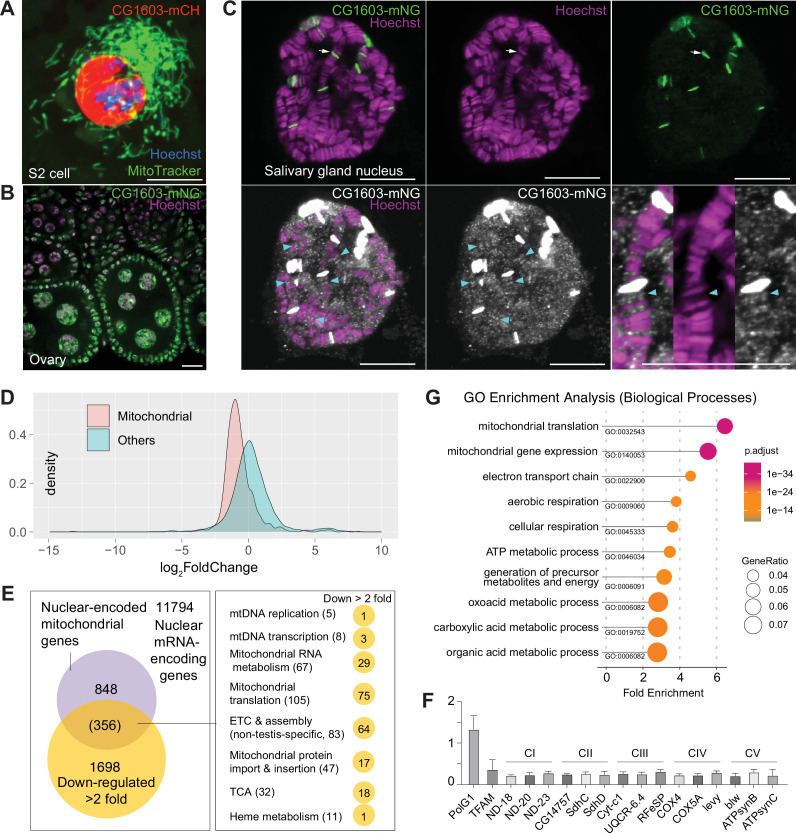
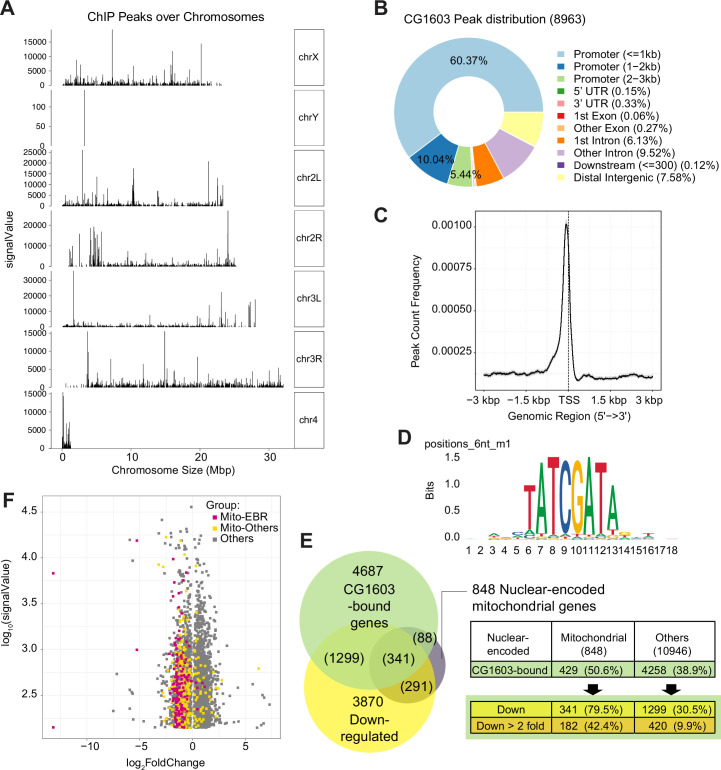
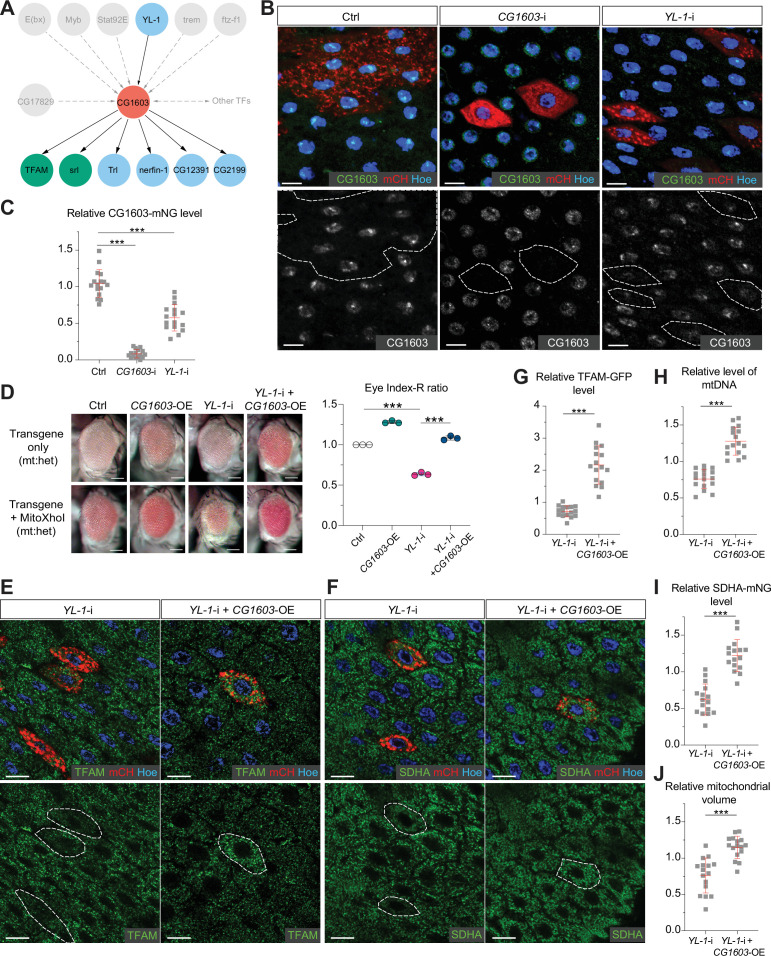
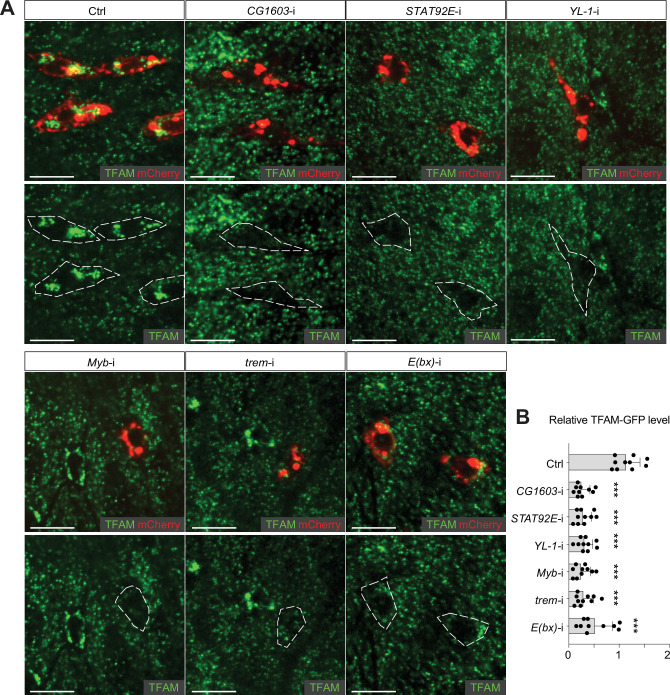
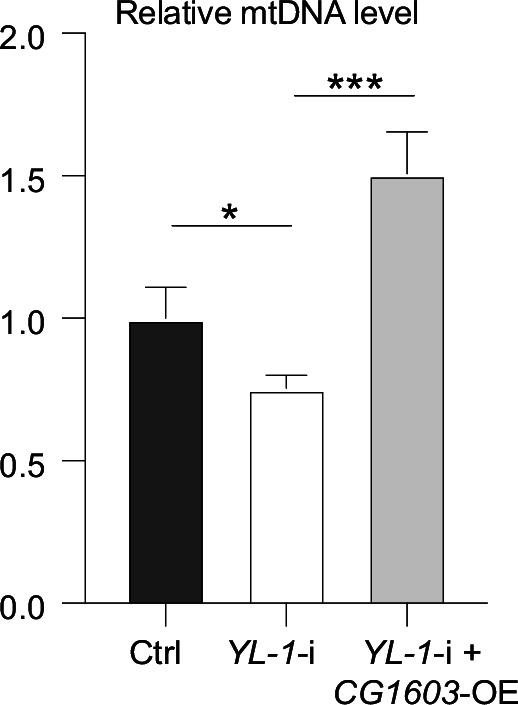
Mitochondrial biogenesis requires the expression of genes encoded by both the nuclear and mitochondrial genomes. However, aside from a handful transcription factors regulating specific subsets of mitochondrial genes, the overall architecture of the transcriptional control of mitochondrial biogenesis remains to be elucidated. The mechanisms coordinating these two genomes are largely unknown. We performed a targeted RNAi screen in developing eyes with reduced mitochondrial DNA content, anticipating a synergistic disruption of tissue development due to impaired mitochondrial biogenesis and mitochondrial DNA (mtDNA) deficiency. Among 638 transcription factors annotated in the Drosophila genome, 77 were identified as potential regulators of mitochondrial biogenesis. Utilizing published ChIP-seq data of positive hits, we constructed a regulatory network revealing the logic of the transcription regulation of mitochondrial biogenesis. Multiple transcription factors in core layers had extensive connections, collectively governing the expression of nearly all mitochondrial genes, whereas factors sitting on the top layer may respond to cellular cues to modulate mitochondrial biogenesis through the underlying network. CG1603, a core component of the network, was found to be indispensable for the expression of most nuclear mitochondrial genes, including those required for mtDNA maintenance and gene expression, thus coordinating nuclear genome and mtDNA activities in mitochondrial biogenesis. Additional genetic analyses validated YL-1, a transcription factor upstream of CG1603 in the network, as a regulator controlling CG1603 expression and mitochondrial biogenesis.

Keywords: ChIP-seq; D. melanogaster; RNA-seq; SDHA; TFAM; genetics; genomics; mitochondrial biogenesis; transcription factors.


Conflict of interest statement

FZ, AL, AF, JH, ZW, SG, ZC, HX No competing interests declared

Figures

Figure 1.
Figure 1.. A genetic modifier screen identifying transcription factors regulating electron transport chain (ETC) biogenesis.
(A) Representative images of adult eye of the control RNAi (Ctrl) and RNAi of selected genes tested in the eye screen, including CycB RNAi (CycB-i), TFAM RNAi (TFAM-i), Myc RNAi (Myc-i), CG1603 RNAi (CG1603-i), and CG4936 RNAi (CG4936-i). The upper panel shows eyes from RNAi-only offspring, and lower panel displays eyes from RNAi+MitoXhoI offspring cultured at the same condition. Arrowheads indicate the synergistic small-eye phenotype resulting from the combination of gene knockdown and the mitochondrial DNA (mtDNA) deficiency caused by mitoXhoI in the background of heteroplasmic mtDNAs. Scale bars: 100 µm. (B) Schematic of the genetic modifier screen methodology (see text for details). (C) Representative images illustrating the scoring of eye size. Scale bars: 100 µm. (D) A plot illustrating the calling of positive hits in the pilot screen. Each datapoint represents the Index-R of RNAi (X values) or RNAi+MitoXhoI flies (Y values) for each gene belonging to the different groups (see (E) and Supplementary file 1 for details). Genes with datapoints below the gray diagonal dash line exhibited a synergistic effect when combining their RNAi with mtDNA deficiency suggesting a potential role in regulating ETC biogenesis. The datapoint for ewg, the fly homolog of NRF-1, is labeled in purple. The green dashed line of slope 0.75 outlines the threshold for calling out positive hits based on ewg’s performance in the screen. (E) Graph summarizing the pilot screen of nuclear-encoded genes, demonstrating the efficacy of this screen in identifying genes involved in mitochondrial ETC biogenesis. Pilot group 1 (Pilot1) has 40 genes that are either nuclear-encoded ETC subunits or related to mtDNA maintenance and gene expression (Mito-EBR). Pilot2 has 84 genes involved in other mitochondrial processes. Pilot3 has 58 essential genes from other cellular components. (F) Graph summarizing the percentages of synergistic enhancers (En) and suppressors (Su) identified in the screen (see (G) and Supplementary file 1 for details). (G) A plot illustrating the calling of positive hits in the screen of transcription factor (TF) genes. Factors that are known to be involved in mitochondrial or ETC biogenesis are marked in purple (Known). The green dashed line outlines the threshold for calling out synergistic enhancers (En, green square). The red dashed line of slope 1.5 outlines the threshold for calling out suppressors (Su, red square).
Figure 2.
Figure 2.. Regulatory network of mitochondrial biogenesis.
(A) The transcriptional regulatory network of nuclear-encoded mitochondrial genes. (B) Bar graphs illustrating the promoter binding profiles of 49 synergistic enhancer transcription factors (TFs) within different groups of genes (nuclear-encoded mitochondrial genes, Mito-EBR genes, 49 synergistic enhancer TFs, and electron transport chain [ETC] genes). The number of genes in each group (orange) and the number of these bound by CG1603 (cyan) were highlighted.
Figure 2—figure supplement 1.
Figure 2—figure supplement 1.. The promoter binding profiles of the enhancer transcription factors (TFs) in different mitochondrial biogenesis-related groups.
Bar graphs summarizing the promoter binding profiles of the 49 synergistic enhancer TFs within subgroups of genes involved in different processes of electron transport chain (ETC) biogenesis. The number of genes in each subgroup (orange) and the number of these bound by CG1603 (cyan) were highlighted.
Figure 3.
Figure 3.. CG1603 promotes electron transport chain (ETC) gene expression and mitochondrial biogenesis.
(A, D) Representative images of control RNAi (Ctrl), CG1603 RNAi (CG1603-i), and CG1603 overexpression (CG1603-OE) midgut enterocytes (EC) clones with endogenously expressed TFAM-GFP (A) or SDHA-mNG (D) visualized in green. Clones were labeled by mCherry red and compared with wild type (wt) neighbors. White dashed lines aided in illustrating clones. Scale bars: 10 µm. (B, C, E, F) Quantification of the relative TFAM-GFP level (B), the relative levels of mtDNA (C), the relative SDHA-mNG level (E), and the relative mitochondrial volume (F) in the EC clones to their wt neighbors. n=16 from 8 midguts for each group, error bar: SD. Two-tailed Student's t-test, **: p<0.01, ***: p<0.001.
Figure 3—figure supplement 1.
Figure 3—figure supplement 1.. CG1603 RNAi led to fewer enterocytes (EC) clone cells.
Number of EC clone cells in control RNAi (Ctrl) and CG1603 RNAi (CG1603-i) midguts. n=8, error bar: SD. Two-tailed Student's t-test, ***: p<0.001.
Figure 4.
Figure 4.. CG1603 gene model, product, mutant, and the genomic DNA transgene.
(A) Schematic representation of CG1603 genomic locus, showing the CG1603 transcript (5’ and 3’UTR in black bar and four exons in white), its protein product (586 amino acids in length, and characterized by seven C2H2-ZF and two MADF domains), the CG1603PBac mutant allele (with a PiggyBac insertion in the second intron, which is marked by fluorescent DsRed driven by an eye-specific 3xP3 promoter and flanked by stop codons in all three reading frames terminating translation through downstream), and the genomic region (in square brackets, from 955 bp upstream of the CG1603 5’UTR to 656 bp downstream of CG1603 3’UTR) used for the P[CG1603gDNA] transgene. (B) Predicted 3D structure of the CG1603 protein by AlphaFold. Labels indicate the N- and C-terminus, as well as the specific protein domains along with their predicted isoelectric point (pI). (C) Images of CG1603PBac/CyO, Act-GFP, and homozygous CG1603PBac larvae cultured together at 25°C, day 4 after egg laying. Green: GFP; red: DsRed. Scale bars: 1 mm. (D) Relative mitochondrial DNA (mtDNA) levels in CG1603PBac mutant larvae to wild type (wt) control. n=3, error bar: SD. Two-tailed Student's t-test, ***: p<0.001. (E) Western blots of mitochondrial proteins in CG1603PBac mutant larvae to wt control. (F) P[CG1603gDNA] restored viability of CG1603PBac flies. The number of progenies for each genotype is listed.
Figure 4—figure supplement 1.
Figure 4—figure supplement 1.. The integrities and activities of electron transport chain (ETC) complexes were reduced in CG1603PBac mutant.
Blue native PAGE and in-gel activity analyses of ETC Complex I, II, and IV isolated from wild type (wt) and CG1603PBac mutant. An equal amount of protein was used for each sample.
Figure 4—figure supplement 2.
Figure 4—figure supplement 2.. Adult viability phenotypes of combinations of CG1603PBac mutant, P[CG1603gDNA] transgene, and deficiency chromosomes.
(A) Summary of adult viability phenotypes of combinations of CG1603PBac mutant, P[CG1603gDNA] transgene, and deficiency chromosomes. (B) Schematic map of deficiency chromosomes spanning CG1603 genomic region.
Figure 5.
Figure 5.. Clonal analyses confirmed CG1603’s role in mitochondrial biogenesis and activity.
(A) Representative images of CG1603PBac mutant germline (top and middle panel) and follicle (bottom panel) clones in late-stage egg chambers of adult ovaries with endogenously expressed TFAM-mNG visualized in green. Homozygous mutant clones lacked RFP and were compared with either flanking RFP-positive cysts (germline) or homozygous wild type (wt) twin (follicle). White dashed lines aided in illustrating clones. The wt (RFP+/RFP+) follicle clone showed markedly higher RFP intensity than the heterozygous (RFP+/RFP-) cells, as shown in Figure 5—figure supplement 1B. Red: nls-RFP; blue: DAPI. Scale bars: 10 μm. (B) Quantification of the relative TFAM-mNG level in the homozygous FRT42D control and CG1603PBac mutant germline clone in the early-stage egg chamber to the adjacent anterior RFP-positive cyst within the same ovariole. As shown in Figure 5—figure supplement 1A. n=10 for each group, error bar: SD. Two-tailed Student's t-test, ***: p<0.001. (C–E) Quantification of the relative TFAM-mNG level (C), the relative levels of mtDNA (D), and the relative clone cell number (E) in the homozygous FRT42D control and CG1603PBac mutant follicle clones to their wt twins. n=10 for each group, error bar: SD. Two-tailed Student's t-test, ***: p<0.001. (F) TMRM/MitoTracker Green (MT) ratiometric live imaging and quantification of ovarioles containing homozygous CG1603PBac mutant germline clones (highlighted by white dashed lines). Notably, in contrast to flanking control cysts (highlighted by white lines), Δψm was almost absent in mutant clones. Please note that compared to TMRM, nls-RFP signal was too low to be detected in ratiometric imaging. Nonetheless, the nls-RFP was readily detected in control cysts, but not in homozygous CG1603PBac clones, via visual observation, as depicted in (A), Figure 5—figure supplement 1A and B. A twin pair of follicle clones in the same egg chamber were also highlighted (cyan line for control and cyan dashed line for homozygous CG1603PBac mutant). The MT intensity was reduced in both the germline and follicle CG1603PBac clones, compared to germ cells in adjacent egg chambers and follicle cells in the same egg chamber, respectively. Quantification with background correction for MT intensity in germline clones is shown in Figure 5—figure supplement 1C. Blue: Hoechst. Scale bars: 10 µm. n=8, error bar: SD. Two-tailed Student's t-test, ***: p<0.001.
Figure 5—figure supplement 1.
Figure 5—figure supplement 1.. Clonal analyses confirmed CG1603’s role in mitochondrial biogenesis.
(A) Representative images of homozygous FRT42D control and CG1603PBac mutant germline clones in early-stage egg chambers of adult ovaries with endogenously expressed TFAM-mNG visualized in green. Homozygous mutant clones lacked RFP and were compared to the adjacent RFP-positive cysts. Red: RFP; blue: DAPI. Scale bars: 10 μm. (B) Representative images of homozygous FRT42D control follicle cell clone (RFP-/RFP-) and its wild type (wt) twin (RFP+/RFP+) with endogenously expressed TFAM-mNG visualized in green. Red: nls-RFP; blue: DAPI. Scale bars: 10 μm. (C) The relative intensity of MitoTracker (MT) Green in CG1603PBac mutant germline clones to control (Ctrl). n=8, error bar: SD. Two-tailed Student's t-test, **: p<0.01.
Figure 6.
Figure 6.. CG1603 localizes in the nucleus and is essential for regulating nuclear mitochondrial gene expression.
(A–B) Representative images showing the nuclear localization of CG1603 protein in cultured S2 cells (A) and adult ovary (B). Green: MitoTracker Green in S2 cell, and CG1603-mNG in tissues; red: CG1603-mCH; blue and magenta: Hoechst. Scale bars: 10 μm. (C) Representative images showing bindings of endogenously expressed CG1603 proteins to less condensed euchromatin regions in the polytene chromosomes of a salivary gland. High-intensity CG1603-mNG bands were visualized in green in the upper panel and indicated by arrows, and low-intensity bands were pesudo-colored in white in theblower panel and indicated by arrow heads. The images of the lower panel were same as these in the upper panel, but digitally enhanced. Magenta: Hoechst. Scale bars: 10 μm. (D) Density plot illustrating the distribution of expression changes of the nuclear-encoded mitochondrial and non-mitochondrial genes in CG1603PBac mutant. (E) Graph illustrating the overlap between nuclear-encoded mitochondrial genes and differentially expressed genes (DEGs) that down-regulated >2-fold, as well as the distribution of the overlapped genes in different mitochondrial function categories. (F) Relative mRNA levels of several electron transport chain (ETC) biogenesis-related genes in CG1603PBac mutant larvae to control, measured by real-time PCR. n=3, error bar: SD. (G) Gene Ontology (GO) enrichment analyses of DEGs that down-regulated >2-fold. The top 10 enriched biological processes are shown.
Figure 7.
Figure 7.. ChIP analysis identified nuclear mitochondrial genes that may be directly regulated by CG1603.
(A) CG1603 ChIP peaks over all chromosomes. (B) Genomic distribution of CG1603 peaks. (C) Average profile of CG1603 peaks binding to transcription start site (TSS) regions. (D) Representative binding motif discovered with CG1603 ChIP peaks. (E) The number of nuclear-encoded mitochondrial and non-mitochondrial genes bound by CG1603, and the overlapping down-regulated differentially expressed genes (DEGs) in each group. (F) Scatterplot illustrating the signalValue of CG1603 ChIP peaks (y-axis) and log2 fold change in expression of DEGs between CG1603PBac mutant and control (x-axis). Mito-EBR: genes related to electron transport chain (ETC) biogenesis and maintenance, including ETC subunits and assembly factors, mitochondrial DNA (mtDNA) replication and transcription, mitochondrial RNA metabolism and translation, as well as mitochondrial protein import and membrane insertion machinery.
Figure 8.
Figure 8.. YL-1 is an upstream regulator of CG1603.
(A) Schematic graph illustrating the CG1603 upstream and downstream (co-)TFs (transcription factors) involved in regulating mitochondrial electron transport chain (ETC) biogenesis, inferred from ChIP-seq, RNA-seq, and genetics data. (B) Representative images of control RNAi (Ctrl), CG1603 RNAi (CG1603-i), and YL-1 RNAi (YL-1-i) midgut enterocytes (EC) clones with endogenously expressed CG1603-mNG visualized in green or white. Clones were labeled by mCherry red and compared with wild type (wt) neighbors. White dashed lines aided in illustrating clones. Blue: Hoechst. Scale bars: 10 μm. (C) Quantification of the relative CG1603-mNG level in the EC clones to their wt neighbors. n=16 from 8 midguts for each group, error bar: SD. Two-tailed Student's t-test, ***: p<0.001. (D) Representative eye image and Index-R ratio (RNAi+mitoXhoI/RNAi-only) of adult flies with indicated genotypes. Three biological repeats were performed for each group, error bar: SD. Two-tailed Student's t-test, ***: p<0.001. Scale bars: 100 µm. (E–F) Representative images of YL-1 RNAi (YL-1-i) and YL-1 RNAi+CG1603 overexpression (YL-1-i+CG1603 OE) midgut EC clones with endogenously expressed TFAM-GFP (E) or SDHA-mNG (F) visualized in green. Clones were labeled by mCherry red and compared with wt neighbors. Blue: Hoechst. Scale bars: 10 µm. (G–J) Quantification of the relative TFAM-GFP level (G), the relative levels of mtDNA (H), the relative SDHA-mNG level (I), and the relative mitochondrial volume (J) in the EC clones to their wt neighbors. n=16 from 8 midguts for each group, error bar: SD. Two-tailed Student's t-test, ***: p<0.001.
Figure 8—figure supplement 1.
Figure 8—figure supplement 1.. TFAM levels in the RNAi midgut clones of transcription factors (TFs) upstream of CG1603 in the network.
(A) Representative images of control RNAi (Ctrl), CG1603 RNAi (CG1603-i), STAT92E RNAi (STAT92E-i), YL-1 RNAi (YL-1-i), Myb RNAi (Myb -i), trem RNAi (trem-i), and E(bx) RNAi (E(bx)-i) midgut ISC/EB clones labeled by mCherry red, with endogenously expressed TFAM-GFP visualized in green. White dashed lines aided in illustrating clones. Scale bars: 10 µm. (B) Quantification of the relative TFAM-GFP level in midgut ISC/EB clones to their wt neighbors for different groups. n=10, error bar: SD. Two-tailed Student's t-test, ***: p<0.001.
Figure 8—figure supplement 2.
Figure 8—figure supplement 2.. Overexpression of CG1603 restored the reduced mitochondrial DNA (mtDNA) level caused by YL-1 RNAi in the eye discs.
Relative mtDNA levels in eye discs of different RNAi groups. n=3, error bar: SD. Two-tailed Student's t-test, *: p<0.05, ***: p<0.001.

Update of

Similar articles

Cited by

References

    1. Acosta-Alvear D, Zhou Y, Blais A, Tsikitis M, Lents NH, Arias C, Lennon CJ, Kluger Y, Dynlacht BD. XBP1 controls diverse cell type- and condition-specific transcriptional regulatory networks. Molecular Cell. 2007;27:53–66. doi: 10.1016/j.molcel.2007.06.011. - DOI - PubMed
    1. Alam TI, Kanki T, Muta T, Ukaji K, Abe Y, Nakayama H, Takio K, Hamasaki N, Kang D. Human mitochondrial DNA is packaged with TFAM. Nucleic Acids Research. 2003;31:1640–1645. doi: 10.1093/nar/gkg251. - DOI - PMC - PubMed
    1. Angelini C, Costa V. Understanding gene regulatory mechanisms by integrating ChIP-seq and RNA-seq data: statistical solutions to biological problems. Frontiers in Cell and Developmental Biology. 2014;2:51. doi: 10.3389/fcell.2014.00051. - DOI - PMC - PubMed
    1. Berger J, Moller DE. The mechanisms of action of PPARs. Annual Review of Medicine. 2002;53:409–435. doi: 10.1146/annurev.med.53.082901.104018. - DOI - PubMed
    1. Boyer LA, Latek RR, Peterson CL. The SANT domain: a unique histone-tail-binding module? Nature Reviews. Molecular Cell Biology. 2004;5:158–163. doi: 10.1038/nrm1314. - DOI - PubMed

MeSH terms

Associated data