. 2025 Feb 5;16(2):e0311524.
doi: 10.1128/mbio.03115-24. Epub 2024 Dec 27.

Pseudovibriamides from Pseudovibrio marine sponge bacteria promote flagellar motility via transcriptional modulation

Affiliations

Pseudovibriamides from Pseudovibrio marine sponge bacteria promote flagellar motility via transcriptional modulation

Yitao Dai et al. mBio. .

Abstract

Pseudovibrio α-Proteobacteria have been repeatedly isolated from marine sponges and proposed to be beneficial to the host. Bacterial motility is known to contribute to host colonization. We have previously identified pseudovibriamides A and B, produced in culture by Pseudovibrio brasiliensis Ab134, and shown that pseudovibriamide A promotes flagellar motility. Pseudovibriamides are encoded in a hybrid nonribosomal peptide synthetase-polyketide synthase gene cluster that also includes several accessory genes. Pseudovibriamide A is a linear heptapeptide and pseudovibriamide B is a nonadepsipeptide derived from pseudovibriamide A. Here, we define the borders of the pseudovibriamides gene cluster, assign function to biosynthetic genes using reverse genetics, and test the hypothesis that pseudovibriamides impact motility by modulating gene transcription. RNA-sequencing transcriptomic analyses of strains having different compositions of pseudovibriamides suggested that both pseudovibriamides A and B affect genes potentially involved in motility, and that a compensatory mechanism is at play in mutants that produce only pseudovibriamide A, resulting in comparable flagellar motility as the wild type. The data gathered suggest that pseudovibriamides A and B have opposite roles in modulating a subset of genes, with pseudovibriamide B having a primary effect in gene activation, and pseudovibriamide A on inhibition. Finally, we observed many differentially expressed genes (up to 29% of the total gene number) indicating that pseudovibriamides have a global effect on transcription that goes beyond motility.IMPORTANCEMarine sponges are found throughout the oceans from tropical coral reefs to polar sea floors, playing crucial roles in marine ecosystems. Pseudovibrio bacteria have been proposed to contribute to sponge health. We have previously shown that pseudovibriamides produced by Pseudovibrio brasiliensis promote bacterial motility, a behavior that is beneficial to bacterial survival and host colonization. The gene cluster that encodes pseudovibriamide biosynthesis is found in two-thirds of Pseudovibrio genomes. This gene cluster is also present in Pseudomonas bacteria that interact with terrestrial plants and animals. Here, we first assign functions to pseudovibriamide biosynthetic genes using reverse genetics. We then show that pseudovibriamides play a major role in transcriptional regulation, affecting up to 29% of P. brasiliensis genes, including motility genes. Thus, this work gives insights into pseudovibriamide biosynthesis and provides evidence that they are signaling molecules relevant to bacterial motility and to other yet-to-be-identified phenotypes.

Keywords: flagellar motility; marine sponge; proteobacteria; secondary metabolite; transcriptomics.


Conflict of interest statement

The authors declare no conflict of interest.

Figures

Fig 1
Fig 1
Organization of the ppp gene cluster from P. brasiliensis Ab134, and proposed biosynthesis of pseudovibriamides A, B, and C. Biosynthetic proposal based on gene knockout results reported in this study. Structural components are color-coded according to genes that encode them. Enzymes proposed to be involved in the biosynthesis of each pseudovibriamide are listed next to the arrows. NRPS, nonribosomal peptide synthetase. PKS, polyketide synthase. See Table S1 for further details on the ppp proteins. Domain key: A, adenylation; ACP/PCP, acyl/peptidyl carrier protein; C, condensation; Cu, ureido-linkage formation condensation domain; CD, dehydration condensation domain; Cy, condensation and heterocyclization; KR, ketoreductase; KS, ketosynthase; Ox, oxidase; TE, thioesterase. Figure adapted from ref (10). The structures of PA and PB have been previously reported (10). PC structures (*) are proposed based on mass spectrometry analyses performed in this study. Genes proposed to be outside the ppp gene cluster are shaded.
Fig 2
Fig 2
Comparison of the production of PA, PB, and PC representatives between the wild type (WT) and mutants. Extracted Ion Chromatograms (EIC) from LC-MS analyses of WT and mutants. (A) PA1. (B) PB1. (C) PC1. Pseudovibriamides-related EIC peaks are marked with red asterisks. Marine broth (MB) extracts were used as negative control. The same mass filter (the expected m/z ± 0.02) was applied to all extracts. The same intensity scale was applied in between strains for each pseudovibriamide. All analyses were performed in at least triplicates.
Fig 3
Fig 3
Comparison of PB and PC production between the WT and the ∆pppK mutant. (A) MALDI-ToF MS analyses. Molecular features for pseudovibriamides are indicated with red asterisks. The peak at m/z 844.2 represents PA1 ([M + H]+); m/z 1156.3, PB1 (Val, [M + H]+); m/z 1170.4, PB2 or PB3 (Ile or Leu, [M + H]+); m/z 1084.4, depropionylated PB1 (dPB1 Val, [M + H]+); and m/z 1098.4, depropionylated PB2 or PB3 (dPB2, Leu, [M + H]+ or dPB3, Ile, [M + H]+). The range from m/z 1050 to 1200 was zoomed in (red box) to show the m/z change of PBs. (B) LC-MS analyses. dPC, depropionylated PC; dPB, depropionylated PB. Extracted Ion Chromatogram (EIC) from left to right: dPCs (Val, [M + H]+, m/z 259.1659; and Leu or Ile, [M + H]+, m/z 273.1818), dPBs (Val, [M + 2H]2+, m/z 542.748; and Leu or Ile, [M + 2H]2+, m/z 549.753). The same mass filter (the expected m/z ± 0.02) was applied to all samples. The predicted structure is listed below each chromatogram. All analyses were performed in at least triplicates.
Fig 4
Fig 4
Effect of ppp gene inactivation on flagellar motility. (A) Swarming assays performed on marine broth with 0.5% Eiken agar. Pictures shown were taken 72  h after inoculation. The assay was performed multiple times, each time in at least triplicates with the WT as the control, and similar results were obtained each time (see Fig. S41 to S49). Representative results are shown. Plates are grouped and boxed based on assays that were run together the same day. Pseudovibriamides are represented by beads: PA, seven black beads; PB, seven black beads and three red beads; PC, three red beads; depropionylated PB, seven black beads, two red beads, and one blue bead; depropionylated PC, two red beads and one blue bead. (B) Growth of strains from top box in panel A as measured by OD600. N = 6. Error bars indicate standard deviation. Note that the apparent reduced swarming of ΔpppG and ΔpppK mutants is in fact due to reduced growth.
Fig 5
Fig 5
Overview of RNA-seq results. (A) Heatmap of gene expression based on Z-scored counts per million (CPM) of the WT (W1-3), ∆pppA (A1-3), ∆pppD (D1-3), and ∆pppE mutant (E1-3). Each column represents one of three replicates. Each row represents one of 5,312 genes. One-way analysis of variance (ANOVA) was used to compare whether four samples’ means are significantly different or not. Values in each row were scaled to CPM mean of the row by using Z-score normalization. (B) Principal component analysis (PCA) of gene expression based on normalized CPM of triplicate samples. Corresponding swarming images at 72 h (duplicated from Fig. 4A for convenience) are shown and pseudovibriamide composition is indicated for each strain. Seven black beads represent PA; seven black beads plus three red beads represent PB; and three red beads represent PC. (C and D) Volcano plots of differentially expressed (DE) genes identified between the WT and ∆pppA and ∆pppD mutants, respectively, using transcripts per million (TPM). FDR, false discovery rate or q-value; FC, fold-change; NDE, non-differential expressed; UP, upregulated; DOWN, downregulated; Blue dots or blue donut portion, downregulated genes; Pink dots or pink donut portion, upregulated genes; and gray dots or gray donut portion, non-differentially expressed genes. The same threshold (dotted lines) was applied to all differential expression analyses, that is, FC ≤ −2 (x = −1) or FC ≥2 (x = 1), and FDR ≤ 0.01 (y = 2). The total number of UP, DOWN, and NDE genes are listed in the donut chart. Labeled genes are TssB, type VI secretion system contractile sheath small subunit; YfcC, Arginine/ornithine antiporter; AqpZ, aquaporin Z; ArcA, arginine deiminase; ArgF, ornithine carbamoyltransferase; BLUF, blue light using flavin domain; T1SS-HlyD, HlyD family type I secretion periplasmic adaptor subunit; BCAA ABC permease, branched-chain amino acid ATP-binding cassette transporter permease; ABC ATP-binding, ATP-binding cassette transporter ATP-binding protein; ABC substrate, ATP-binding cassette transporter substrate binding protein; Heme ABC ATP-binding, heme ATP-binding cassette transporter ATP-binding protein; CheW, chemotaxis protein; and CheR, protein-glutamate O-methyltransferase. Some outstanding dots left unlabeled are hypothetical proteins.
Fig 6
Fig 6
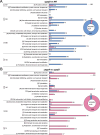
COG classification of DE genes potentially affected by PA and PB. (A) DE genes of ∆pppD mutant compared to the WT. (B) DE genes of ∆pppA mutant compared to the ∆pppD mutant. Blue, downregulated; Pink, upregulated. PC, poorly characterized; CPS, cellular processes and signaling; M, metabolism; and ISP, information storage and processing. The total number of genes in each category is listed.
Fig 7
Fig 7
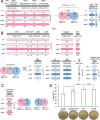
DE genes potentially involved in differential swarming motility. (A) Assumption 1: the ∆pppD mutant may possess the same set of genes unaffected compared to the WT, which are DE in ∆pppA/∆pppE mutants compared to the WT. Filters used for selecting such genes. |∆log2FC|, the absolute difference of log2FC between ∆pppA, or ∆pppE and ∆pppD mutants was set to be larger than or equal to 0.5 to exclude genes with minor variation in differential expression. See Fig. S54A for COG categories. Examples of DE operons are shown, that is, a five-gene operon that is upregulated in theΔpppA/E mutants (subunit, the small subunit of the sodium/solute symporter), and a two-gene operon that is downregulated in theΔpppA/E mutants including MutT CDS (KGB56_20150) and Flp family type IVb pilin CDS (KGB56_20145). Pink, upregulated; blue, downregulated. The darker the pink, the higher the relative expression level. The darker the blue, the lower the relative expression level. TPM values are indicated below genes. (B) Assumption 2: the ∆pppD harnesses different pathways than the WT for promoting swarming motility, resulting in the same observable phenotype. Selected motility genes that are up or downregulated in theΔpppD mutant are shown. Upregulated chemotaxis genes (FDR ≤ 0.01) are denoted with pink asterisks. cheA, chemotaxis histidine protein kinase; cheW, linker protein; cheY, chemotaxis response regulator; cheB, chemotaxis response regulator protein-glutamate methylesterase; cheR, chemotaxis glutamate O-methyltransferase; flbT, flagellar biosynthesis repressor; flgA, flagellar basal body P-ring formation protein; fliI, flagellar biosynthesis type III secretory pathway ATPase; flhB and fliQ, flagellar biosynthesis protein. (C) Filters used for selecting DE genes in ∆pppA/∆pppE mutants that are reversely regulated in the ∆pppD mutant compared to the WT. See Fig. S55 for COG categories. The expression levels (in TPM) of a LuxR family transcriptional regulator CDS (KGB56_18890) are indicated for mutants and the WT. The darker the pink, the higher the expression level. (D) Comparison of swarming areas between the WT, the ∆luxR mutant, the ∆pppE mutant, and the ∆pppE ∆luxR mutant. Individual data points and standard deviation are shown (Table S7). Two-tail P-values from t-test were used to determine statistical significance; *, P-value ≤ 0.05; n.s., not significant. Swarming pictures shown were taken 96  h after inoculation (Fig. S58).

Similar articles

Cited by

References

    1. Carrier TJ, Maldonado M, Schmittmann L, Pita L, Bosch TCG, Hentschel U. 2022. Symbiont transmission in marine sponges: reproduction, development, and metamorphosis. BMC Biol 20:100. doi:10.1186/s12915-022-01291-6 - DOI - PMC - PubMed
    1. Pawlik JR, McMurray SE. 2020. The emerging ecological and biogeochemical importance of sponges on coral reefs. Annu Rev Mar Sci 12:315–337. doi:10.1146/annurev-marine-010419-010807 - DOI - PubMed
    1. de Goeij JM, van Oevelen D, Vermeij MJA, Osinga R, Middelburg JJ, de Goeij AFPM, Admiraal W. 2013. Surviving in a marine desert: the sponge loop retains resources within coral reefs. Science 342:108–110. doi:10.1126/science.1241981 - DOI - PubMed
    1. Pita L, Rix L, Slaby BM, Franke A, Hentschel U. 2018. The sponge holobiont in a changing ocean: from microbes to ecosystems. Microbiome 6:46. doi:10.1186/s40168-018-0428-1 - DOI - PMC - PubMed
    1. Hentschel U, Usher KM, Taylor MW. 2006. Marine sponges as microbial fermenters. FEMS Microbiol Ecol 55:167–177. doi:10.1111/j.1574-6941.2005.00046.x - DOI - PubMed

LinkOut - more resources