. 2024 Dec 14;10(12):829.
doi: 10.3390/gels10120829.

Tunable Alginate-Polyvinyl Alcohol Bioinks for 3D Printing in Cartilage Tissue Engineering

Affiliations

Tunable Alginate-Polyvinyl Alcohol Bioinks for 3D Printing in Cartilage Tissue Engineering

Alexandra Hunter Aitchison et al. Gels. .

Abstract

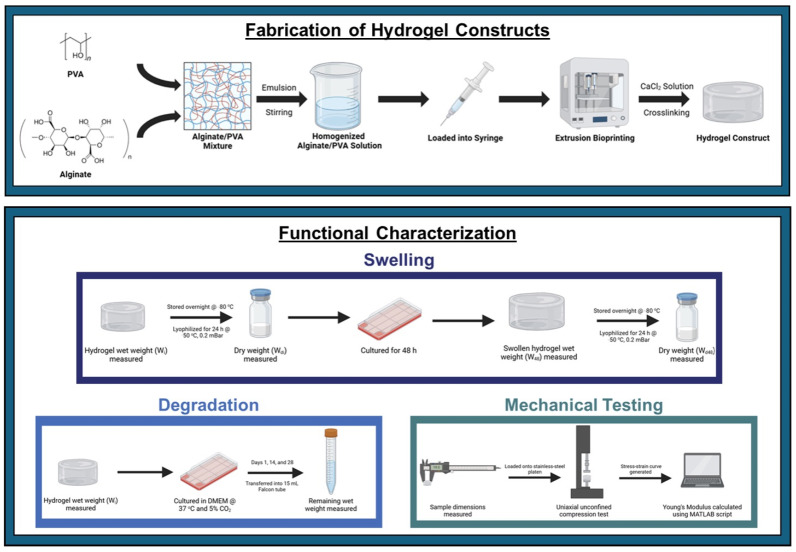
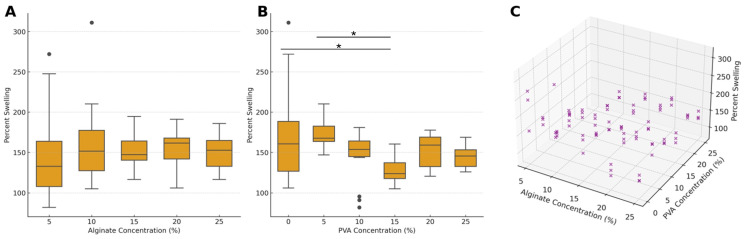
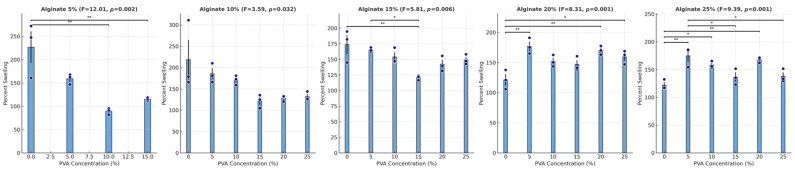
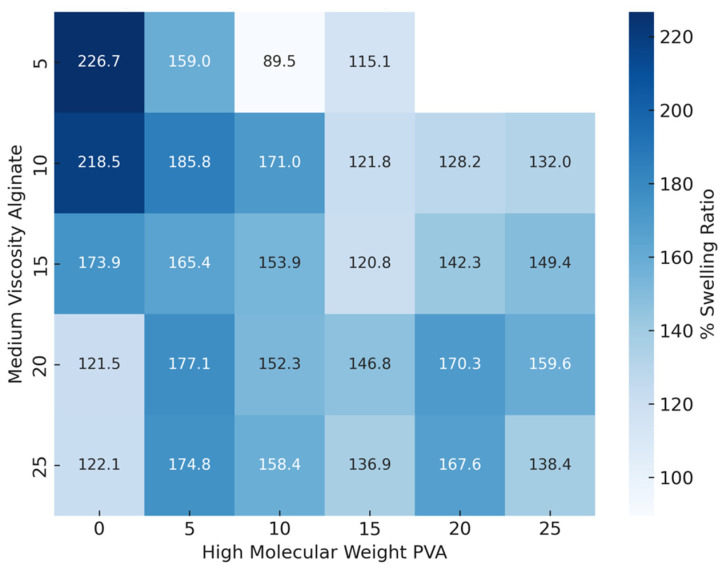
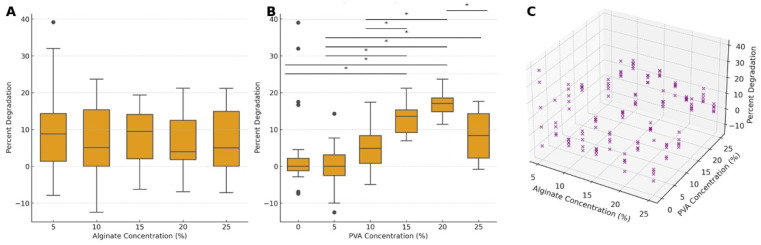
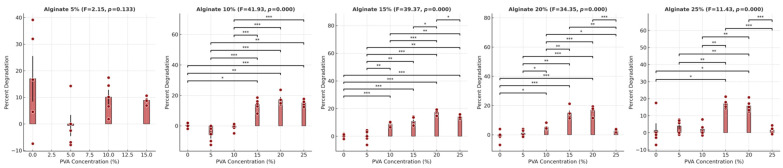
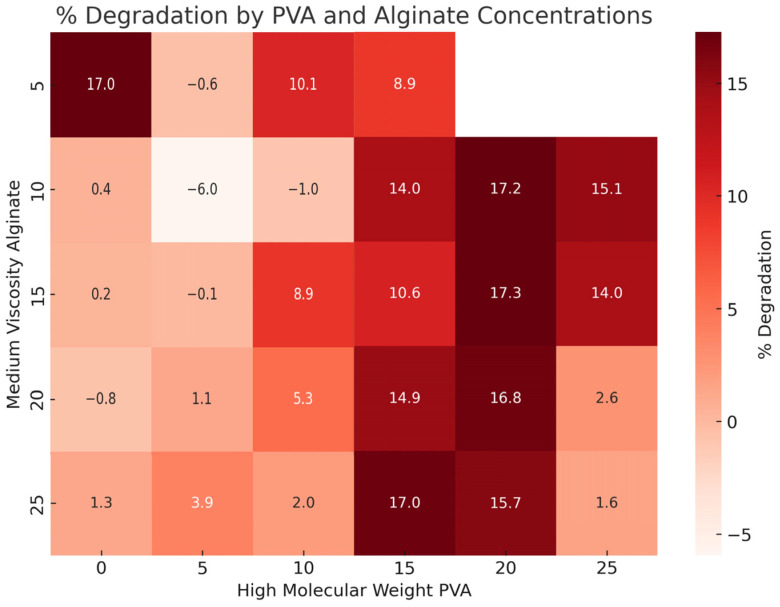
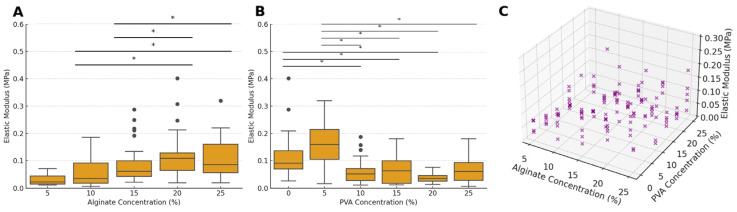
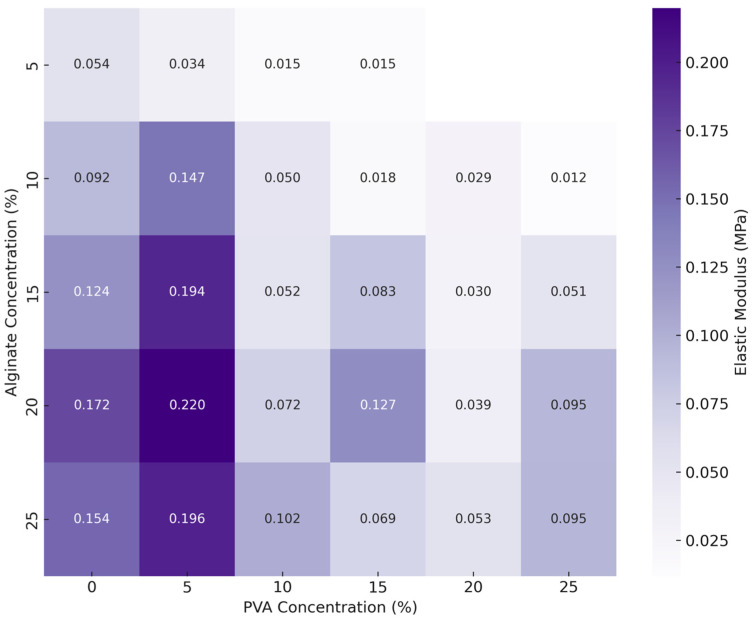
This study investigates 3D extrusion bioinks for cartilage tissue engineering by characterizing the physical properties of 3D-printed scaffolds containing varying alginate and polyvinyl alcohol (PVA) concentrations. We systematically investigated the effects of increasing PVA and alginate concentrations on swelling, degradation, and the elastic modulus of printed hydrogels. Swelling decreased significantly with increased PVA concentrations, while degradation rates rose with higher PVA concentrations, underscoring the role of PVA in modulating hydrogel matrix stability. The highest elastic modulus value was achieved with a composite of 5% PVA and 20% alginate, reaching 0.22 MPa, which approaches that of native cartilage. These findings demonstrate that adjusting PVA and alginate concentrations enables the development of bioinks with tailored physical and mechanical properties, supporting their potential use in cartilage tissue engineering and other biomedical applications.

Keywords: 3D bioprinting; 3D scaffold; PVA; alginate; bioink; cartilage; hydrogel; matrix; polyvinyl alcohol; tissue engineering.


Conflict of interest statement

The authors declare no conflicts of interest.

Figures

Figure 1
Figure 1
Schematic overview of hydrogel fabrication and functional characterization. The top panel illustrates the process of hydrogel synthesis, combining bioprinting technology and crosslinking to produce stable constructs. The bottom panel summarizes the key methods used to evaluate hydrogel performance, including swelling behavior, mechanical properties, and degradation over time.
Figure 2
Figure 2
Percent swelling behavior of hydrogel samples in response to varying concentrations of alginate and PVA. (A) Box-and-whisker plots showing percent swelling across different alginate concentrations. The boxes represent the interquartile range (IQR), the lines indicate the median, whiskers extend to the data range, and individual data points displayed as circles are outliers. (B) Box-and-whisker plots showing percent swelling across different PVA concentrations, with statistical significance indicated between specific pairs of PVA concentrations. (C) Three-dimensional scatter plot illustrating the combined effect of alginate and PVA concentrations on percent swelling, providing an integrated view of their joint impact on swelling behavior. Asterisks denote statistical significance: * p < 0.05.
Figure 3
Figure 3
Percent swelling of hydrogel samples at varying concentrations of PVA with fixed alginate concentrations. Bar graphs represent mean percent swelling at different PVA concentrations for each specified alginate concentration. Error bars indicate the standard error of the mean (SEM). Individual data points are overlaid as navy circles, showing variability within each concentration group. Statistical significance between selected PVA concentration pairs is indicated by asterisks above the bars, with the following notation: * p < 0.05, ** p < 0.01, ANOVA F-statistic and p-value for each alginate concentration level are included in the title of each panel, highlighting significant differences in percent swelling across PVA concentrations within each fixed alginate concentration level.
Figure 4
Figure 4
Heatmap displaying the 48-h percent swelling ratio of hydrogel samples across varying concentrations of high-molecular-weight PVA and medium-viscosity alginate. The color intensity corresponds to the swelling ratio, with darker blue shades representing higher swelling percentages. Each cell is annotated with the mean swelling ratio (%) for the corresponding combination of PVA and alginate concentrations. This visualization highlights the inverse relationship between PVA concentration and swelling, as higher PVA levels generally correspond to lower swelling ratios, particularly at lower alginate concentrations.
Figure 5
Figure 5
Percent degradation of constructs after 28 days in culture in response to varying concentrations of alginate and PVA. Box-and-whisker plots show percent degradation across alginate concentrations (A) and PVA concentrations (B), with boxes representing the interquartile range (IQR), and the lines indicating the median. Whiskers extend to the data range, and individual data points displayed as circles are outliers. A 3D scatter plot (C) illustrates the combined effects of alginate and PVA concentrations on percent degradation, offering an integrated view of their joint impact on material degradation. Asterisks denote statistical significance: * p < 0.05.
Figure 6
Figure 6
Percent degradation of hydrogel samples after 28 days, shown across varying PVA concentrations with fixed alginate concentrations. Each bar represents the mean degradation percentage for a given PVA concentration at a fixed alginate level. Error bars represent the standard error of the mean (SEM), and individual data points are displayed as circles, providing insights into data spread and individual variation. Statistical significance between selected PVA concentration pairs is indicated by asterisks above the bars, with * p < 0.05, ** p < 0.01, and *** p < 0.001. ANOVA F-statistic and p-value are included in each panel title, highlighting significant differences in degradation across PVA concentrations within each fixed alginate concentration level.
Figure 7
Figure 7
Heatmap displaying the percent degradation of hydrogel samples after 28 days across varying concentrations of high-molecular-weight PVA and medium-viscosity alginate. The color intensity corresponds to the degradation percentage, with darker red shades representing higher degradation levels. Each cell is annotated with the mean degradation percentage (%) for the respective combination of PVA and alginate concentrations.
Figure 8
Figure 8
Elastic modulus behavior of hydrogel samples in response to varying alginate and PVA concentrations. (A) Box-and-whisker plots of modulus values across alginate concentrations, with boxes representing the interquartile range (IQR), the lines indicating the median, and whiskers extending to the data range, with outliers represented as individual data points. (B) Box-and-whisker plots of modulus values across different PVA concentrations, with significant differences between specific PVA concentrations. (C) Three-dimensional scatter plot illustrating the combined effect of alginate and PVA concentrations on modulus, offering an integrated view of their joint impact on mechanical properties. Asterisks denote statistical significance: * p < 0.05.
Figure 9
Figure 9
Heatmap of elastic modulus by PVA and alginate concentrations. This heatmap illustrates the elastic modulus (MPa) of constructs at varying concentrations of PVA and alginate, as determined by compression testing. Each cell represents the mean elastic modulus for a specific combination of PVA and alginate concentrations, with values shown to three decimal places. Darker shades of purple indicate higher elastic modulus values, signifying stronger constructs.
Figure 10
Figure 10
Schematic representation of the bioprinting process for alginate–PVA hydrogel constructs. From left to right: (1) Three-dimensional model of the cylindrical construct designed for bioprinting; (2) slicing of the 3D model to create a 50% gyroid infill pattern; (3) extrusion of the hydrogel bioink in the specified design; (4) final printed hydrogel construct after crosslinking. Scale bar represents 1 mm.
Figure 11
Figure 11
Uniaxial unconfined compression testing setup. A cylindrical 3D bioprinted hydrogel sample is positioned between stainless-steel compression platens in the mechanical testing machine. The close-up inset shows the hydrogel sample’s gyroid infill structure with a scale for size reference. True measurements of the hydrogels were performed using digital calipers prior to compression testing.

Similar articles

Cited by

References

    1. Asy-Syifa N., Kusjuriansah, Waresindo W.X., Edikresnha D., Suciati T., Khairurrijal K. The Study of the Swelling Degree of the PVA Hydrogel with Varying Concentrations of PVA. J. Phys. Conf. Ser. 2022;2243:012053. doi: 10.1088/1742-6596/2243/1/012053. - DOI
    1. Wang F., Wen Y., Bai T. The Composite Hydrogels of Polyvinyl Alcohol–Gellan Gum-Ca2+ with Improved Network Structure and Mechanical Property. Mater. Sci. Eng. C. 2016;69:268–275. doi: 10.1016/j.msec.2016.06.084. - DOI - PubMed
    1. Bichara D.A., Zhao X., Hwang N.S., Bodugoz-Senturk H., Yaremchuk M.J., Randolph M.A., Muratoglu O.K. Porous Poly(Vinyl Alcohol)-Alginate Gel Hybrid Construct for Neocartilage Formation Using Human Nasoseptal Cells. J. Surg. Res. 2010;163:331–336. doi: 10.1016/j.jss.2010.03.070. - DOI - PubMed
    1. Yuan F., Ma M., Lu L., Pan Z., Zhou W., Cai J., Luo S., Zeng W., Yin F. Preparation and Properties of Polyvinyl Alcohol (PVA) and Hydroxylapatite (HA) Hydrogels for Cartilage Tissue Engineering. Cell Mol. Biol. 2017;63:32–35. doi: 10.14715/cmb/2017.63.5.7. - DOI - PubMed
    1. Lee K.Y., Mooney D.J. Alginate: Properties and Biomedical Applications. Prog. Polym. Sci. 2012;37:106. doi: 10.1016/j.progpolymsci.2011.06.003. - DOI - PMC - PubMed

LinkOut - more resources