. 2024 Dec 10;14(12):605.
doi: 10.3390/bios14120605.

Development of a Novel Colorimetric pH Biosensor Based on A-Motif Structures for Rapid Food Freshness Monitoring and Spoilage Detection

Affiliations

Development of a Novel Colorimetric pH Biosensor Based on A-Motif Structures for Rapid Food Freshness Monitoring and Spoilage Detection

Jiajia Wang et al. Biosensors (Basel). .

Abstract

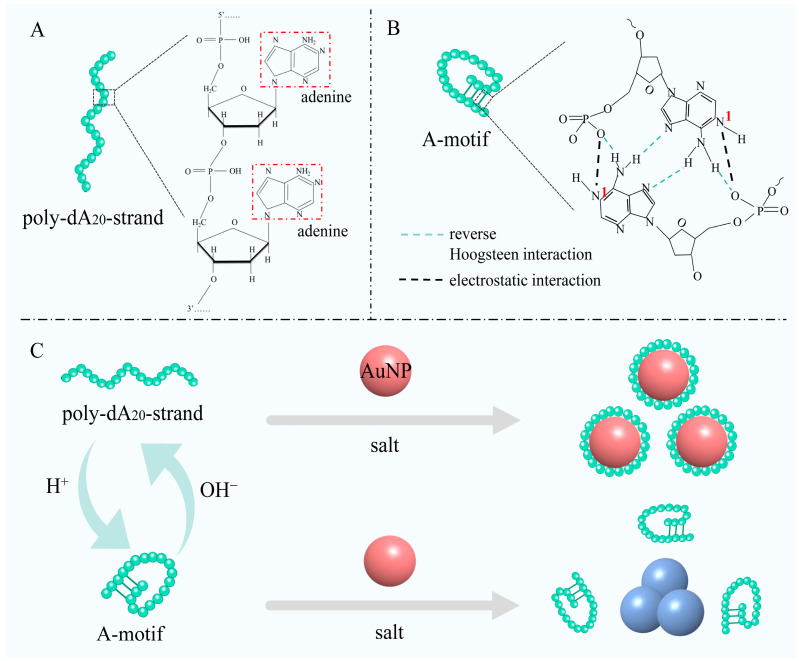
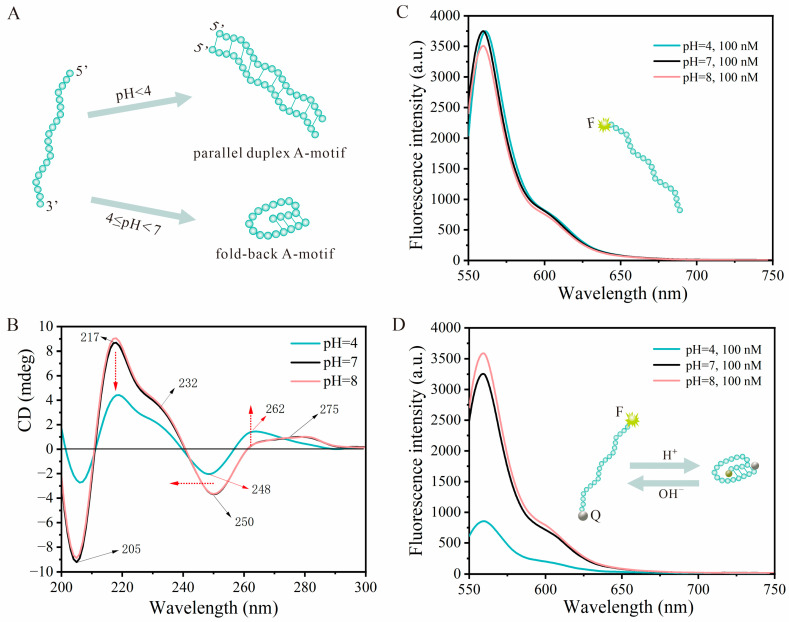
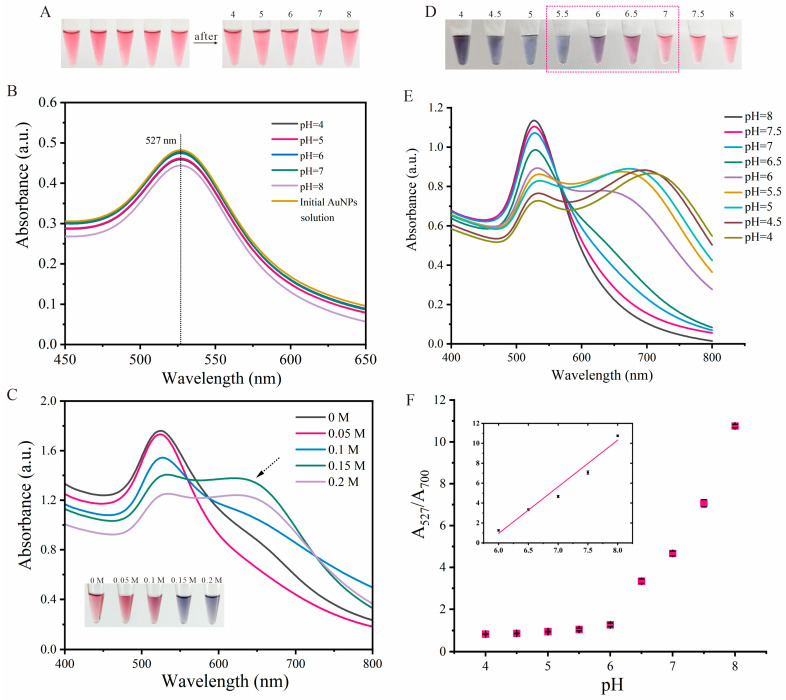
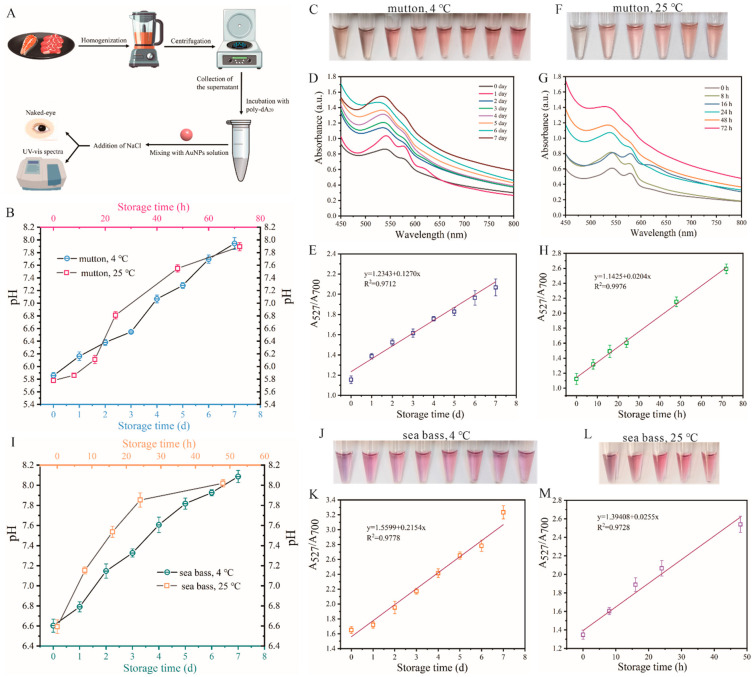
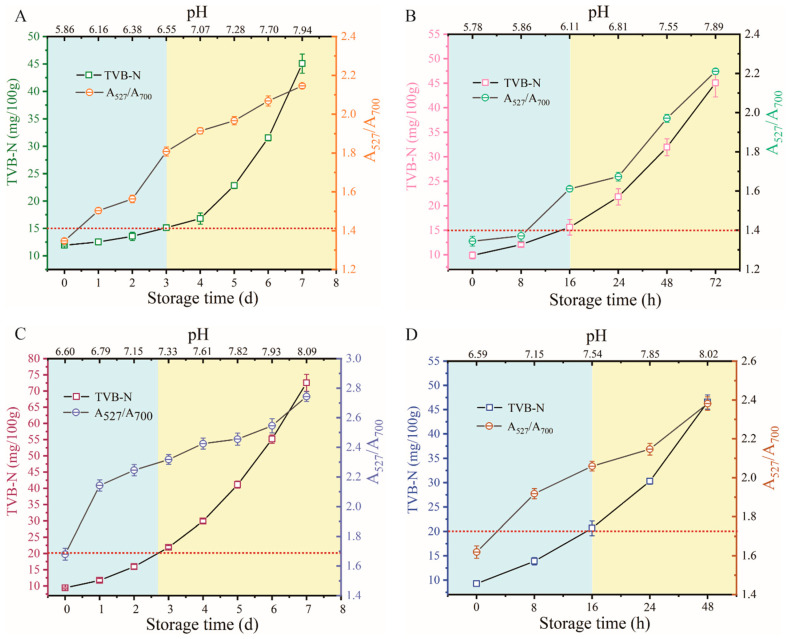
Accurate methods for assessing food freshness through colorimetric pH response play a critical role in determining food spoilage and ensuring food quality standards. This study introduces a novel unlabeled DNA sequence, poly-dA20, designed to exploit the colorimetric properties of both the single strand and the fold-back A-motif structure in conjunction with gold nanoparticles (AuNPs) under varying pH conditions. When exposed to storage temperatures of 4 °C and 25 °C, the color variations in the AuNP solution, influenced by pH level changes in mutton and sea bass samples' different storage periods, are easily discernible to the naked eye within a minute. The ratio of UV absorption values at 527 nm and 700 nm (A527/A700) demonstrates a strong linear correlation with both the storage duration and pH of the food samples. Furthermore, a comprehensive analysis combining the total volatile basic nitrogen (TVB-N) value with the A527/A700 ratio is employed for precise assessment of food freshness. The innovative pH-responsive sensing strategy not only provides a new approach for on-site food freshness and spoilage detection systems but also serves as a valuable tool for pH-related biological detection in clinical diagnostic applications.

Keywords: A-motif; colorimetric detection strategy; food safety; pH-responsive DNA nanostructures; smart biosensor.


Conflict of interest statement

The authors declare no conflicts of interest.

Figures

Figure 1
Figure 1
(A) Schematic diagram of a short oligonucleotide sequence composed of homopolymeric deoxyadenosines, where structural units consisting of phosphate groups, deoxyribose, and adenine are linked via phosphodiester bonds. (B) shown the folding structure of A-motif caused by the base pairing scheme in AH+ -H+A base pairs comprising protonated adenosines. Red 1 represents the N1 protonated site on adenines. (C) Schematic diagram of colorimetric biosensing strategy based on A-motif structure.
Figure 2
Figure 2
(A) Schematic diagram of the transformation of the poly-dA20 strand from a random coil state to two distinct A-motif structures at varying pH conditions (pH < 4 and 4 ≤ pH < 7). (B) Circular dichroism results of the poly-dA20 probes under different pH conditions. The red dotted arrows represent the trend of the CD spectrum as pH decreases from 7 to 4. (C) Fluorescence spectra of Cy3-DNA probes at a concentration of 100 nM under varying pH conditions (pH = 4, 7, and 8). The insert diagram illustrates the structure of the Cy3-poly-dA20 strand. (D) Fluorescence spectra of Cy3-A20 probes labeled with quenched (Q) groups, BHQ2, at a concentration of 100 nM in different pH environments (pH = 4, 7, and 8). The insert diagram illustrates the structural transformation of the F-A20-Q probes in response to acidic and alkaline environments.
Figure 3
Figure 3
(A) Visual images before and after the introduction of poly-dA20 chains into AuNPs solutions under varying pH conditions. (B) UV–vis absorption spectra of poly-dA20/AuNPs mixed solutions at different pH levels. (C) UV–vis absorption spectra of AuNPs at various final concentrations of NaCl. Insert: Visual images of AuNPs at various final NaCl concentrations. (D) Visual color variations in poly-dA20/AuNPs system at different pH values after introducing a final concentration of 0.15 M NaCl. (E) UV–vis absorption spectra of poly-dA20/AuNPs system at different pH values after introducing a final concentration of 0.15 M NaCl. (F) Plot of the absorption ratio (A527/A700) at different pH values. Insert: a locally linear relationship between absorbance ratio and pH value from pH 6.0 to 8.0. The error bars represent the standard deviation of three measurements.
Figure 4
Figure 4
(A) Schematic diagram of sample handling process for mutton and sea bass. (B) The time–pH curve of mutton during storage at 4 °C and 25 °C. (C) Visual images of AuNP colorimetric pH sensor based on A-motif to mutton samples stored at 4 °C for different days. The images depict the progression of 0, 1, 2, 3, 4, 5, 6, and 7 days from left to right. (D) UV–vis absorption spectra of mutton samples stored for different days at 4 °C using A-motif colorimetric pH sensing system. (E) The linear correlation between the storage time of mutton samples at 4 °C and the A527/A700 ratio using the colorimetric sensing system. (F) Visual images of AuNPs colorimetric pH sensor based on A-motif to mutton samples stored at 25 °C for different hours. The images depict the progression of 0, 8, 16, 24, 48, and 72 h from left to right. (G) UV–vis absorption spectra of mutton samples stored for different hours at 25 °C using A-motif colorimetric pH sensing system. (H) The linear correlation between the storage time of mutton samples at 25 °C and the A527/A700 ratio using the colorimetric sensing system. (I) The time–pH curve of sea bass during storage at 4 °C and 25 °C. (J) Visual images of AuNP colorimetric pH sensor based on A-motif to sea bass samples stored at 4 °C for different days. The images depict the progression of 0, 1, 2, 3, 4, 5, 6, and 7 days from left to right. (K) The linear correlation between the storage time of sea bass samples at 4 °C and the A527/A700 ratio using the colorimetric sensing system. (L) Visual images of AuNPs colorimetric pH sensor based on A-motif to sea bass samples stored at 25 °C for different hours. The images depict the progression of 0, 8, 16, 24, and 48 h from left to right. (M) The linear correlation between the storage time of sea bass samples at 25 °C and the A527/A700 ratio using the colorimetric sensing system.
Figure 5
Figure 5
(A) Variations in TVB-N values and A527/A700 ratios in mutton samples over preservation time and different pH values during storage at 4 °C. (B) Variations in TVB-N values and A527/A700 ratios in mutton samples over preservation time and different pH values during storage at 25 °C. (C) Variations in TVB-N values and A527/A700 ratios in sea bass samples over preservation time and different pH values during storage at 4 °C. (D) Variations in TVB-N values and A527/A700 ratios in sea bass samples over preservation time and different pH values during storage at 25 °C. The red dashed lines correspond to the threshold TVB-N values, set at 15 mg/100 g for mutton samples and 20 mg/100 g for sea bass samples. The blue area signifies the fresh stage of the food sample, while the yellow area indicates the spoilage stage of the food sample.

Similar articles

Cited by

References

    1. Sonwani E., Bansal U., Alroobaea R., Baqasah A.M., Hedabou M. An Artificial Intelligence Approach Toward Food Spoilage Detection and Analysis. Front. Public Health. 2022;9:816226. doi: 10.3389/fpubh.2021.816226. - DOI - PMC - PubMed
    1. Koutsoumanis K., Tsaloumi S., Aspridou Z., Tassou C., Gougouli M. Application of Quantitative Microbiological Risk Assessment (QMRA) to food spoilage: Principles and methodology. Trends Food Sci. Technol. 2021;114:189–197. doi: 10.1016/j.tifs.2021.05.011. - DOI
    1. Ishangulyyev R., Kim S., Lee S.H. Understanding Food Loss and Waste—Why Are We Losing and Wasting Food? Foods. 2019;8:297. doi: 10.3390/foods8080297. - DOI - PMC - PubMed
    1. Kim K.H., Moon D., An J.E., Park S.J., Seo S.E., Ha S., Kim J., Kim K., Phyo S., Lee J., et al. Wireless portable bioelectronic nose device for multiplex monitoring toward food freshness/spoilage. Biosens. Bioelectron. 2022;215:114551. doi: 10.1016/j.bios.2022.114551. - DOI - PubMed
    1. Chakraborty M., Sivasakthi P., Samanta P.K., Chakravarty M. Concentration-tuned diverse response to selective biogenic amines using a reusable fluorophore: Monitoring protein-rich food spoilage. J. Mater. Chem. B. 2024;12:2746–2760. doi: 10.1039/D3TB02569A. - DOI - PubMed

LinkOut - more resources