

P300 Latency with Memory Performance: A Promising Biomarker for Preclinical Stages of Alzheimer's Disease
- PMID: 39727881
- PMCID: PMC11674962
- DOI: 10.3390/bios14120616
P300 Latency with Memory Performance: A Promising Biomarker for Preclinical Stages of Alzheimer's Disease
Abstract
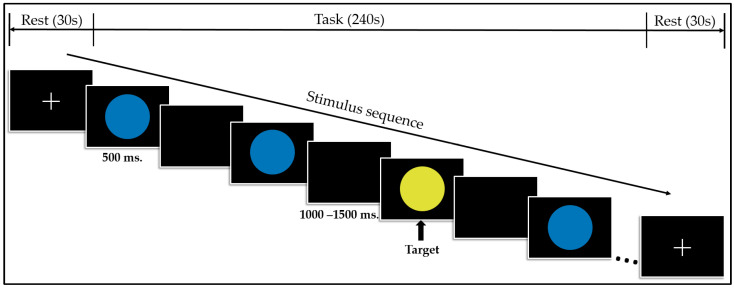
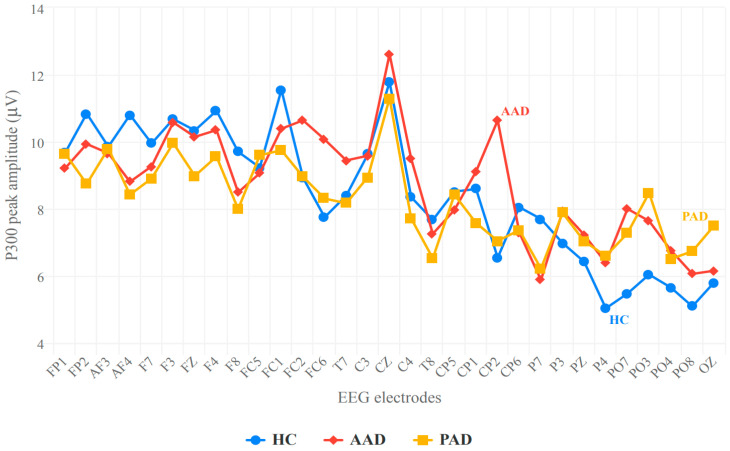
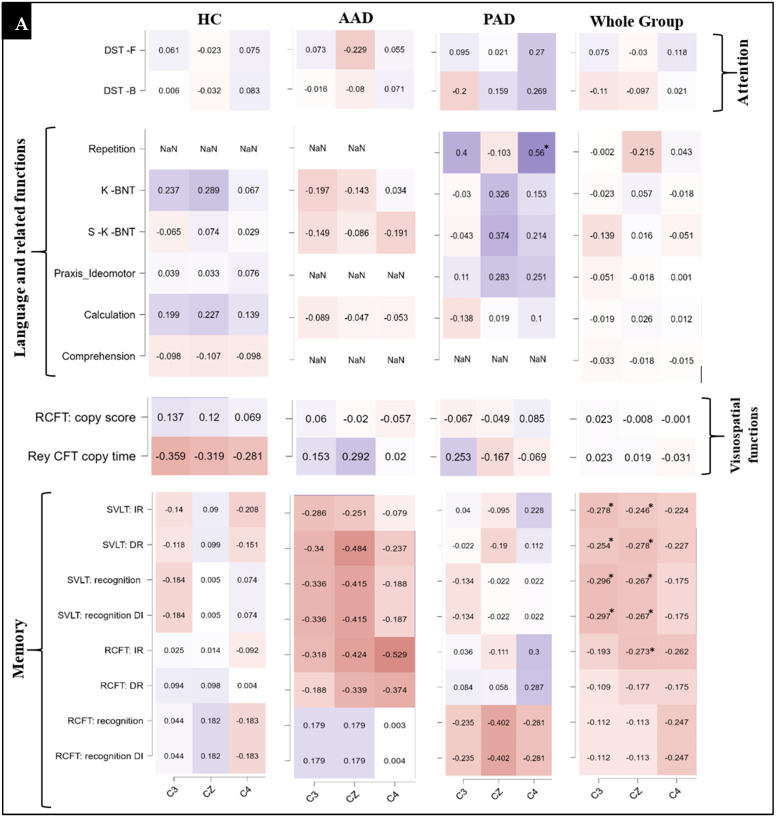
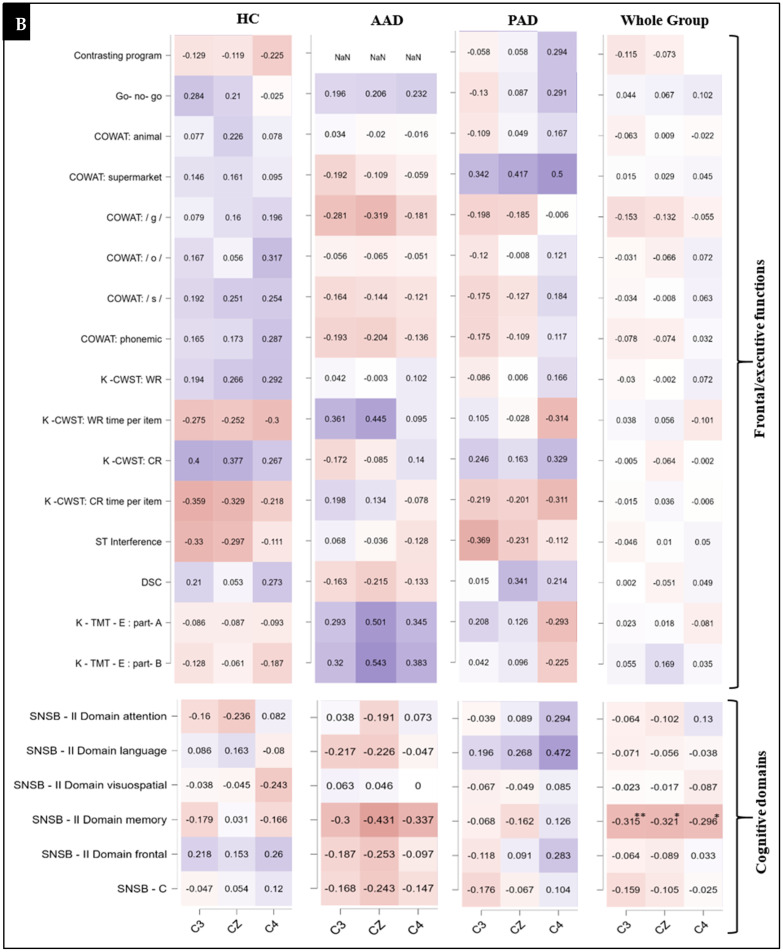
Detecting and tracking the preclinical stages of Alzheimer's disease (AD) is now of particular interest due to the aging of the world's population. AD is the most common cause of dementia, affecting the daily lives of those afflicted. Approaches in development can accelerate the evaluation of the preclinical stages of AD and facilitate early treatment and the prevention of symptom progression. Shifts in P300 amplitude and latency, together with neuropsychological assessments, could serve as biomarkers in the early screening of declines in cognitive abilities. In this study, we investigated the ability of the P300 indices evoked during a visual oddball task to differentiate pre-clinically diagnosed participants from normal healthy adults (HCs). Two preclinical stages, named asymptomatic AD (AAD) and prodromal AD (PAD), were included in this study, and a total of 79 subjects participated, including 35 HCs, 22 AAD patients, and 22 PAD patients. A mixed-design ANOVA test was performed to compare the P300 indices among groups during the processing of the target and non-target stimuli. Additionally, the correlation between these neurophysiological variables and the neuropsychological tests was evaluated. Our results revealed that neither the peak amplitude nor latency of P300 can distinguish AAD from HCs. Conversely, the peak latency of P300 can be used as a biomarker to differentiate PAD from AAD and HCs. The correlation results revealed a significant relationship between the peak latency of P300 and memory domain tasks, showing that less time-demanding neuropsychological assessments can be used. In summary, our findings showed that a combination of P300 latency and memory-requiring tasks can be used as an efficient biomarker to differentiate individuals with AAD from HCs.
Keywords: EPR; P300; asymptomatic AD; early screening; neuropsychology; prodromal AD.
Conflict of interest statement
The authors declare no conflicts of interest.
Figures


Similar articles
-
Neuropsychological correlates of the P300 in patients with Alzheimer's disease.Prog Neuropsychopharmacol Biol Psychiatry. 2013 Jan 10;40:62-9. doi: 10.1016/j.pnpbp.2012.08.009. Epub 2012 Aug 23. Prog Neuropsychopharmacol Biol Psychiatry. 2013. PMID: 22940475
-
Evaluation of P300 components for emotion-loaded visual event-related potential in elderly subjects, including those with dementia.Psychiatry Clin Neurosci. 2014 Jul;68(7):558-67. doi: 10.1111/pcn.12162. Epub 2014 Apr 13. Psychiatry Clin Neurosci. 2014. PMID: 24447302
-
Associations of event-related brain potentials and Alzheimer's disease severity: A longitudinal study.Prog Neuropsychopharmacol Biol Psychiatry. 2019 Jun 8;92:31-38. doi: 10.1016/j.pnpbp.2018.12.013. Epub 2018 Dec 22. Prog Neuropsychopharmacol Biol Psychiatry. 2019. PMID: 30582941
-
Alzheimer's disease and P300: review and evaluation of task and modality.Curr Alzheimer Res. 2005 Dec;2(5):515-25. doi: 10.2174/156720505774932214. Curr Alzheimer Res. 2005. PMID: 16375655 Review.
-
Predictive Power of Cognitive Biomarkers in Neurodegenerative Disease Drug Development: Utility of the P300 Event-Related Potential.Neural Plast. 2022 Nov 8;2022:2104880. doi: 10.1155/2022/2104880. eCollection 2022. Neural Plast. 2022. PMID: 36398135 Free PMC article. Review.
Cited by
-
Assessing the Role of EEG Biosignal Preprocessing to Enhance Multiscale Fuzzy Entropy in Alzheimer's Disease Detection.Biosensors (Basel). 2025 Jun 10;15(6):374. doi: 10.3390/bios15060374. Biosensors (Basel). 2025. PMID: 40558456 Free PMC article.
-
Neurotechnological Approaches to Cognitive Rehabilitation in Mild Cognitive Impairment: A Systematic Review of Neuromodulation, EEG, Virtual Reality, and Emerging AI Applications.Brain Sci. 2025 May 28;15(6):582. doi: 10.3390/brainsci15060582. Brain Sci. 2025. PMID: 40563754 Free PMC article. Review.
-
Cognitive Potential Characteristics and Brain Network Dynamics in Patients with Acute Cerebellar Ischemic Stroke: Insights from P300 and Moving Dipoles.Cerebellum. 2025 Jul 4;24(5):121. doi: 10.1007/s12311-025-01872-5. Cerebellum. 2025. PMID: 40613998 No abstract available.
References
-
- Alzheimer’s Association 2018 Alzheimer’s disease facts and figures. Alzheimer’s Dement. 2018;14:367–429. doi: 10.1016/j.jalz.2018.02.001. - DOI
-
- Alzheimer’s Association 2019 Alzheimer’s disease facts and figures. Alzheimer’s Dement. 2019;15:321–387. doi: 10.1016/j.jalz.2019.01.010. - DOI
-
- O’connor A., Weston P.S.J., Pavisic I.M., Ryan N.S., Collins J.D., Lu K., Crutch S.J., Alexander D.C., Fox N.C., Oxtoby N.P. Quantitative detection and staging of presymptomatic cognitive decline in familial Alzheimer’s disease: A retrospective cohort analysis. Alzheimer’s Res. Ther. 2020;12:126. doi: 10.1186/s13195-020-00695-2. - DOI - PMC - PubMed
MeSH terms
Substances
Grants and funding
LinkOut - more resources
Full Text Sources
Medical
Miscellaneous
