Review
. 2024 Dec 19;14(12):627.
doi: 10.3390/bios14120627.

Nanopipettes as a Potential Diagnostic Tool for Selective Nanopore Detection of Biomolecules

Affiliations
Review

Nanopipettes as a Potential Diagnostic Tool for Selective Nanopore Detection of Biomolecules

Regina M Kuanaeva et al. Biosensors (Basel). .

Abstract

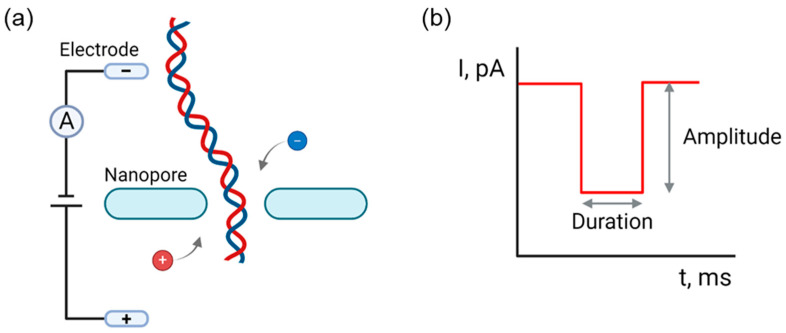
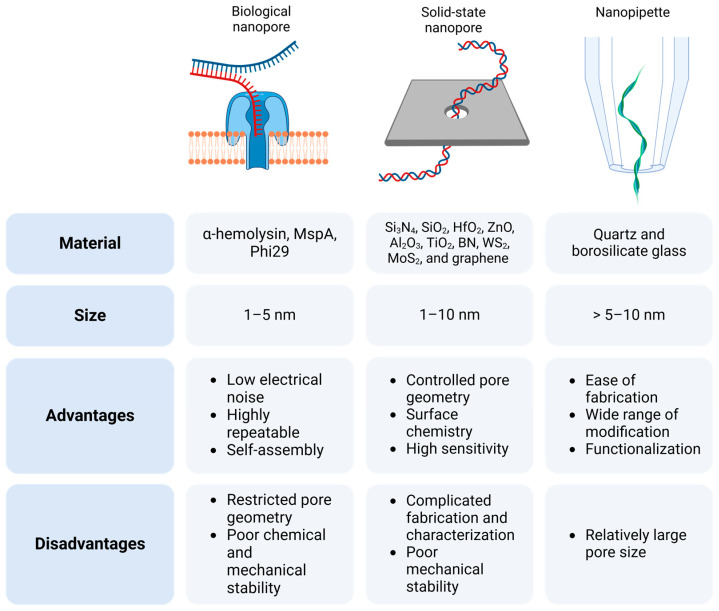
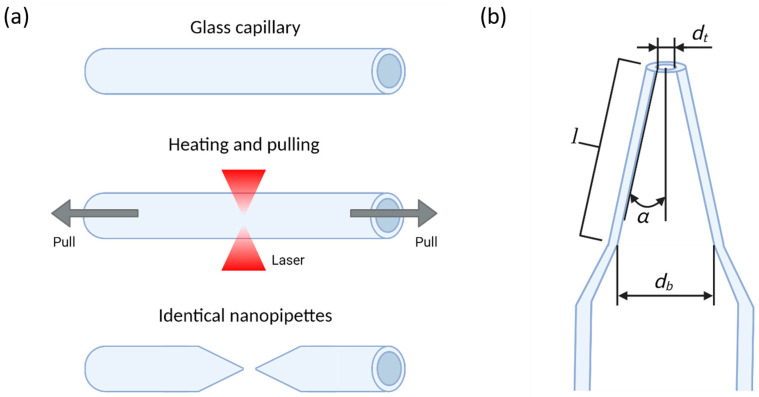
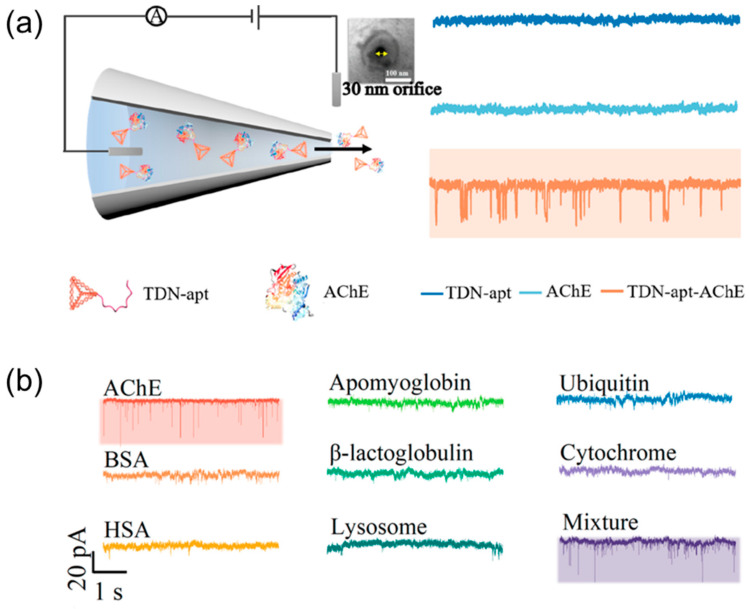
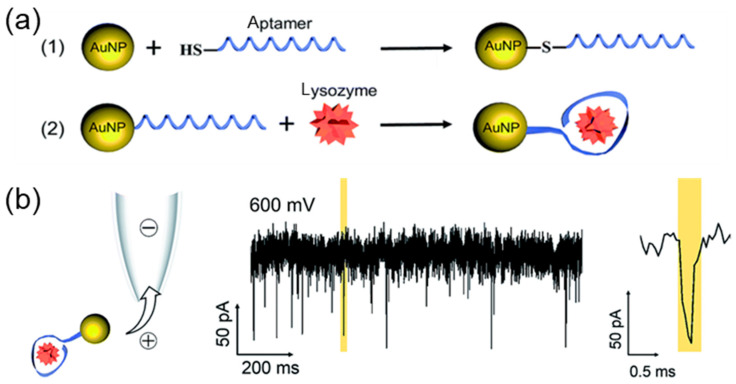
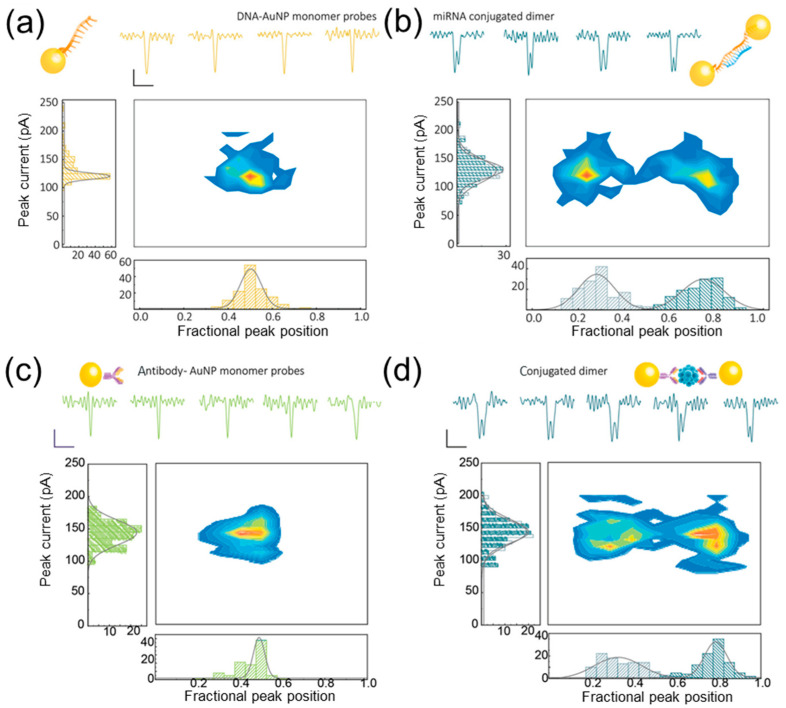
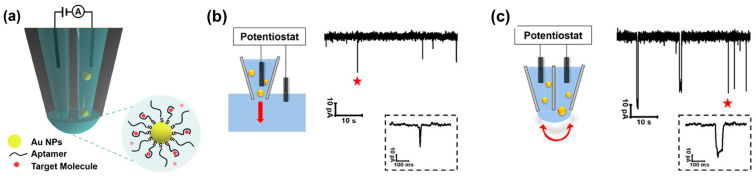
Nanopipettes, as a class of solid-state nanopores, have evolved into universal tools in biomedicine for the detection of biomarkers and different biological analytes. Nanopipette-based methods combine high sensitivity, selectivity, single-molecule resolution, and multifunctionality. The features have significantly expanded interest in their applications for the biomolecular detection, imaging, and molecular diagnostics of real samples. Moreover, the ease of manufacturing nanopipettes, coupled with their compatibility with fluorescence and electrochemical methods, makes them ideal for portable point-of-care diagnostic devices. This review summarized the latest progress in nanopipette-based nanopore technology for the detection of biomarkers, DNA, RNA, proteins, and peptides, in particular β-amyloid or α-synuclein, emphasizing the impact of technology on molecular diagnostics. By addressing key challenges in single-molecule detection and expanding applications in diverse biological areas, nanopipettes are poised to play a transformative role in the future of personalized medicine.

Keywords: molecular diagnostics; nanopipette; nanopore; single molecule; solid-state nanopore.


Conflict of interest statement

The authors declare no conflicts of interest.

Figures

Figure 1
Figure 1
Nanopore detection. (a) Experimental principle of nanopore detection. Two baths filled with an electrolyte solution, typically a buffered salt solution, are separated by a single nanopore (or nanopipette). Ag/AgCl electrodes are immersed in the bath and a constant voltage bias is applied across the nanopore. When a molecule translocates through the nanopore, the ionic current typically decreases. (b) Characteristics of translocation event. The amplitude and duration (dwell time) of the current reduction during translocation can provide critical insights about biomolecules. Created with Biorender.com.
Figure 2
Figure 2
Comparison of biological-, solid-state-, and nanopipette-based nanopores: key materials, advantages, and limitations. Created with Biorender.com.
Figure 3
Figure 3
Schematic representation of nanopipette fabrication and characterization. (a) Process of pulling a nanopipette. (b) Characteristics of the nanopipette, where l is the pore length, db and dt are the base and tip diameters of the truncated cone, and α is the half-cone angle. Created with Biorender.com.
Figure 4
Figure 4
Translocations of DNA origami. (a) Schematic representation of the concept of ECS. (b) ECS as a function of the DNA origami surface area for the four DNA nanostructure assembled. (c) ECS histograms of the DNA origami samples; from left to right: monomer sample, dimer sample, trimer sample, and 2 × 2 sample. Reproduced with permission from [90]. Copyright 2022, Biophysical Society.
Figure 5
Figure 5
Actin dynamics and its interaction with actin-binding drugs. (a) Schematic of experimental setup of protein detection using nanopipette-based nanopore. (b) (Left) protein models (actin with Latrunculin B bound, and actin with Swinholide A bound). (Right) typical current traces for actin bound to different filament inhibitors at 250 mV. (c) Scatterplots of current blockades vs. dwell times for both actin monomers and dimers with the same scale at 250 mV. Reproduced from [95] with permission from the Royal Society of Chemistry.
Figure 6
Figure 6
Nanopipette-based nanopore detection of glycoprotein. (a) Schematic illustration of the label-free monitoring of single-molecule glycoprotein−boronate affinity. Interaction via a 4-MPBA-modified nanopipette. (b) Current−time trace for the presence of 1 nM IgG in 100 mM KCl at +400 mV, (I) translocation of IgG molecules that do not interact with 4-MPBA, (II) translocation of IgG molecules interacted with 4-MPBA. (c) Two-dimensional contour plot of ΔI/I0 vs. log(dwell time) of the single-IgG current blockade events. (d,e) Histograms showing the distributions of the logarithmic dwell time (d) and ΔI/I0 (e). Red and blue indicate type I and type II signals, respectively. (f) Linear fit plot of the blockade event frequency (type II) and IgG concentrations from 0.02 to 5 nM. (g) Blockade event frequency (type II) of the selective detection of IgG in a blank solution, 1 nM IgG, and 1 nM IgG with different coexisting proteins 1 μM BSA, 1 μM SA, 1 μM LZ, 1 nM AFP, and 1 nM HRP. Reproduced with permission from [105]. Copyright 2022, American Chemical Society.
Figure 7
Figure 7
Scheme of an aptamer-functionalized nexFET sensor. (a) Double-barrel quartz nanopipette: one barrel is hollow with a nanopore, while the other is filled with pyrolytic carbon. The pipette tip is coated with a thin carbon layer and features a core of PPy and a PPy–aptamer shell. (b) In the absence of a gate voltage, the core is positively charged, and the shell is slightly negatively charged, resulting in limited target protein binding. (c) Applying a positive gate voltage (VG = 400 mV) enhances the selective thrombin detection, increasing throughput and SNR. Reproduced from [108]. Copyright 2020, the authors. Published by WILEY-VCH.
Figure 8
Figure 8
Nanopore detection by a specific carrier. (a) Experimental principle of selective detection using molecular agent and a carrier; (b) example signal of selective detection. Created with Biorender.com.
Figure 9
Figure 9
Nanopore detection of AChE using TDN. (a) Schematic illustration for the translocation of bare TDN-apt, AChE, and TDN-apt-AChE complex through the nanopipette and the corresponding signals. (b) Current−time traces of the translocation of 150 fM TDN-apt interacting with 100 fM AChE and 100 fM of other interferent proteins, as well as their mixture. Reprinted with permission from [110]. Copyright 2022, American Chemical Society.
Figure 10
Figure 10
Nanopore detection of lysozyme by AuNPs. (a) Structure of AuNPs functionalized with an LBA (1) for detection of lysozyme (2). (b) Current–time traces of the AuNP-LBA-lysozyme complex at 600 mV with 100 mM KCl. Reproduced from [112]. Copyright 2017, Royal Society of Chemistry.
Figure 11
Figure 11
Detection of miRNA-141 and PCT by AuNPs. (a) Schematic representation of AuNP monomer miR-141-3p molecular probes with representative individual events (scale bar: vertical 50 pA, horizontal 20 µs), along with the associated statistics. (b) Conjugated dimers with miRNA-141 linked between 2 NP monomers. (c) AuNP monomeric antibody molecular probes with individual translocation events (scale bar: vertical 50 pA, horizontal 20 µs), along with associated statistics. (d) Conjugated antibody dimers with PCT (an antigen). Reproduced from [113]. Copyright 2021, John Wiley and Sons.
Figure 12
Figure 12
Double-barrel nanopipette-based system for the detection of dopamine, serotonin, and K+. (a) Schematic illustration of the measurement principle based on a dual nanopipette. Ionic current recordings of the translocations of 20 nm Au-PEG NPs in 100 mM KCl at 400 mV performed in a single nanopipette (b) and a dual nanopipette (c) (stars highlight representative events in dashed boxes). Reprinted with permission from [115]. Copyright 2022, American Chemical Society.
Figure 13
Figure 13
Nanopore electro-optical approach to detect thrombin. (a) Schematic of the electro-optical configuration, where a nanopore is integrated with a single-molecule fluorescence confocal microscope. (b) MBs are hybridized to a DNA carrier for the single-molecule detection of small oligonucleotides or proteins. Top: without target binding, the signal is only observed in the electrical detection channel. Bottom: when bound to a complementary DNA or protein, a synchronized signal is observed in both channels due to the opening of the MB and the increased distance between the fluorophore and the quencher probes. (c) Photon and current time traces are shown for the translocation of (i) thrombin in 5% serum, (ii) MB–carrier in 5% serum, and (iii) MB–carrier bound to thrombin in 5% serum. (iv) Percent synchronization between the optical and electrical channels for thrombin bound to the MB–carrier. Reprinted from [116]. Copyright 2019, the authors.
Figure 14
Figure 14
Multiplexed detection of SARS-CoV-2 viral proteins and RNA fragments. (a) Schematic of multiplexed detection of SARS-CoV-2 viral proteins and RNA fragments. (b) Ion current–time traces for 10 kbp dsDNA probes encoded with an S protein aptamer without bound S protein (i), and when the S protein is bound, a secondary peak occurs at the end (ii). (c) Similarly, 10 kbp dsDNA probes encoded with an N protein aptamer (without bound with N protein (i)), display a secondary peak in the middle upon N protein binding (ii). (d) A 9.1 kbp DNA probe encoded with sequences complementary to the ORF1b, S, and N genes (i) enables RNA fragment detection, with specific secondary peaks corresponding to each gene (ii). Reprinted from [41]. Copyright 2019, the authors.
Figure 15
Figure 15
Mapping of recognition sites on DNA. (a) Single dCas9 probes bound to 3.6 kbp DNA translocating through a nanopore. (b) Double and triple dCas9 probe barcodes on full-length λ-DNA. (i) Example events with two and three peaks due to binding of the double-probe barcode and triple-probe barcode, respectively. (ii) Raw data comparing the number of peaks counted per event after the addition of a single probe, double probe, and triple probe. Reprinted with permission from [117]. Copyright 2019, American Chemical Society.
Figure 16
Figure 16
Single-molecule monitoring of Aβ1–42 monomers. (a) Schematic representation of the single-molecule monitoring of Aβ1–42 monomers: (i) event scatter plots and (ii) histograms of the current amplitude versus dwell time for the translocation of Aβ1–42 monomers. (b) Single-molecule monitoring of Aβ1–42 oligomers: (i) event scatter plots and (ii) histograms of the current amplitude versus dwell time for the translocation of Aβ1–42 oligomers. (c) Single-molecule monitoring of Aβ1–42 fibers: (i) event scatter plots and (ii) histograms of the current amplitude versus dwell time for the translocation of Aβ1–42 fibers. Reproduced from [127] with permission from the Royal Society of Chemistry.
Figure 17
Figure 17
Concept of real-time fast amyloid seeding and translocation (RT-FAST). (a) Scheme showing the two parts of a nanopipette: the reservoir where the αS seeds are amplified and the sensor where αS seeds are detected. (b) Illustration of the RT-FAST experiments. (c) Example of a current trace record extracted from different nanopipettes for reference (light blue), the control not seeded (blue), and the sample seeded with αS WT (red) and A53T mutant (yellow). Reproduced from [132]. Copyright 2022, the authors.

Similar articles

Cited by

References

    1. Zhang S., Li M., Su B., Shao Y. Fabrication and Use of Nanopipettes in Chemical Analysis. Annu. Rev. Anal. Chem. 2018;11:265–286. doi: 10.1146/annurev-anchem-061417-125840. - DOI - PubMed
    1. Yu R.J., Ying Y.L., Gao R., Long Y.T. Confined Nanopipette Sensing: From Single Molecules, Single Nanoparticles, to Single Cells. Angew. Chem.-Int. Ed. 2019;58:3706–3714. doi: 10.1002/anie.201803229. - DOI - PubMed
    1. Ohshiro T. Nanodevices for Biological and Medical Applications: Development of Single-Molecule Electrical Measurement Method. Appl. Sci. 2022;12:1539. doi: 10.3390/app12031539. - DOI
    1. Vaneev A.N., Timoshenko R.V., Gorelkin P.V., Klyachko N.L., Erofeev A.S. Recent Advances in Nanopore Technology for Copper Detection and Their Potential Applications. Nanomaterials. 2023;13:1573. doi: 10.3390/nano13091573. - DOI - PMC - PubMed
    1. Takami T., Park B.H., Kawai T. Nanopipette Exploring Nanoworld. Nano Converg. 2014;1:17. doi: 10.1186/s40580-014-0017-3. - DOI - PMC - PubMed

LinkOut - more resources