. 2024 Dec 2;46(12):13675-13695.
doi: 10.3390/cimb46120817.

ARID2 Deficiency Enhances Tumor Progression via ERBB3 Signaling in TFE3-Rearranged Renal Cell Carcinoma

Affiliations

ARID2 Deficiency Enhances Tumor Progression via ERBB3 Signaling in TFE3-Rearranged Renal Cell Carcinoma

Jinglong Tang et al. Curr Issues Mol Biol. .

Abstract

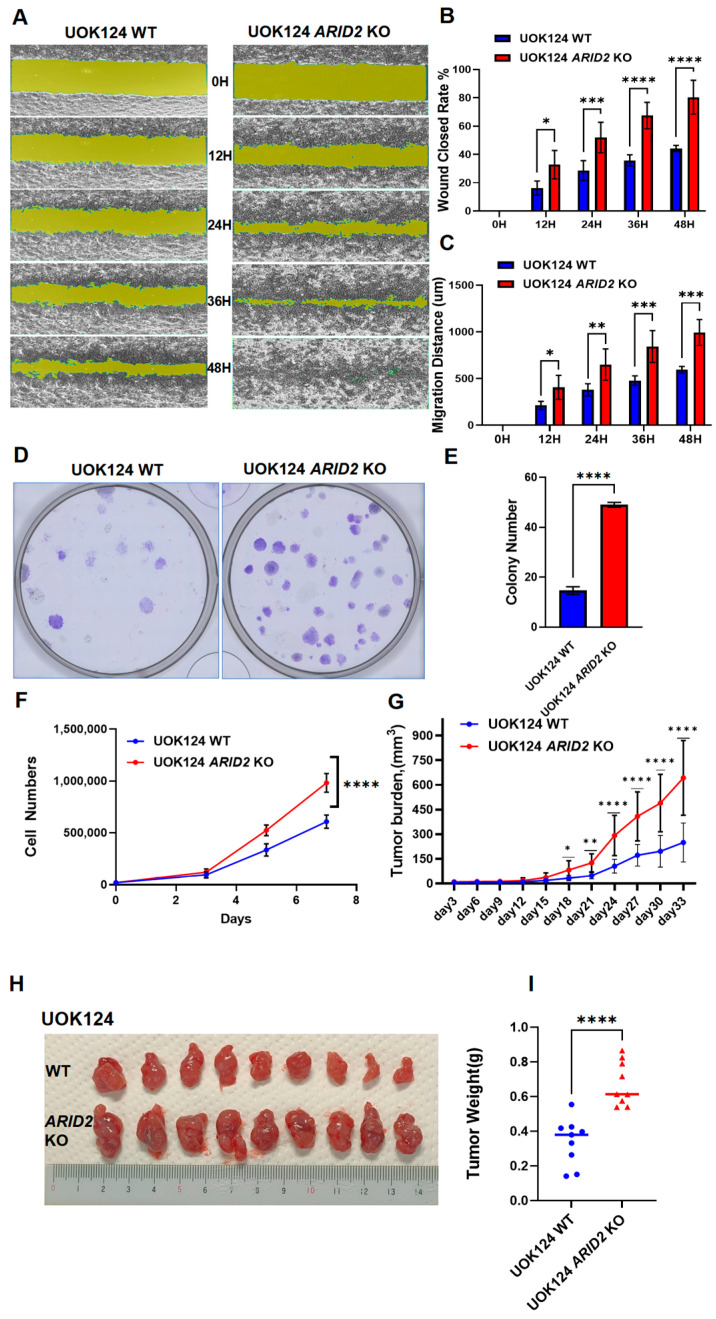
TFE3-rearranged Renal Cell Carcinoma (TFE3-RCC) is an aggressive subtype of RCC characterized by Xp11.2 rearrangement, leading to TFE3 fusion proteins with oncogenic potential. Despite advances in understanding its molecular biology, effective therapies for advanced cases remain elusive. This study investigates the role of ARID2, a component of the SWI/SNF chromatin remodeling complex, in TFE3-RCC. Through a series of in vitro and in vivo experiments, we confirmed that ARID2 acts as a tumor suppressor in TFE3-RCC. ARID2 knockout (KO) enhanced TFE3-RCC cell migration, proliferation, and tumor growth. Transcriptomic analysis revealed ERBB3 as a key target gene regulated by both PRCC-TFE3 and ARID2. Chromatin immunoprecipitation (ChIP) assays demonstrated that PRCC-TFE3 directly binds to and upregulates ERBB3 expression, with ARID2 KO further enhancing this effect. TFE3-RCC ARID2 KO cells exhibited significant gene expression enrichment in MAPK and ERBB3 signaling pathways. These cells also showed increased activation of ERBB3, EGFR, and selective activation of SRC and MAPK. TFE3-RCC ARID2 KO cells demonstrated heightened sensitivity to the ERBB3 inhibitor AZD8931 compared to their wild-type counterparts, exhibiting significantly reduced migration and proliferation rates. These findings suggest that the PRCC-TFE3-ARID2-ERBB3 axis plays a critical role in TFE3-RCC pathogenesis and highlights the potential of targeting ERBB3 in ARID2-deficient TFE3-RCC as a therapeutic strategy. This study provides new insights into the molecular mechanisms of TFE3-RCC and suggests avenues for precision treatment of this aggressive cancer.

Keywords: ARID2; ERBB3; TFE3 fusion; TFE3-RCC.


Conflict of interest statement

The authors declare no conflicts of interest.

Figures

Figure 1
Figure 1
ARID2 KO enhances tumor progression in TFE3-rearranged Renal Cell Carcinoma. (A) The effect of ARID2 KO on the migration of TFE3-RCC UOK124 cells. Determined by cell scratch assay are set at five time points: 0 h, 12 h, 24 h, 36 h, and 48 h. (B) Wound closure rate. (C) Migration distance. Data were presented as mean ± SEM of three individual experiments. p values were determined by multiple unpaired t-test. (D,E) Effect of ARID2 KO on colony formation of UOK124 cells. At least three biological replicates were performed for each condition. (F) Effect of ARID2 KO on the proliferation of TFE3-RCC UOK124 cells. Data were presented as mean ± SEM of three individual experiments. p values were determined by unpaired t-test. (GI) The UOK124 and UOK124 ARID2 KO cells were injected into the subcutaneous tissue of nude mice. Starting on the third day after injection, tumor volume was measured every three days. Tumor volumes were measured and plotted as mean ± SEM (n = 5 animals per group). p values were determined by unpaired t-test (G). On the 33rd day, when the diameter of one of the tumors grew to nearly but not exceeding 20 mm, the tumors were harvested by sacrificing the mice. (H) Tumors were weighted and plotted as mean ± SEM (n = 5 animals per group). p values were determined by unpaired t-test. (I) p > 0.05; * p < 0.05; ** p < 0.01; *** p < 0.001; **** p < 0.0001.
Figure 2
Figure 2
ERBB3 emerges as a key common target for PRCC-TFE3 chimeric protein and ARID2. (A) The volcano plot illustrates the distribution and expression of DEGs between PRCC-TFE3 doxycycline-inducible HK2 cells cultured without doxycycline and with doxycycline. The data processing was based on the criteria of log2(fold change) > 1 and p.adj-value < 0.05. (B) Volcano plot is derived from the differences between SKmel147 WT cells vs. SKmel147 ARID2 KO cells. The data processing was based on the criteria of log2(fold change) > 1 and p.adj-value < 0.05 (B). (C) A Venn diagram was used to analyze the intersection of two sets of DEGs (PRCC-TFE3 inducible HK2 without doxycycline vs. with doxycycline and SKmel147 WT vs. SKmel147 ARID2 KO), revealing 26 genes that are commonly regulated in PRCC-TFE3 expressing HK2 and SKmel147 ARID2 KO. (D) Heatmap of the commonly regulated 26 genes from the Venn data (C), based on PRCC-TFE3 non-induced HK2 vs. PRCC-TFE3 induced HK2. (E) Heatmap of the commonly regulated 26 genes from the Venn data (C), based on SKmel147 WT and SKmel147 ARID2 KO cells. (F) The volcano plot illustrates the distribution and expression of DEGs. The data are derived from the differences between UOK124 WT cells and UOK124 ARID2 KO cells. The data processing was based on the criteria of log2(fold change) > 1 and p.adj-value < 0.05. (G) The DEGs from the three groups: HK2 Doxy(−) vs. HK2 Doxy(+), SKmel147 WT vs. SKmel147 ARID2 KO, and UOK124 WT vs. UOK124 ARID2 KO, were analyzed using a Venn diagram. A total of nine DEGs were found to be commonly regulated among the three groups. (H) Heatmap of the commonly regulated nine genes from Venn data (G), based on UOK124 WT vs. UOK124 ARID2 KO. (I) RNA was extracted from UOK124 WT cells and UOK124 ARID2 KO cells, and qPCR analysis was performed on nine commonly regulated genes, revealing significant differences in ERBB3 expression. Ct values were analyzed using the 2−ΔΔCt method. Data were presented as mean ± SEM of three individual experiments, p values were determined by two tail unpaired t-test. ns, p > 0.05; * p < 0.05; ** p < 0.01; **** p < 0.0001.
Figure 3
Figure 3
PRCC-TFE3 fusion protein expression and ARID2 loss synergistically up-regulate ERBB3 expression. (A) Results from two biological replicates of HA-TFE3 ChIP-seq in PRCC-TFE3 doxycycline-inducible HK2 cells. PRCC-TFE3 binding is seen along the promoter regions of ERBB3 gene. Dashed box marks ERBB3 binding peaks. (B) ChIP-qPCR analysis demonstrates the binding of endogenous PRCC-TFE3 to the promoter region of ERBB3 in UOK124 vector cells, which was significantly abolished in PRCC-TFE3-knockdown UOK124 cells. (C) ChIP-qPCR analysis demonstrates the binding of endogenous PRCC-TFE3 to the promoter region of ERBB3 in UOK124 cells, which was significantly increased in ARID2 KO UOK124 cells. p values were determined by two-way ANOVA test. ns, p > 0.05; * p < 0.05; ** p < 0.01; *** p < 0.001; **** p < 0.0001.
Figure 4
Figure 4
ERBB3 signaling pathway enrichment in ARID2-deficient TFE3-rearranged RCC. (A) GO functional enrichment analysis of DEGs in UOK124 WT cells and UOK124 ARID2 KO cells. (B) KEGG net pathway enrichment analysis of DEGs in UOK124 WT cells and UOK124 ARID2 KO cells. (C) Schematic illustration of ERBB signaling pathway.
Figure 5
Figure 5
Selective ERBB3 Up-regulation and Downstream Pathway Activation in ARID2-Deficient TFE3-RCC Cells. (A) Immunoblot of ERBB3, pERBB3, EGFR, pEGFR, ERBB2, pERBB2, ERBB4, pERBB4 in UOK124 WT and UOK124 ARID2 KO cells. β-actin was used as a loading control, (n = 3). (BI) The protein expression levels of ERBB3, pERBB3, EGFR, pEGFR, ERBB2, pERBB2, ERBB4, and pERBB4 were quantified using Image Studio 6.0 software on Western blotting images obtained by Odyssey XF. Data were presented as mean ± SEM of three individual experiments, p values were determined by two-tail unpaired t-test. ns, p > 0.05; * p < 0.05; ** p < 0.01; *** p < 0.001; **** p < 0.0001. (J) Immunoblot of PI3K, pPI3K, AKT, pAKT, SRC, pSRC, MAPK, pMAPK in UOK124 WT, and UOK124 ARID2 KO cells. β-actin was used as a loading control, (n = 3). (KR) The protein expression levels of PI3K, pPI3K, AKT, pAKT, SRC, pSRC, MAPK, pMAPK were quantified using Image Studio 6.0 software on Western blotting images obtained by Odyssey XF. Data were presented as mean ± SEM of three individual experiments, p values were determined by two-tail unpaired t-test. ns, p > 0.05; * p < 0.05; ** p < 0.01; *** p < 0.001; **** p < 0.0001.
Figure 6
Figure 6
Specific Effects of ERBB3 Inhibitors in the Context of UOK124 ARID2 Deficiency. (A) Immunoblot of ERBB3, pERBB3, EGFR, pEGFR, SRC, pSRC, MAPK, pMAPK, in UOK124 WT and UOK124 ARID2 KO cells cultured with and without ERBB3 inhibitor (AZD8931, Cat. No. S2192). β-actin was used as a loading control, (n = 3). (BI) The protein expression levels of ERBB3, pERBB3, EGFR, pEGFR, SRC, pSRC, MAPK, pMAPK were quantified using Image Studio 6.0 software on Western blotting images obtained by Odyssey XF. Data were presented as mean ± SEM of three individual experiments, p values were determined by two-tail unpaired t-test. ns, p > 0.05; * p < 0.05; *** p < 0.001; **** p < 0.0001. (J) The effect of an ERBB3 inhibitor on the migration of UOK124 WT and UOK124 ARID2 KO cells. Determined by cell scratch assays set at five time points: 0 h, 12 h, 24 h, 36 h, and 48 h. (K) Wound closure rate. (L) Migration distance. Data were presented as mean ± SEM of three individual experiments. p values were determined by multiple unpaired t-test, p > 0.05 is significant. *** p < 0.001; **** p < 0.0001. (M) Cell proliferation curves of UOK124 WT and UOK124 ARID2 KO cells cultured with or without an ERBB3 inhibitor. Data were presented as mean ± SEM of three individual experiments. p values were determined by unpaired t-test. ** p < 0.01; **** p < 0.0001.

References

    1. Hes O., Michalová K., Pivovarčíková K. New insights in the new WHO classification of adult renal tumors. Ceskoslovenska Patol. 2022;67:187–191. - PubMed
    1. Rizzo M., Caliò A., Brunelli M., Pezzicoli G., Ganini C., Martignoni G., Camillo P. Clinico-pathological implications of the 2022 WHO Renal Cell Carcinoma classification. Cancer Treat. Rev. 2023;116:102558. doi: 10.1016/j.ctrv.2023.102558. - DOI - PubMed
    1. Tang J., Baba M. MiT/TFE Family Renal Cell Carcinoma. Genes. 2023;14:151. doi: 10.3390/genes14010151. - DOI - PMC - PubMed
    1. Cajaiba M.M., Dyer L.M., Geller J.I., Jennings L.J., George D., Kirschmann D., Rohan S.M., Cost N.G., Khanna G., Mullen E.A., et al. The classification of pediatric and young adult renal cell carcinomas registered on the children’s oncology group (COG) protocol AREN03B2 after focused genetic testing. Cancer. 2018;124:3381–3389. doi: 10.1002/cncr.31578. - DOI - PMC - PubMed
    1. Komai Y., Fujiwara M., Fujii Y., Mukai H., Yonese J., Kawakami S., Yamamoto S., Migita T., Ishikawa Y., Kurata M., et al. Adult Xp11 translocation renal cell carcinoma diagnosed by cytogenetics and immunohistochemistry. Clin. Cancer Res. 2009;15:1170–1176. doi: 10.1158/1078-0432.CCR-08-1183. - DOI - PubMed