

Histopathological Analysis of Lipopolysaccharide-Induced Liver Inflammation and Thrombus Formation in Mice: The Protective Effects of Aspirin
- PMID: 39727984
- PMCID: PMC11674652
- DOI: 10.3390/cimb46120856
Histopathological Analysis of Lipopolysaccharide-Induced Liver Inflammation and Thrombus Formation in Mice: The Protective Effects of Aspirin
Abstract
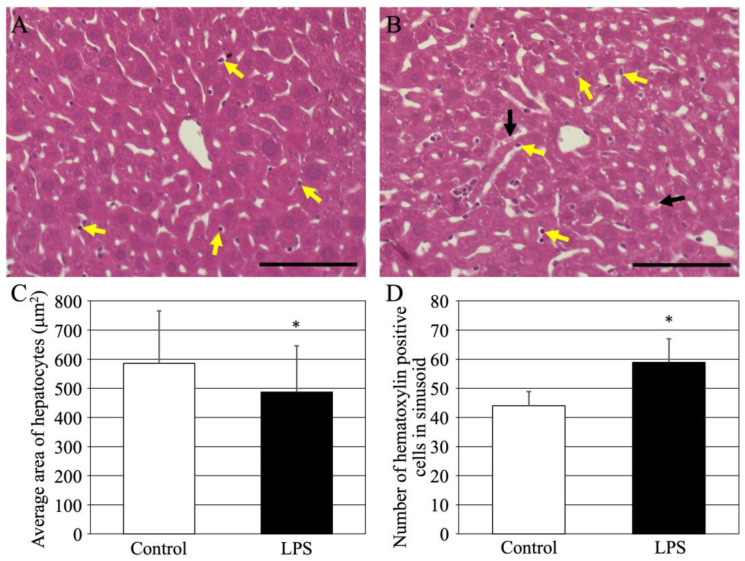
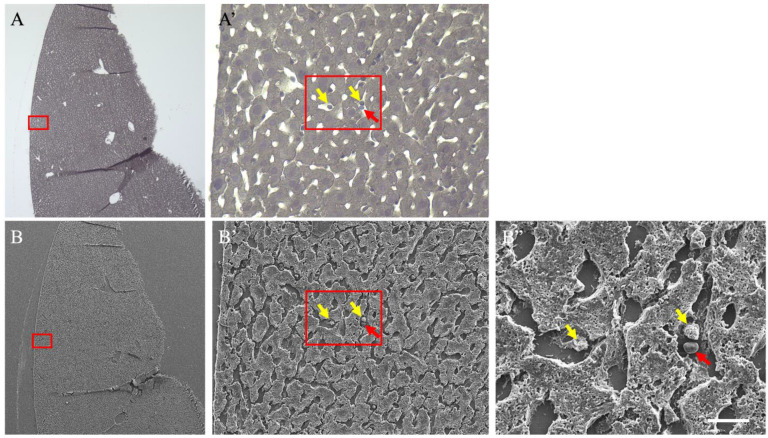
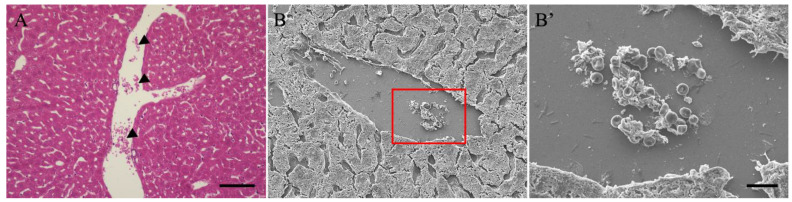
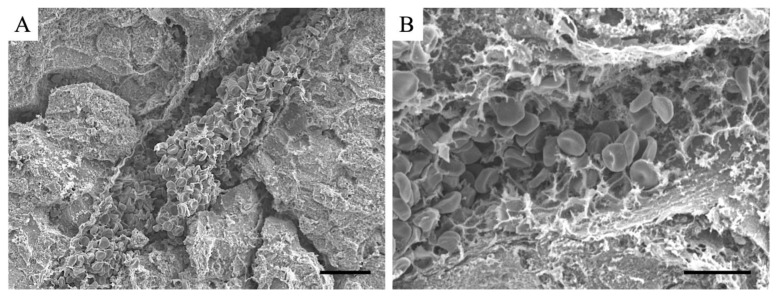
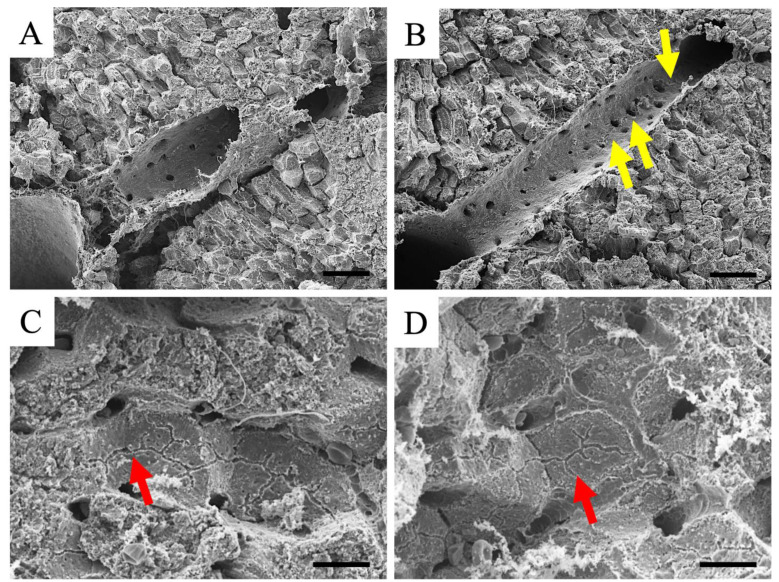
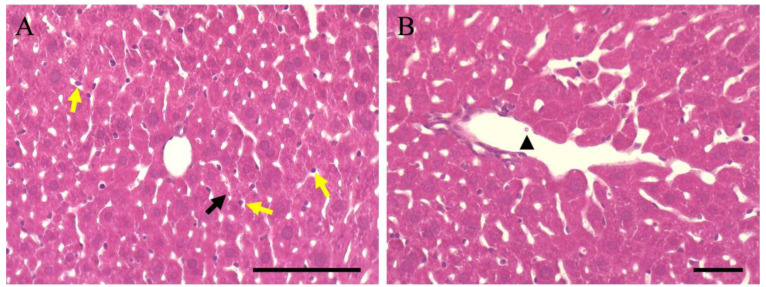
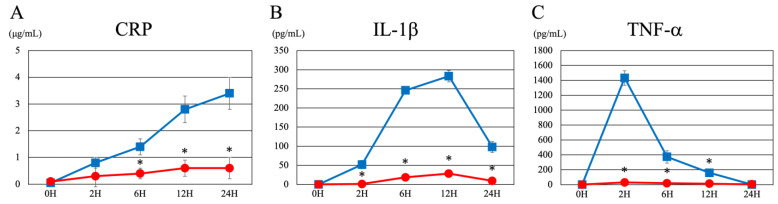
Hepatitis, a significant medical concern owing to its potential to cause acute and chronic liver disease, necessitates early intervention. In this study, we aimed to elucidate the histopathological features of lipopolysaccharide-induced hepatitis in mice, focusing on tissue alterations. The results demonstrated that hepatocytes exhibited decreased eosin staining, indicating cellular shrinkage, whereas sinusoids were swollen with blood cells. Detailed electron microscope analysis identified these blood cells as leukocytes and erythrocytes, which confirmed a thrombus formation within the liver. Pre-treatment with aspirin significantly attenuated these pathological changes, including reductions in inflammatory markers such as C-reactive protein, interleukin-1β, and tumor necrosis factor-alpha. These findings highlight aspirin's anti-inflammatory and antiplatelet effects in mitigating liver inflammation and thrombus formation. In this study, we highlighted the potential of aspirin as a therapeutic agent for liver inflammation, in addition to providing insights into hepatocyte alterations and sinusoidal blood cell aggregation in liver inflammation. Aspirin, through the protection of endothelial cells and reduction of cytokine levels, may have broader applications in managing liver disease and other systemic inflammatory conditions. This emphasizes its value in prevention and therapy.
Keywords: aspirin; blood clot; correlative light and electron microscopy; inflammation; lipopolysaccharide; liver; scanning electron microscopy; thrombus.
Conflict of interest statement
The authors declare no conflicts of interest.
Figures
Similar articles
-
Advances in Understanding Lipopolysaccharide-Mediated Hepatitis: Mechanisms and Pathological Features.Curr Issues Mol Biol. 2025 Jan 27;47(2):79. doi: 10.3390/cimb47020079. Curr Issues Mol Biol. 2025. PMID: 39996800 Free PMC article. Review.
-
Cooperation of liver cells in health and disease.Adv Anat Embryol Cell Biol. 2001;161:III-XIII, 1-151. doi: 10.1007/978-3-642-56553-3. Adv Anat Embryol Cell Biol. 2001. PMID: 11729749 Review.
-
Targeting Oxidative Stress: The Potential of Vitamin C in Protecting against Liver Damage after Electron Beam Therapy.Biomedicines. 2024 Sep 26;12(10):2195. doi: 10.3390/biomedicines12102195. Biomedicines. 2024. PMID: 39457507 Free PMC article.
-
Anti-Inflammatory and Reactive Oxygen Species Suppression through Aspirin Pretreatment to Treat Hyperoxia-Induced Acute Lung Injury in NF-κB-Luciferase Inducible Transgenic Mice.Antioxidants (Basel). 2020 May 15;9(5):429. doi: 10.3390/antiox9050429. Antioxidants (Basel). 2020. PMID: 32429142 Free PMC article.
-
Translocation of platelets into Disse spaces and their entry into hepatocytes in response to lipopolysaccharides, interleukin-1 and tumour necrosis factor: the role of Kupffer cells.J Hepatol. 1998 Jun;28(6):991-9. doi: 10.1016/s0168-8278(98)80348-6. J Hepatol. 1998. PMID: 9672175
Cited by
-
Anti-Inflammatory Actions of Plant-Derived Compounds and Prevention of Chronic Diseases: From Molecular Mechanisms to Applications.Int J Mol Sci. 2025 May 28;26(11):5206. doi: 10.3390/ijms26115206. Int J Mol Sci. 2025. PMID: 40508016 Free PMC article. Review.
-
Pre-conditioning with PQQ during pregnancy alleviates LPS-induced placental damage and improves the fetal survival and growth in mice.Front Endocrinol (Lausanne). 2025 Jul 10;16:1617026. doi: 10.3389/fendo.2025.1617026. eCollection 2025. Front Endocrinol (Lausanne). 2025. PMID: 40708725 Free PMC article.
-
Advances in Understanding Lipopolysaccharide-Mediated Hepatitis: Mechanisms and Pathological Features.Curr Issues Mol Biol. 2025 Jan 27;47(2):79. doi: 10.3390/cimb47020079. Curr Issues Mol Biol. 2025. PMID: 39996800 Free PMC article. Review.
References
-
- Yoshihara S., Harada K., Ohta S. Metabolism of 1-methyl-4-phenyl-1,2,3,6-tetrahydropyridine (MPTP) in perfused rat liver: Involvement of hepatic aldehyde oxidase as a detoxification enzyme. Drug Metab. Dispos. 2000;28:538–543. - PubMed
-
- Hayashi M., Kanda T., Nakamura M., Miyamura T., Yasui S., Nakamoto S., Wu S., Arai M., Imazeki F., Yokosuka O. Acute liver injury in a patient with alcohol dependence: A case resembling autoimmune hepatitis or drug-induced liver injury. Case Rep. Gastroenterol. 2014;8:129–133. doi: 10.1159/000362442. - DOI - PMC - PubMed
Grants and funding
LinkOut - more resources
Full Text Sources
Research Materials
