. 2025 Aug;308(8):2212-2233.
doi: 10.1002/ar.25618. Epub 2024 Dec 27.

Exploring developmental changes in femoral midneck cross-sectional properties

Affiliations

Exploring developmental changes in femoral midneck cross-sectional properties

Julia Muñoz-Guarinos et al. Anat Rec (Hoboken). 2025 Aug.

Abstract

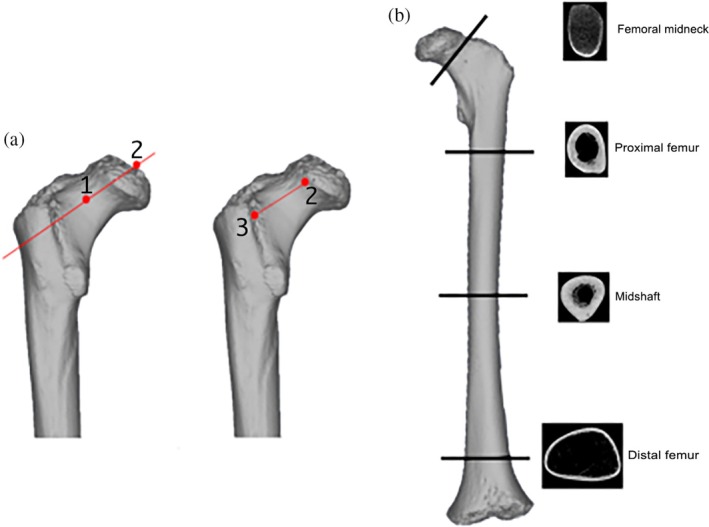
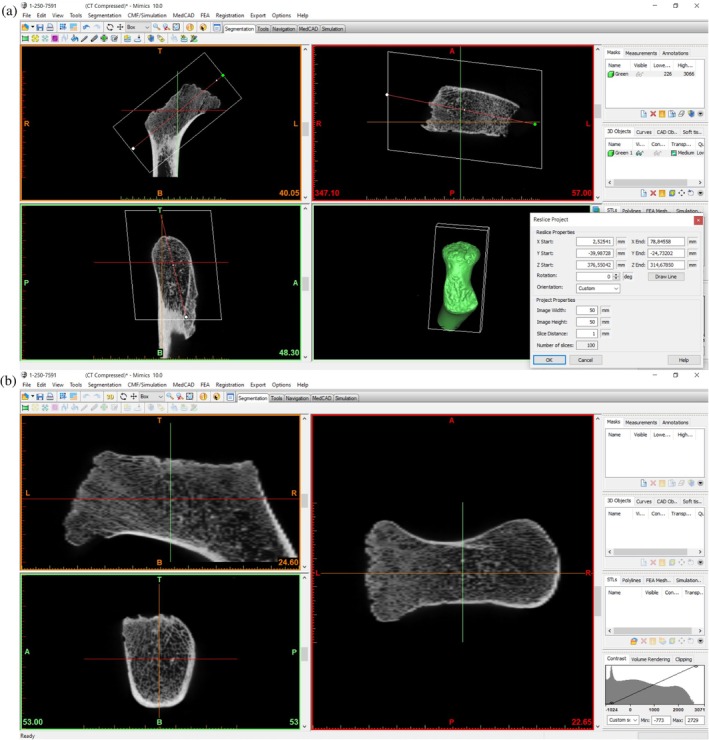
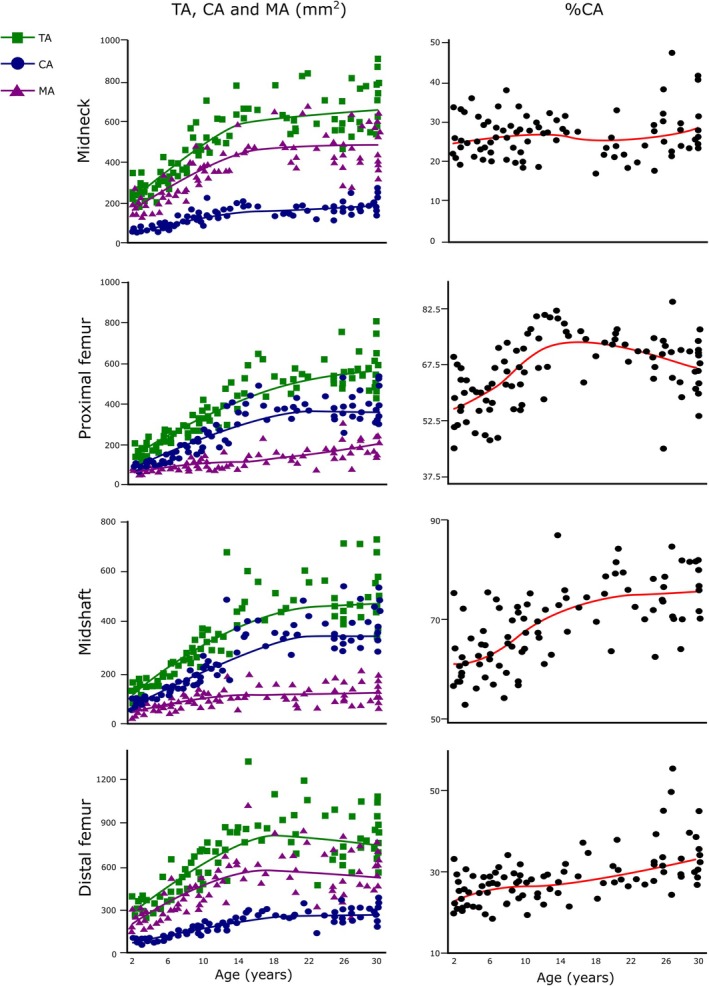
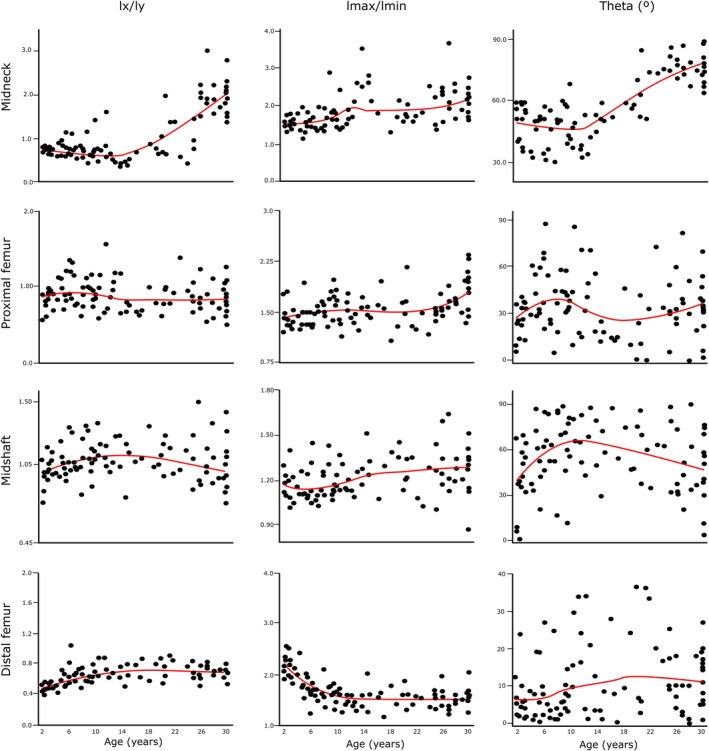
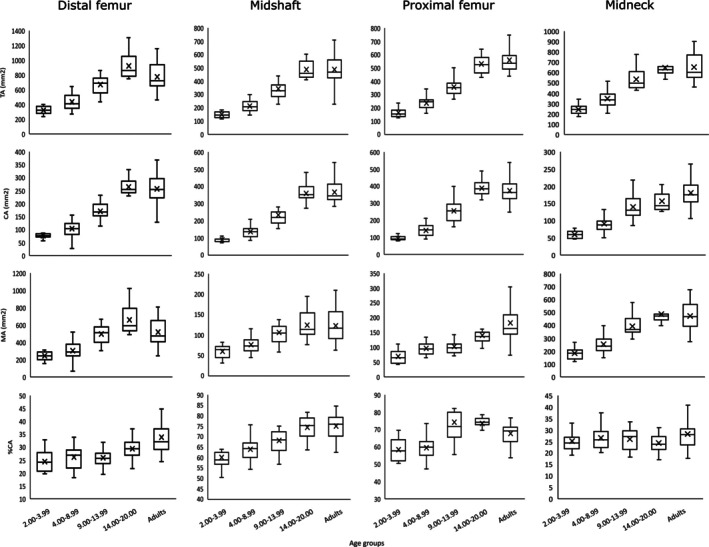
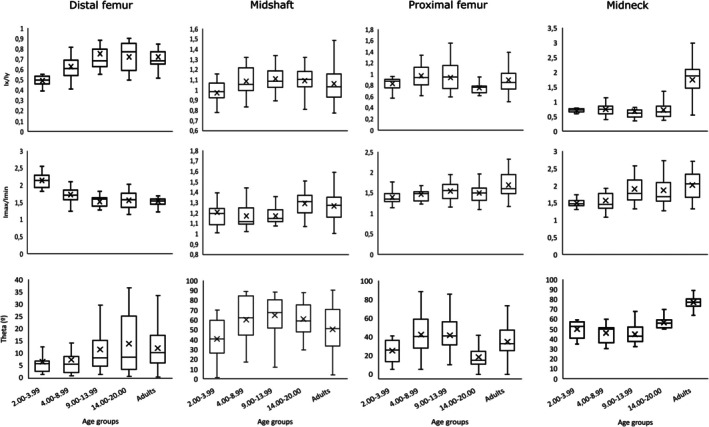
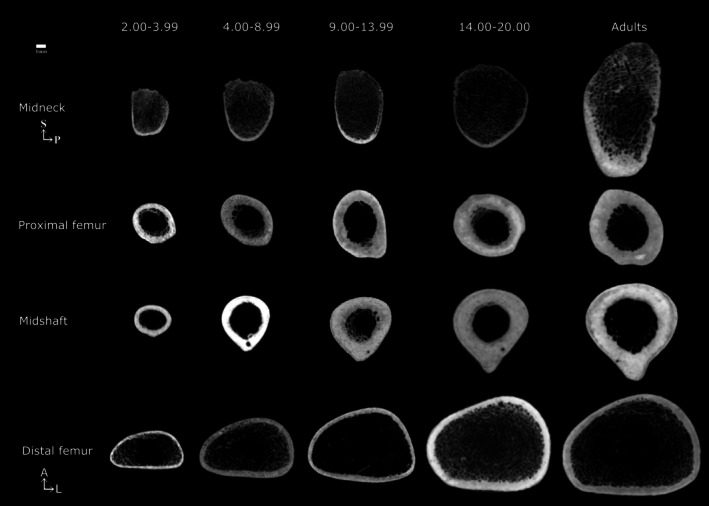
This research delves deeper into previous works on femoral cross-sectional properties during ontogeny by focusing for the first time on the human femoral midneck. The ontogenetic pattern of cross-sectional properties at femoral midneck is established and compared with those at three different femoral locations: the proximal femur, the midshaft, and the distal femur. The study sample includes 99 femora (70 non-adults and 29 adults) belonging to archaeological specimens. Cross-sectional properties were extracted from computed tomographic scans and analyzed with the MomentMacro plugin of ImageJ. Ontogenetic trends of these variables were assessed using locally estimated scatterplot smoothing and segmented regressions, along with Wilcoxon post hoc tests for all possible age group pairings. Our results show that the femoral midneck exhibits a unique growth pattern. Area variables showed rapid growth until adolescence, followed by a more gradual increase leading into adulthood. Nonetheless, the relative cortical area does not demonstrate any significant drops or rise during growth. The morphology of the midneck section of the femur remains stable during ontogeny, with early adolescence and the onset of adulthood marking two periods of significant change. In contrast to the femoral diaphysis, the acquisition of a mature bipedal gait does not appear to constitute a period of significant morphological change at the femoral midneck cross section.

Keywords: adolescence; bipedal gait; growth; ontogeny.


Figures

FIGURE 1
FIGURE 1
(a) Location of landmarks used to extract the midneck cross section. Red point 1 represents the midpoint of the vertical diameter of the neck, and red point 2 represents the midpoint of the vertical diameter of the femoral head metaphyseal surface or femoral head when it is fusing or fused. The red line crossing points 1 and 2 represents the neck axis. Red point 3 represents the intertrochanteric ridge. The red line between points 2 and 3 is the neck length. (b) Illustration of the protocol used to extract the cross sections at femoral midneck and femoral diaphysis in unfused femora.
FIGURE 2
FIGURE 2
(a) Reslicing of the Mimics project with the axis of orientation along the femoral neck. (b) Femoral midneck cross‐sectional slices in Mimics once the axis of orientation is reoriented.
FIGURE 3
FIGURE 3
LOESS regressions for TA, CA, MA, and %CA against age at all femoral locations. Age in years. The green, blue, and purple lines are the LOESS fit lines for TA, CA, and MA, respectively. The red line is the LOESS fit line for %CA. %CA, relative cortical area percentage; CA, cortical area; LOESS, locally estimated scatterplot smoothing; MA, medullary area; TA, total area.
FIGURE 4
FIGURE 4
LOESS regressions for I x /I y , I max/I min, and theta against age at all femoral locations. Age in years. I max/I min—maximum (I max) and minimum (I min) second moments of area ratio; I x /I y —second moment of area around the medial–lateral axis (diaphysis) or antero‐posterior axis (midneck) (I x ) and second moment of area around the antero‐posterior axis (diaphysis) or superior–inferior axis (midneck) (I y ) ratio. Red lines are the LOESS fit lines. LOESS, locally estimated scatterplot smoothing.
FIGURE 5
FIGURE 5
Box‐and‐whiskers plot of areal variables by age groups. Boxes include 25th to 75th percentile and whiskers extend to values within 1.5 x interquartile range from upper and lower limits of the box. Median is shown as a line within the interquartile range and the mean is indicated by a cross. %CA, relative cortical area percentage; CA, cortical area; MA, medullary area; TA, total area.
FIGURE 6
FIGURE 6
Box‐and‐whiskers plot of I x /I y , I max/I min, and theta by age groups. I max/I min—maximum (I max) and minimum (I min) second moments of area ratio; I x /I y —second moment of area around the medial‐lateral axis (diaphysis) or antero‐posterior axis (midneck) (I x ) and second moment of area around the antero‐posterior axis (diaphysis) or superior–inferior axis (midneck) (I y ) ratio. Boxes include 25th to 75th percentiles, and whiskers extend to values within 1.5 × interquartile range from upper and lower limits of the box. Median is shown as a line within the interquartile range and the mean is indicated by a cross.
FIGURE 7
FIGURE 7
Representative age group cross sections at each femoral section location. Individuals were chosen randomly. All femora are from the right side. Age ranges in years.

Similar articles

References

    1. Adolph, K. E. , & Joh, A. S. (2007). Motor development: How infants get into the act. In Slater A. & Lewis M. (Eds.), Introduction to infant development (2nd ed., pp. 63–80). Oxford University Press;
    1. Adolph, K. E. , Vereijken, B. , & Denny, M. A. (1998). Learning to crawl. Child Development, 69, 1299–1312. 10.1111/j.1467-8624.1998.tb06213.x - DOI - PubMed
    1. Adolph, K. E. , Vereijken, B. , & Shrout, P. E. (2003). What changes in infant walking and why. Child Development, 74, 475–497. 10.1111/1467-8624.7402011 - DOI - PubMed
    1. Bass, S. L. , Saxon, L. , Daly, R. M. , Turner, C. H. , Robling, A. G. , Seeman, E. , & Stuckey, S. (2002). The effect of mechanical loading on the size and shape of bone in pre‐, peri‐, and postpubertal girls: A study in tennis players. Journal of Bone and Mineral Research, 17(12), 2274–2280. 10.1359/jbmr.2002.17.12.2274 - DOI - PubMed
    1. Beck, T. J. , Oreskovic, T. L. , Stone, K. L. , Ruff, C. B. , Ensrud, K. , Nevitt, M. C. , Gennant, H. K. , & Cummings, S. R. (2001). Structural adaptation to changing skeletal load in the progression toward hip fragility: The study of osteoporotic fractures. Journal of Bone and Mineral Research, 16, 1108–1119. 10.1359/jbmr.2001.16.6.1108 - DOI - PubMed

LinkOut - more resources