. 2024 Dec 11;10(12):855.
doi: 10.3390/jof10120855.

Evaluation of Lipid Changes During the Drying Process of Cordyceps sinensis by Ultra Performance Liquid Chromatography-Tandem Mass Spectrometry (UPLC-MS/MS)-Based Lipidomics Technique

Affiliations

Evaluation of Lipid Changes During the Drying Process of Cordyceps sinensis by Ultra Performance Liquid Chromatography-Tandem Mass Spectrometry (UPLC-MS/MS)-Based Lipidomics Technique

Mengjun Xiao et al. J Fungi (Basel). .

Abstract

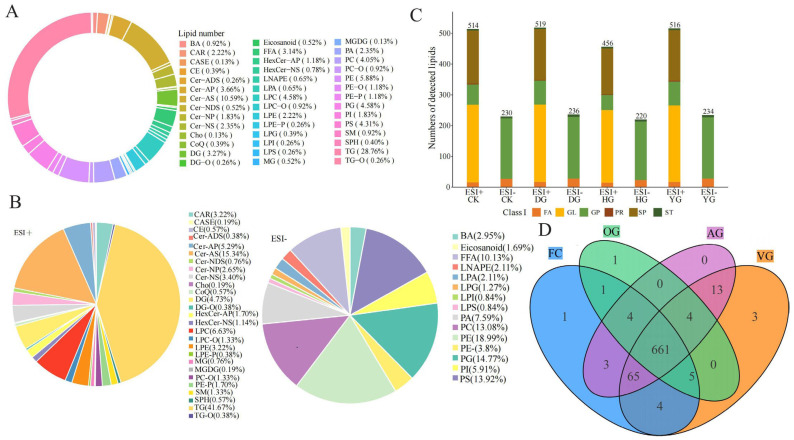
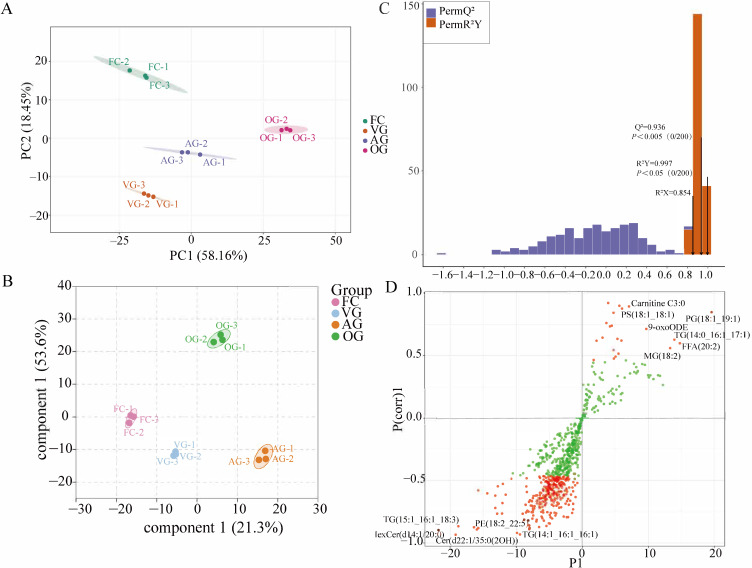
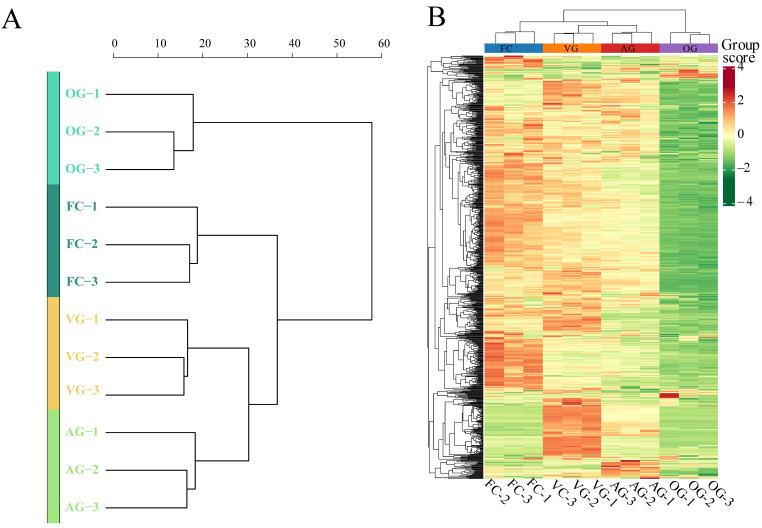
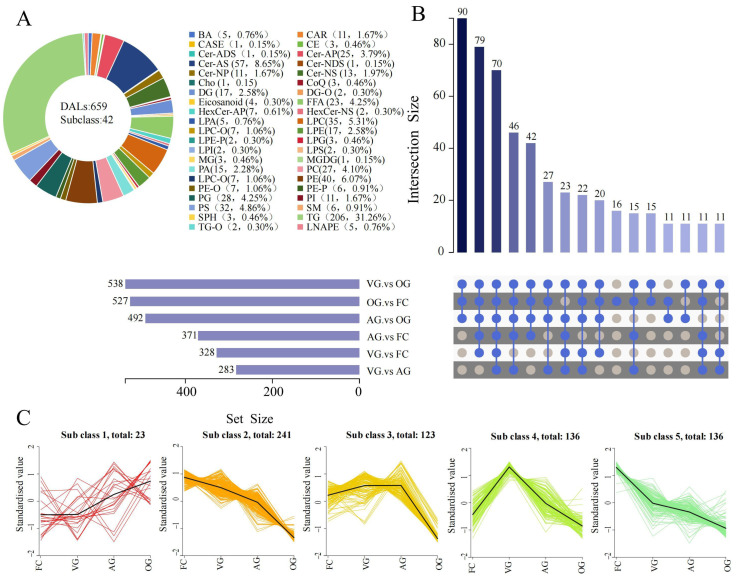
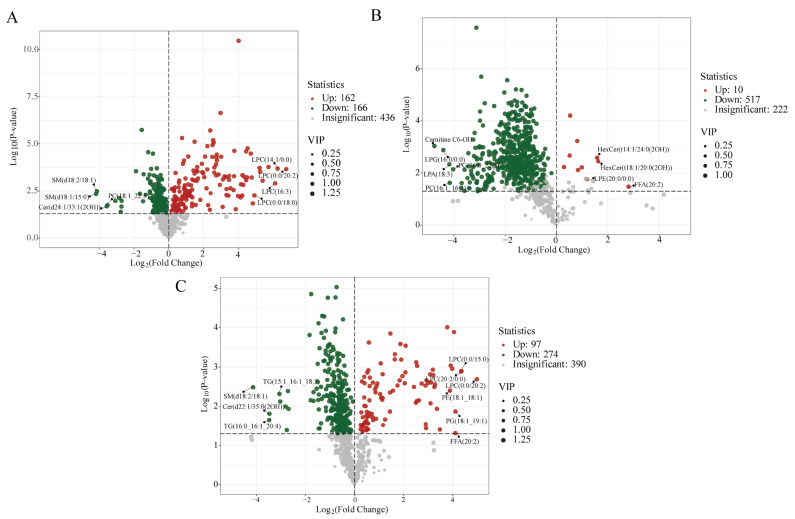
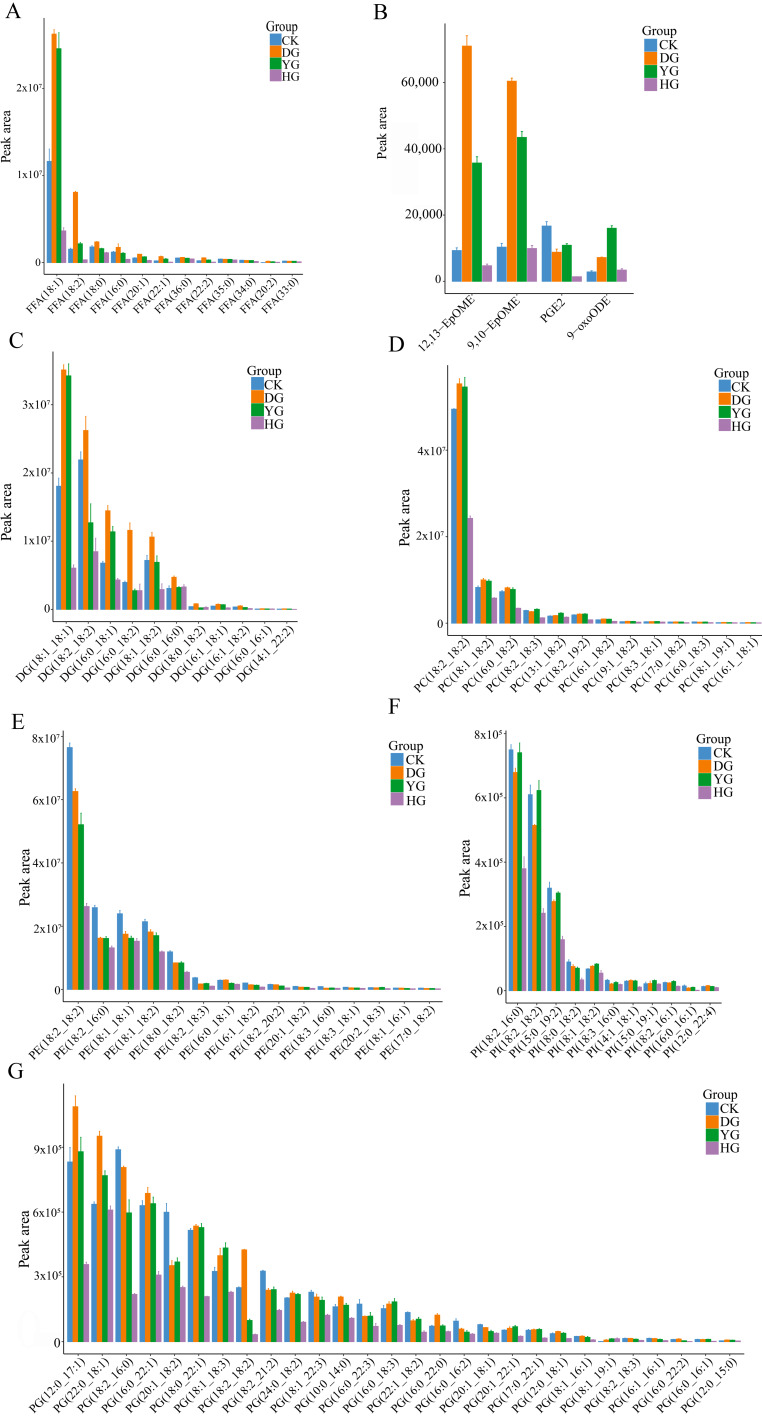
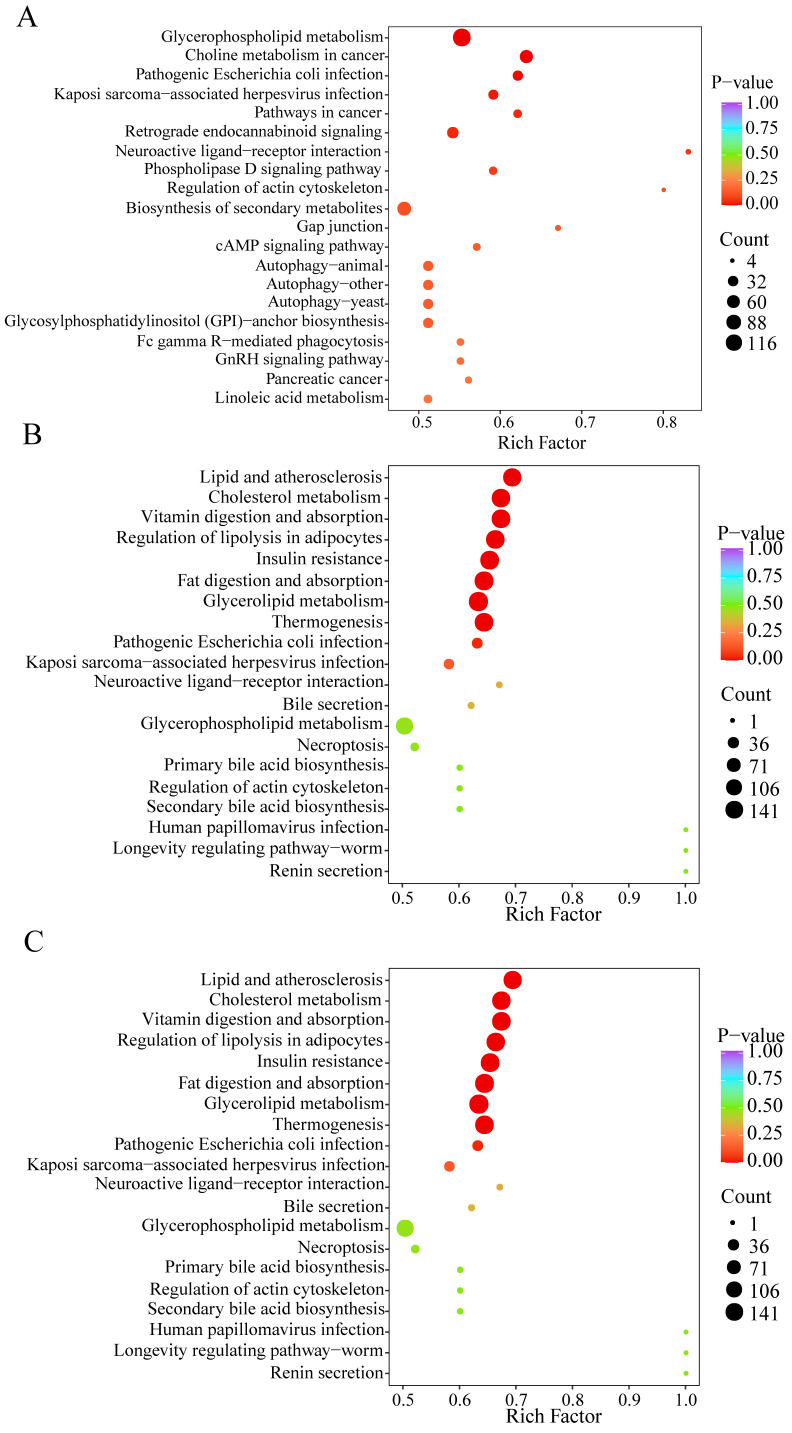
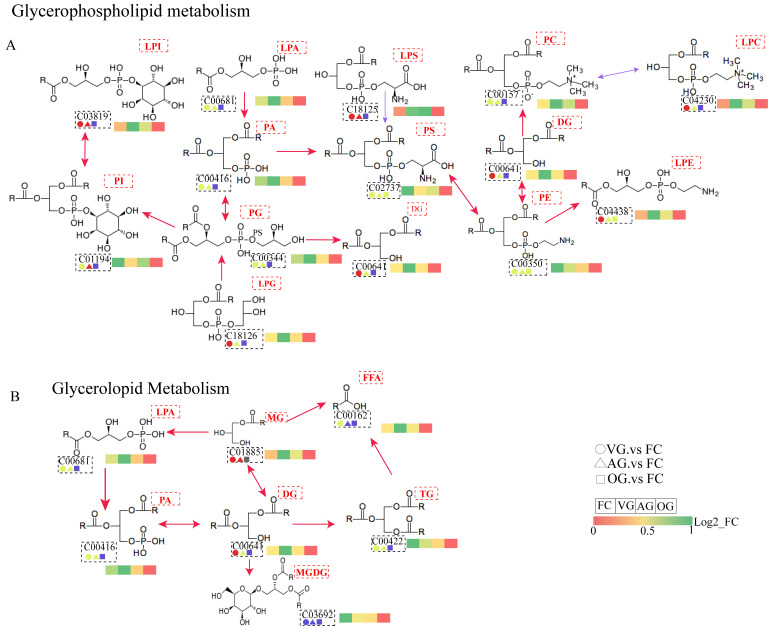
Comprehensive analysis of the lipid content in Cordyceps sinensis samples is essential for optimizing their effective use. Understanding the lipid profile can significantly enhance the application of this valuable fungus across various fields, including nutrition and medicine. However, to date, there is limited knowledge regarding the effects of different drying methods on the quality of lipids present in Cordyceps sinensis. In this study, we employed a broadly targeted lipidomic strategy to conduct a comprehensive analysis of the lipid composition in Cordyceps sinensis subjected to various drying methods. A comprehensive analysis identified a total of 765 distinct lipid species from fresh Cordyceps sinensis (FC), vacuum-freeze-dried Cordyceps sinensis (VG), oven-dried Cordyceps sinensis (OG), and air-dried Cordyceps sinensis (AG). Among these, glycerophospholipids (GP) were the most abundant, followed by glycerides (GL) and sphingolipids (SP). In this study, a total of 659 lipids demonstrated statistically significant differences, as indicated by a p-value (p) < 1. Among these lipids, triglycerides (TG) exhibited the highest concentration, followed by several others, including ceramide-ascorbic acid (Cer-AS), phosphatidylethanolamine (PE), lysophosphatidylcholine (LPC), and phosphatidylserine (PS). OG was the fastest drying method; however, PCA and OPLS-DA analyses indicated that the most significant changes in the lipids of Cordyceps sinensis were observed under the OG method. Specifically, 517 differentially accumulated lipids were significantly down-regulated, while only 10 lipids were significantly up-regulated. This disparity may be attributed to the degradation and oxidation of lipids. The metabolic pathways of glycerolipid, glycerophospholipid, and cholesterol are critical during the drying process of Cordyceps sinensis. This study provides valuable insights that can enhance quality control and offer guidelines for the appropriate storage of this medicinal fungus.

Keywords: Cordyceps sinensis; drying methods; lipidomic; multiple reaction monitoring (MRM); oxidation.


Conflict of interest statement

The authors declare no conflict of interest.

Figures

Figure 1
Figure 1
Lipid identification of C. sinensis. (A) Lipid classification of C. sinensis; (B) lipid pie charts in ESI+ and ESI− modes; (C) number of lipids detected in positive and negative ion modes between different groups; (D) Venn plots of samples from 4 groups, FC, VG, AG, and OG.
Figure 2
Figure 2
(A) PCA diagram. The first principal component’s variability is represented by PC1, while PC2 corresponds to the variability of the second principal component. Different samples are depicted as dots, and groups are illustrated on the right side. (B) OPLS-DA analysis diagram. The horizontal and vertical axes reflect the extent to which components are interpreted, with various samples represented by dots and distinct groups shown on the right side. (C) OPLS-DA validation diagram. The horizontal axis indicates the R2Y and Q2 values of the model, while the vertical axis displays the frequency at which the model’s classification effect appears across 200 random permutation tests. In the diagram, the orange color denotes the R2Y values from the random permutation model, the purple color illustrates the Q2 values from the same model, and the black arrows signify the original model’s R2X, R2Y, and Q2 values. (D) S-plot of OPLS-DA.
Figure 3
Figure 3
(A) Sample hierarchical clustering tree. Each branch in the graph represents a sample. Samples with high similarity are clustered in the same cluster. (B) Clustered heatmaps. The name of the sample is shown horizontally, and the right side represents the different groups.
Figure 4
Figure 4
Examination of DALs in C. sinensis subjected to various drying methods. (A) Pie chart illustrating all subclasses of DALs. (B) Venn diagrams showcasing DALs across different comparison categories. (C) K-means clustering analysis of all DALs, where the horizontal axis denotes sample groupings, and the vertical axis represents standardized relative lipid content.
Figure 5
Figure 5
Volcano grams of comparative groups of C. sinensis. (A) VG vs. FC; (B) AG vs. FC; (C) OG vs. FC.
Figure 6
Figure 6
Peak areas of bioactive: (A) FFAs; (B) eicosanoids; (C) DGs; (DG) GPs (PC, PE, PI, and PG) detected in C. sinensis under fresh and studied drying methods.
Figure 7
Figure 7
Differential lipid pathway enrichment map. (A) VG vs. FC; (B) AG vs. FC; (C) OG vs. FC. The horizontal coordinate indicates the corresponding rich factor of each pathway, the vertical coordinate is the pathway name (sorted by p-value), and the color of the dots reflects the p-value size, and the redder the color, the more significant the enrichment.
Figure 8
Figure 8
The metabolic pathways of major lipids in C. sinensis under inter-group comparisons, the numbers represent the ID of each lipid subclass: (A) glycerophospholipid metabolism; (B) glycerolipid metabolism. Note: red indicates that the lipid content is significantly up-regulated, blue indicates that the lipid content is significantly down-regulated, gray indicates that the lipid was detected but not significantly changed, and yellow indicates that both up-regulated and down-regulated lipids were included.

Similar articles

References

    1. Liu Y., Wang J., Wang W., Zhang H., Zhang X., Han C. The Chemical Constituents and Pharmacological Actions of Cordyceps sinensis. Evid. Based Complement. Altern. Med. 2015;2015:575063. - PMC - PubMed
    1. Tang C., Li X., Wang T., Wang J., Xiao M., He M., Chang X., Fan Y., Li Y. Characterization of Metabolite Landscape Distinguishes Medicinal Fungus Cordyceps sinensis and other Cordyceps by UHPLC-Q Exactive HF-X Untargeted Metabolomics. Molecules. 2023;28:7745. doi: 10.3390/molecules28237745. - DOI - PMC - PubMed
    1. Shashidhar M.G., Giridhar P., Sankar K.U., Manohar B. Bioactive principles from Cordyceps sinensis: A potent food supplement–A review. J. Funct. Foods. 2013;5:1013–1030. doi: 10.1016/j.jff.2013.04.018. - DOI - PMC - PubMed
    1. Xiao Y., Xu W., Du Y., Zhang M., Yang H., Bi H. Arsenic content, speciation, and distribution in Wild Cordyceps sinensis. Evid. Based Complement. Altern. Med. 2021;2021:98. doi: 10.1155/2021/6651498. - DOI - PMC - PubMed
    1. Łysakowska P., Sbota A., Wirkijowska A. Medicinal Mushrooms: Their Bioactive Components, Nutritional Value and Application in Functional Food Production-A Review. Molecules. 2023;28:5393. doi: 10.3390/molecules28145393. - DOI - PMC - PubMed

LinkOut - more resources